
AI
Introducing Querri
Re-imagine your data workflow! Clean, move, and analyze data effortlessly with Querri using GenAI. Early Access available now. Empower your data...
It is always delightful to spend some time outside at night and take in the stars. However, this is not possible on a cold and cloudy night. In a mood to explore, I realized even majestic phenomena can be reduced to raw data. A quick trip to Kaggle, logging in, and uploading to Querri kickstarted my personal exploration of the stars.
Querri empowers users to explore data using natural language, making curiosity-driven investigations ideal. In this instance, simply delve into the data to discover new insights about the universe and explore Querri's functionalities along the way.
Many of the following sections begin with a natural language prompt from Querri. When a natural language prompt is entered, Querri processes it and generates informative pop-ups on the right-hand side of the screen.
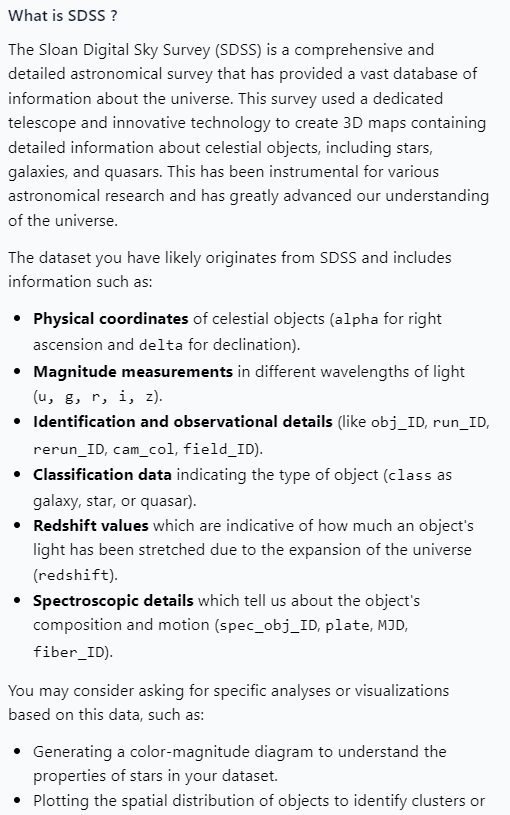
The Kaggle website labels this dataset as SDSS. Let's begin with a simple question in the Querri prompt for basic information about the dataset and SDSS.
Reply from Querri:
The goal here is to delve into data, unravel insights about our universe, and grasp effective data exploration. Querri impressively furnishes details on SDSS and categorizes the dataset, setting the stage for an informative journey. As we progress, Querri will serve as our AI assistant, offering insights and recommendations for approaching and transforming the data.
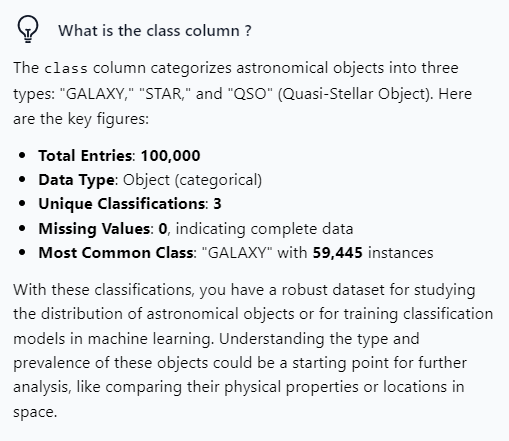
"Class" emerges as a comprehensible column. To initiate exploration, let's delve into specific columns. Querying a particular column offers a simple entry point, yielding valuable insights in this informative pop-up.
![]()
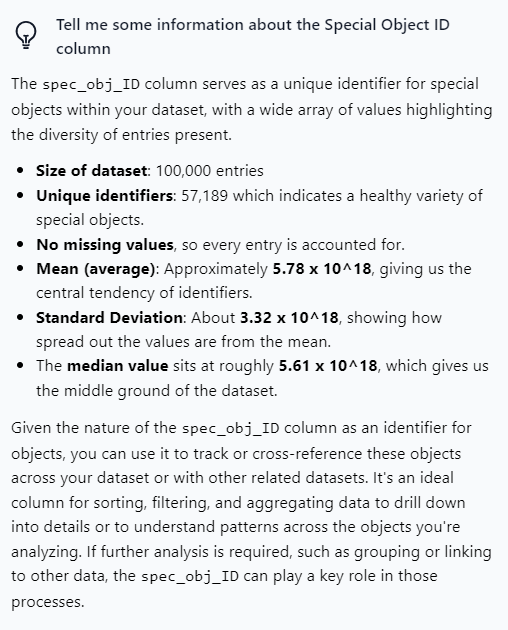
It's good to know that there are no missing values, and Querri has enlightened us about the robust nature of this SDSS data. The mathematical information is interesting and informative. Querri also identifies this field as an "ideal column for sorting, filtering, and aggregating data." This is a great example of useful information and suggestions for exploring the dataset. Knowing which fields can be used for grouping and linking will help us sort our star data, and it is good information to have on any complex data journey.
A preliminary examination of the general data columns has laid a robust groundwork to delve into more specific astronomical details. Transitioning from the previous fields, characterized by more verbal and numerical descriptors, the allure of the alphabetically named columns is undeniable. Guided by Querri's insights into the dataset's nature, specific data features, and recommended approaches for exploration, the shift toward a more targeted interest is seamless.
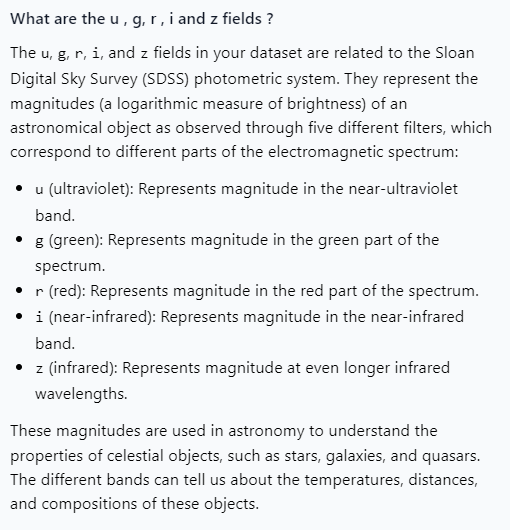
The simplicity of these alphabetically named fields in the context of a dataset encompassing stars, galaxies, and quasars sparks curiosity. Fortunately, a straightforward question in the prompt can propel us further on our journey through the vast realm of data space. What secrets do these simple letters hold?
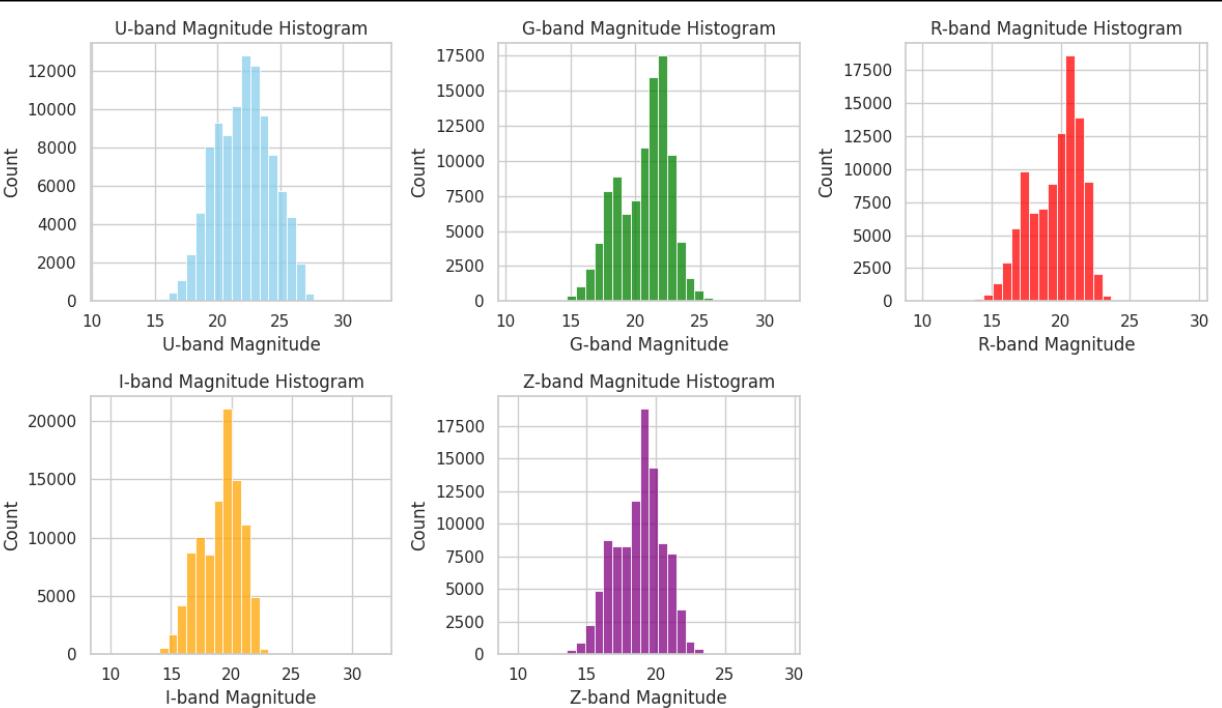
As we conclude this segment of our exploration, let's add a visual dimension to our adventure. Querri has enlightened us about the colors of the bands represented by simple letters for the stars. Before embarking on the next phase of our journey, let's request a graph to visually comprehend our data.
Querri has provided a comprehensive overview of the SDSS dataset, focusing on specific columns and intriguing fields. A compelling visualization of magnitude will serve as inspiration for delving deeper into the data. In our next session, we'll embark on transforming data related to the brightness of stars, sparking further insights. Join us next week as we continue our exploration of star data with Querri!
Re-imagine your data workflow! Clean, move, and analyze data effortlessly with Querri using GenAI. Early Access available now. Empower your data...
From data accessibility to data activation, these are our predictions on what will shape the future of data management and analysis in 2024 and...
We think you’ll be amazed at what you can accomplish with Querri. Whether you’re cleaning up a spreadsheet or automating your company's operations.