Thanksgiving Journey Through Data: Day 3 (Sides)
Savory Sides & Satisfying Surprises When it comes to Thanksgiving, the sides often steal the spotlight. From creamy mashed potatoes and savory stuffing to zesty cranberry sauce and buttery rolls, the variety and richness of side dishes are what make the feast unforgettable. Querri is thrilled to take our readers on a 5-day Thanksgiving journey Through Data.

Savory Sides & Satisfying Surprises
When it comes to Thanksgiving, the sides often steal the spotlight. From creamy mashed potatoes and savory stuffing to zesty cranberry sauce and buttery rolls, the variety and richness of side dishes are what make the feast unforgettable.
Querri is thrilled to take our readers on a 5-day Thanksgiving journey Through Data.
We'll travel back in time to uncover what was on America’s plate that Thanksgiving night in 2015. Here is a list of what we will cover over the next 5 days:
Day 1: Exploration of the Survey participants —who they are, where they’re from, and how they are distributed throughout the country. (Read here.)
Day 2: Sweet tooth alert! 🍰 Dive into America’s dessert favorites and regional pie debates. (Read here.)
Day 3: Sides steal the show. 🥗 From stuffing to green bean casserole, we’ll uncover the sides that bring families together.
Day 4: The main event: Turkey vs. alternatives—what was trending and who was replacing turkey with other alternatives.
Day 5: Beyond the table—Black Friday shopping trends and the growing popularity of Friendsgiving a decade ago.
The Dataset
This dataset is mainly about the food on the table, but there is also great information about people. 1058 people responded to the 538 Thanksgiving Dinner survey conducted in 2015. They were from all over the country. The list of survey questions can be viewed at the link above.
In today’s exploration of Thanksgiving data, we’re diving into the sides that graced tables across the nation a decade ago. What were the must-haves? Did regional trends dictate the menu? And how have preferences evolved over time? Let’s dish out the data and uncover the stories behind America’s favorite Thanksgiving sides! We begin our Day 3 journey with an exploration of our data.
Querri Prompt:
Create a visualization to show a general preference for side dishes
Click to zoom
Querri Understands You!
Transposing columns in Excel is straightforward, but what if you need to transpose them and collapse all transposed columns into a single column? With Querri, you could do this faster than you can say, "Oooh, creamy mashed potatoes!"
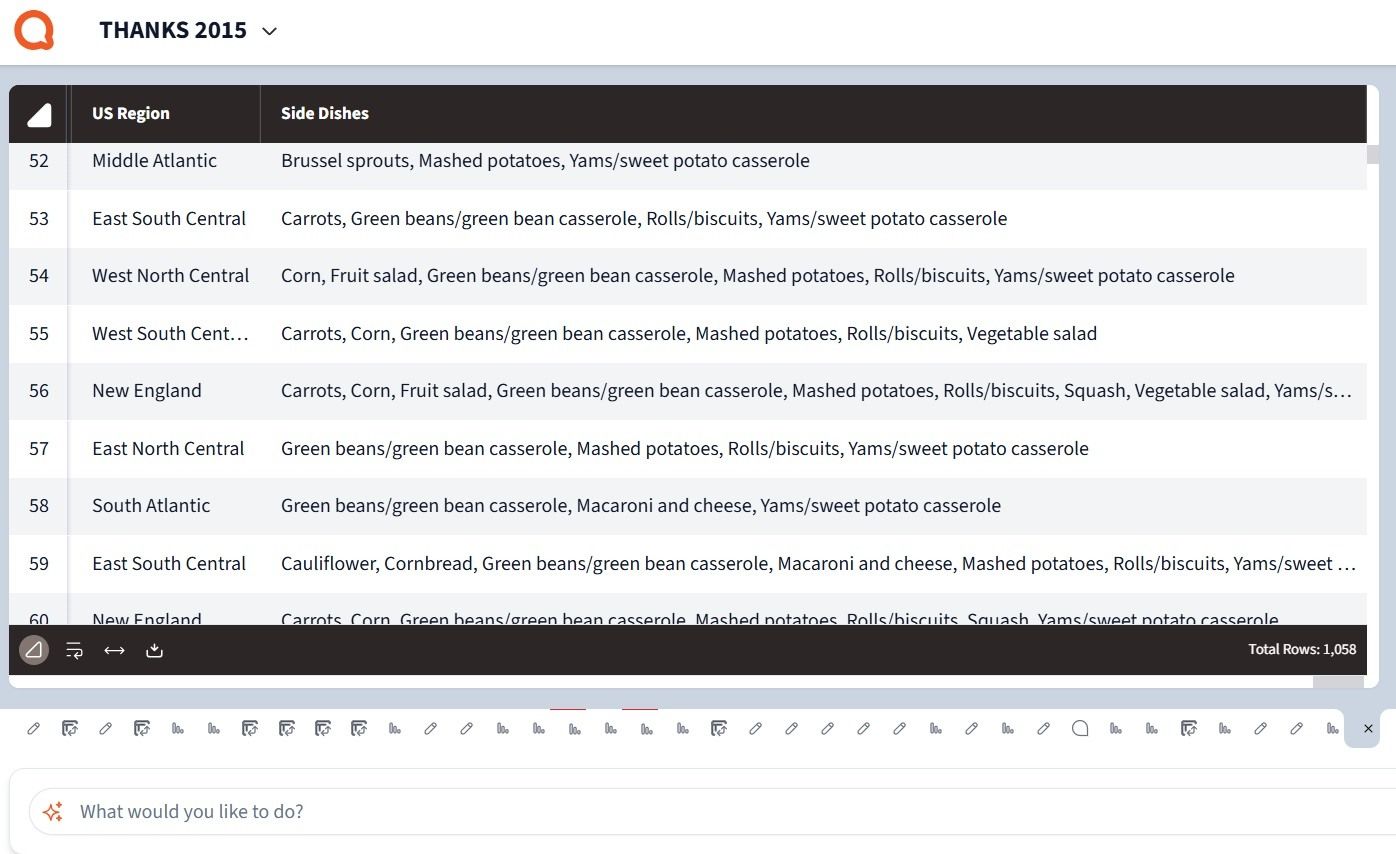
In the image below, each column represents a survey question as its header. The questionnaire asked users, "Which of these side dishes are typically served at your Thanksgiving dinner?" The survey results created multiple columns—one for each side dish option. To be able to perform a deep analysis of the side dishes, we wanted to collapse all options for each region into a single column, with comma-separated values of side dish preferences for each region. Using Querri, we seamlessly collapsed all these columns into a single column per region, with the side dish options neatly combined as comma-separated values.
Even though our prompt wasn’t perfectly clear, Querri understood our intent and delivered exactly what we needed—no extra effort required!
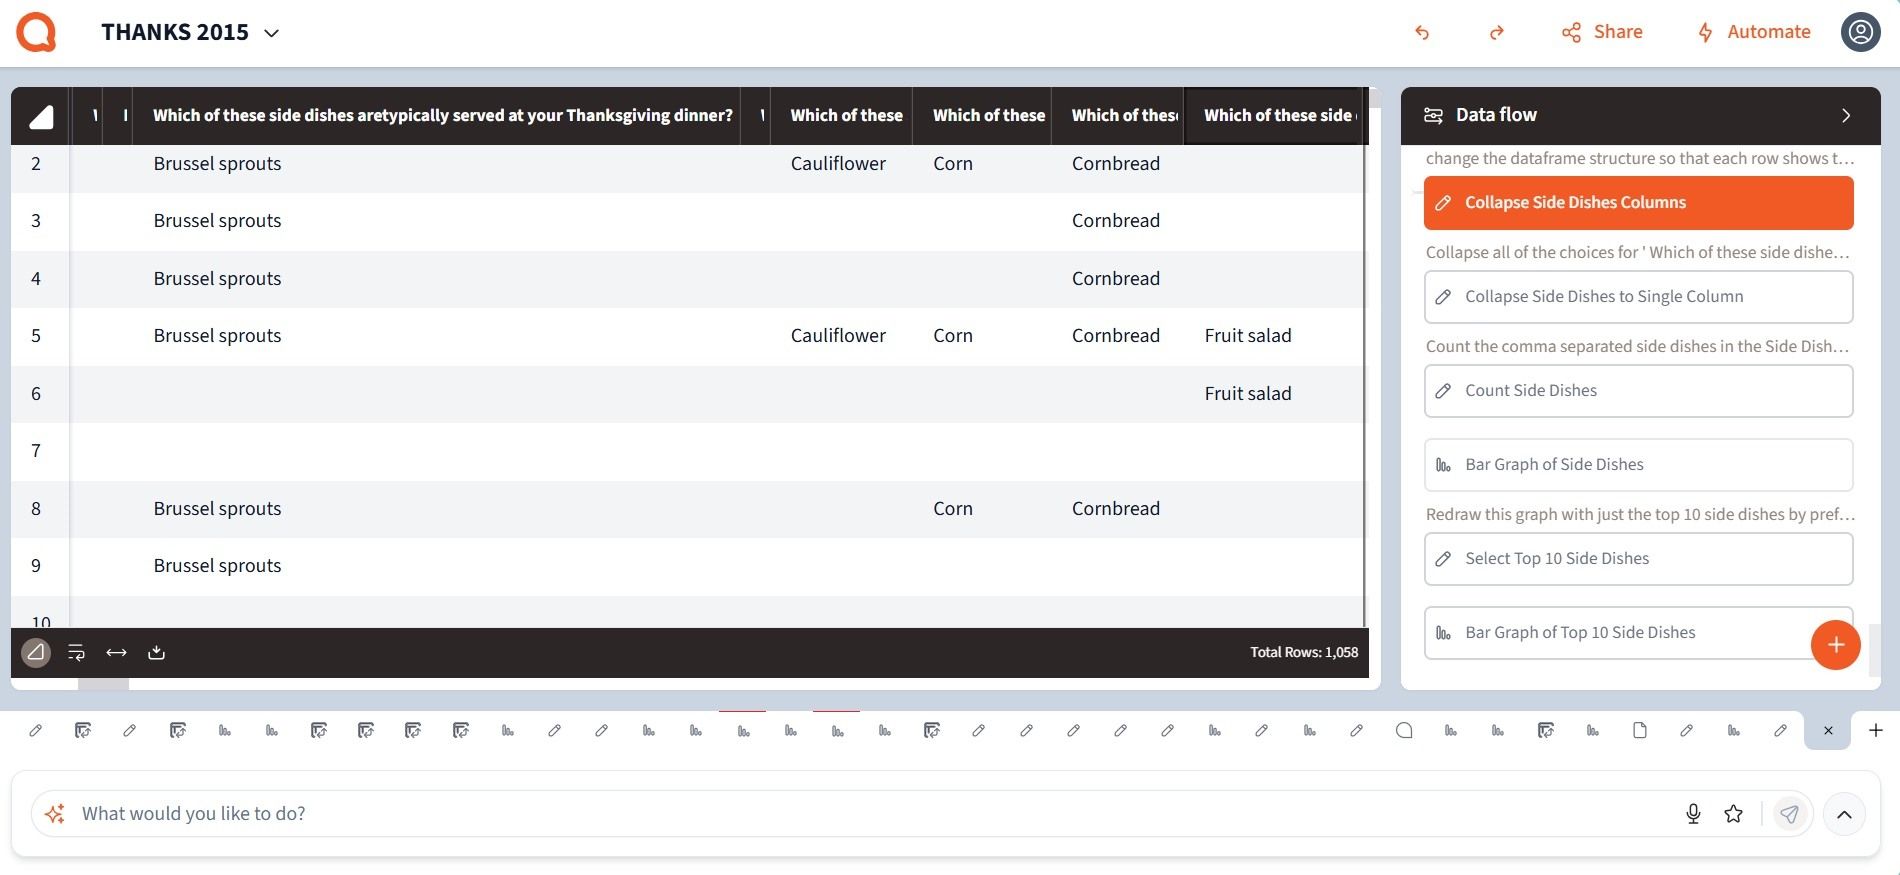
This is a great example of Querri easily changing the shape of the data structure.
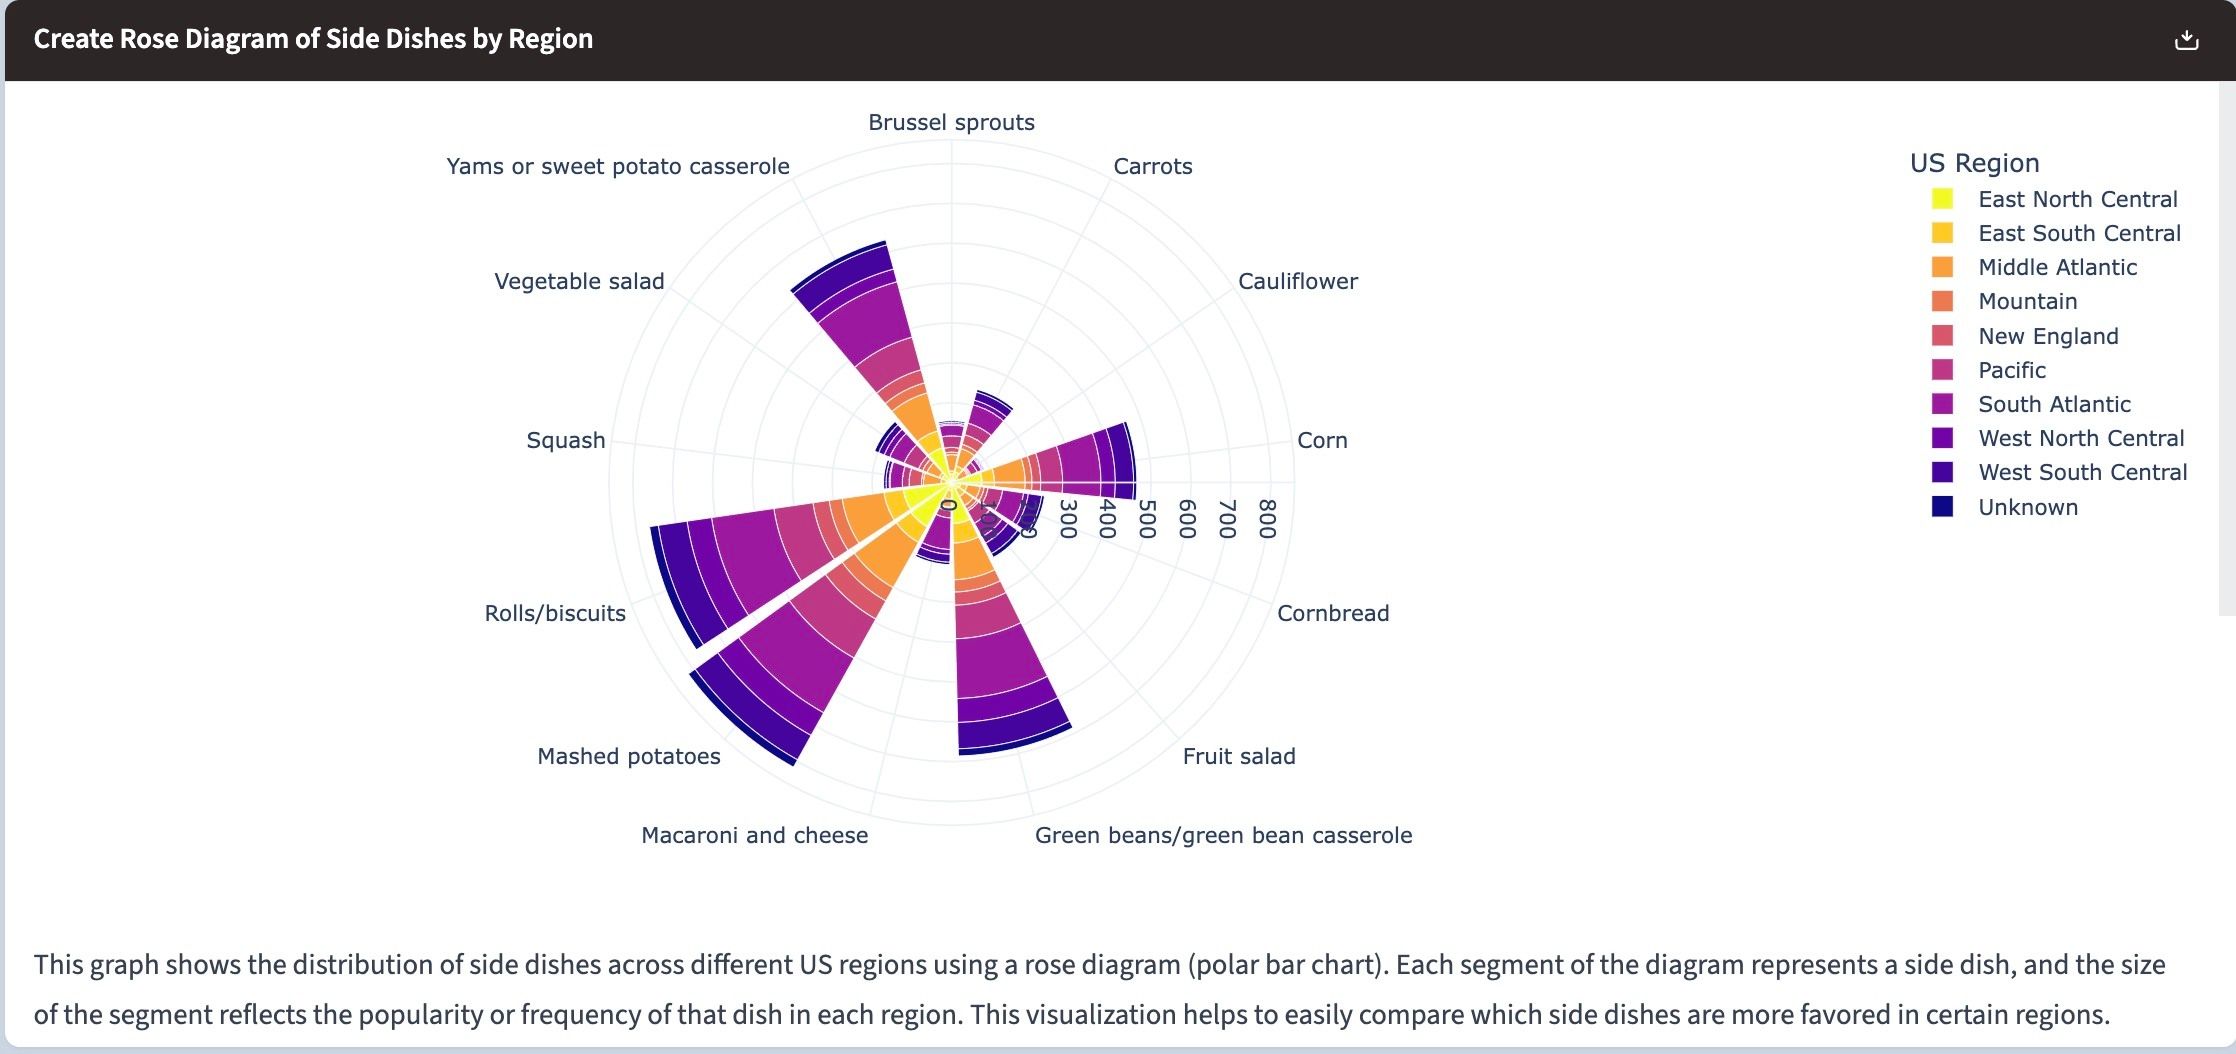
We then used this re-organized data to execute several analyses. Below is a rose diagram of side dishes by region. As we can see, mashed potatoes and rolls/biscuits are close winners, followed by green bean casserole, followed by yam/sweet potato casserole.
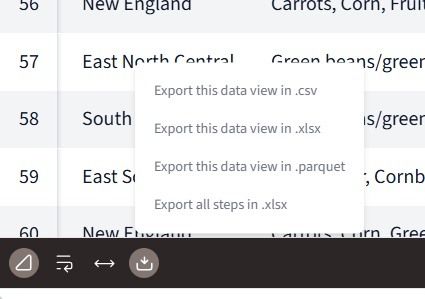
Seamless Exports
Querri makes it easy to export both your data and the steps taken to achieve it. Data can be exported in formats like .csv, .xlsx, or .parquet. The exported steps can be reused to start a new project or shared with colleagues for seamless collaboration.
(A parquet file is a columnar storage file format designed for efficient data storage and retrieval, and it is widely used in big data processing frameworks like Apache Hadoop, Apache Spark, and AWS Athena. It is particularly suitable for large datasets and analytical workloads.)
Stepping into Querri’s Superpowers 💪
We’re midway through this 5-day series, and it’s time to talk about Steps. In Querri, Steps provide a clear view into the actions taking place. Transparency is at the core of Querri’s design.
AI transparency is the practice of making artificial intelligence systems open and comprehensible, revealing their inner workings, decision-making processes, and underlying mechanisms.
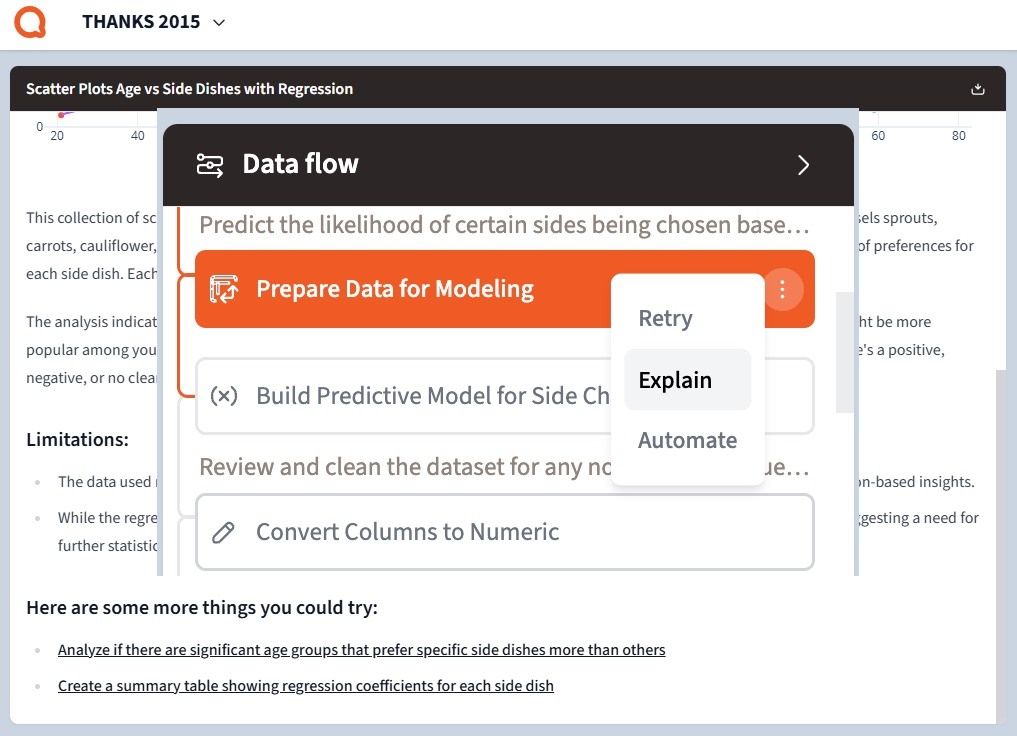
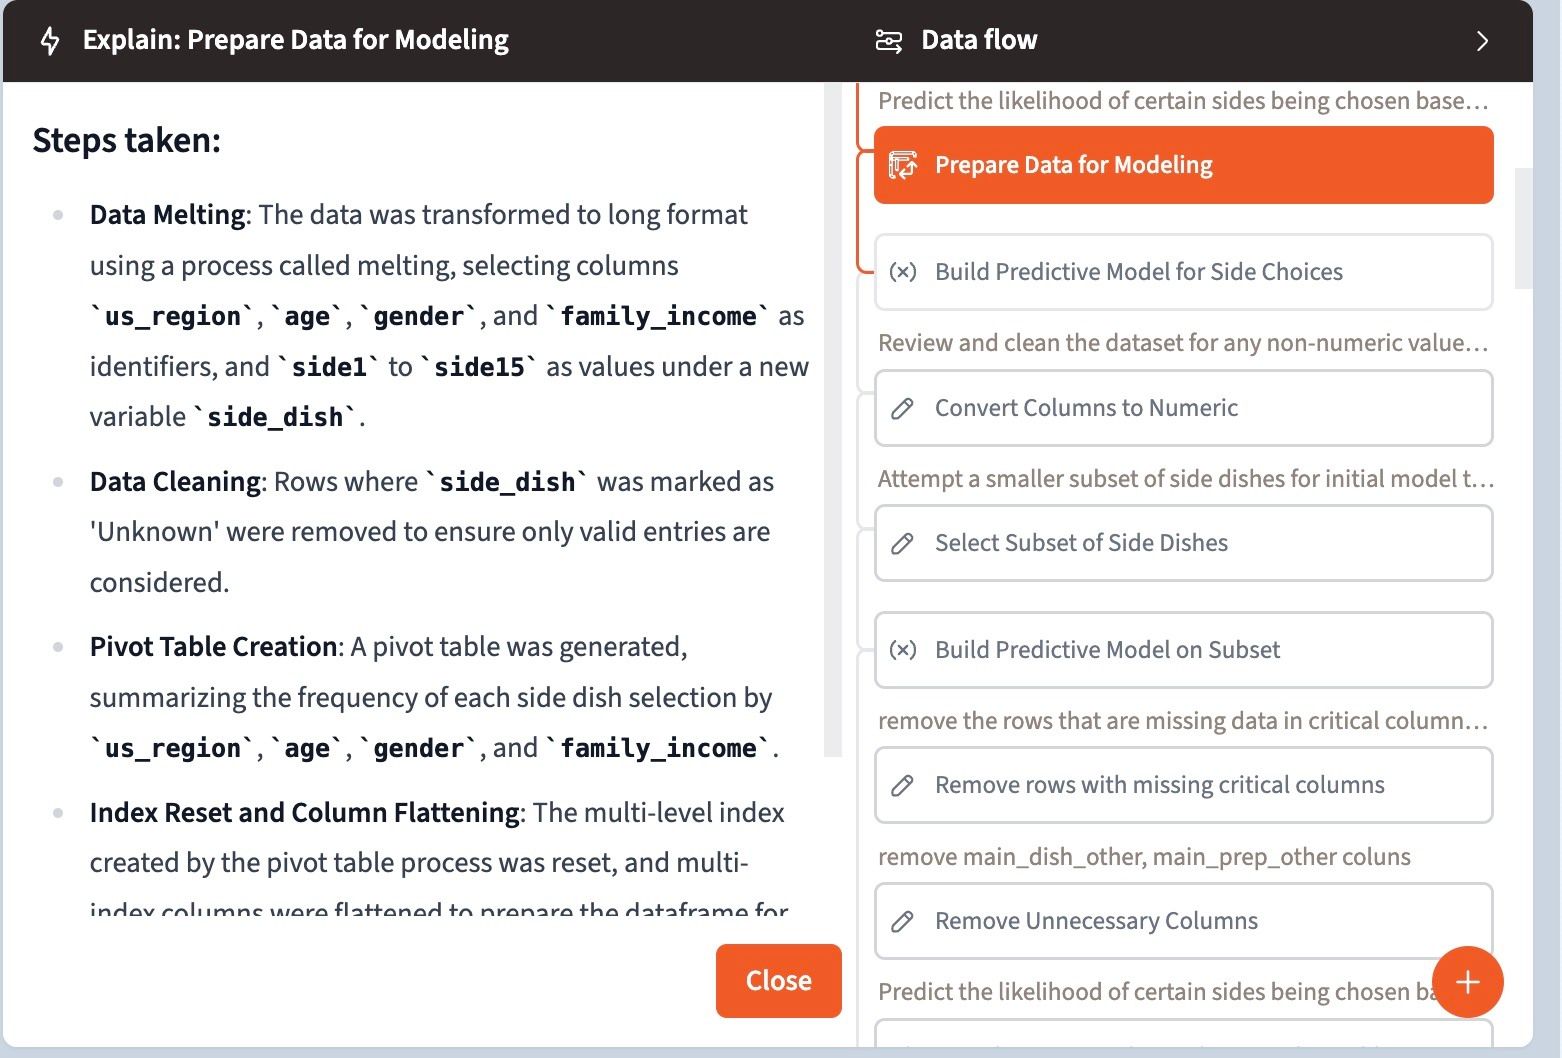
It involves providing clear insights into how AI algorithms operate, including the data sources, training methodologies, and reasoning behind specific outputs. While Querri boasts of superpowers that can transform tasks traditionally requiring hours into just minutes, it does so with full visibility. A single complex prompt might trigger several intermediate actions within Querri, but every step is meticulously documented. You can explore these details easily—just click the 3-dot icon in each step and select Explain to see a complete breakdown of each step.
No More Data Mishaps ❌
Ever deleted a column or some data in Excel, only to realize your mistake the next day? The usual fix—going back to the original file (if you saved it), copying the missing data, and hoping it doesn’t mess up your calculations—can be a tedious and risky process. Worse, what if you don’t even have access to the original file? With Querri, those worries disappear.
Every action, prompt, and response is automatically saved and documented. You can jump between steps or undo actions without losing a single piece of data, eliminating the need to keep multiple file backups. Say goodbye to data mishaps and hello to worry-free analysis!
Let’s be real—sometimes Querri might be unable to complete a task and could error out. This might happen due to insufficient or inaccurate data or because the prompt wasn’t quite right. When this happens, the step will appear in red to signal an error. Hover over the info icon, and Querri will honestly explain what it was trying to do and why it didn’t work—like a candid child owning up to a mistake.
Calling It A Day On Day 3
As we wrap up Day 3 of our Thanksgiving journey, we’ve savored the essential sides that complete the holiday feast—just like Querri’s ability to bring transparency and clarity to your workflows.
Today, we explored how Querri bridges the gap between vague, cryptic prompts and actionable, precise results, making even the most complex tasks feel effortless. Here’s what we achieved today:
Explored side dish trends from a decade ago, uncovering regional favorites.
Took a closer look at Steps, appreciating the transparency of detailed documentation and the time-saving superpowers it offers.
Just as Thanksgiving is about coming together and sharing, Querri thrives on understanding and visibility, ensuring every step is clear and well-documented.
In the meantime, dive into this dataset in Querri! Download it below and let your curiosity lead the way—build on what we’ve shared or ask your own burning questions.
Sign up for the Querri trial and download the Day 3 data below. We will see you tomorrow, Day 4, with the Star of the Table - The main dish (and some alternatives) at the Thanksgiving table.