Querri for Data Analysts
When we built Querri, our mission was simple: make data analysis accessible to everyone — not just analysts and engineers. But along the way, something powerful happened. We realized Querri doesn't just empower non-analysts; it makes data analysts themselves faster, more effective, and more trusted by their stakeholders.

Querri for Data Analysts
By Dave Ingram, CEO & Founder of Querri
At Querri, our mission has always been to make data work accessible to everyone, regardless of technical background. We built Querri to offer an intuitive, easy-to-use experience that empowers business users to explore and analyze their data quickly, without needing advanced expertise. Simplicity and speed were our top priorities, so users can uncover insights in just a few clicks. However, beneath this streamlined interface, we've woven in powerful, "hidden" features designed especially for data analysts. These advanced capabilities allow seasoned professionals to dig deeper, validate Querri's analysis at every step, and ensure that what feels like magic on the surface is backed by robust, transparent processes. Whether you're just starting out or you live and breathe data science, Querri is built to be a valuable, reliable tool in your daily workflow.
When we designed Querri, we focused on a few core principles. First, how can we accelerate the process of understanding a new dataset? And second, how can we empower you to deliver more capabilities to your stakeholders without getting buried in an endless queue of basic requests? Let's dive into how Querri addresses these challenges.
Automating Exploratory Data Analysis
One of the biggest hurdles in any new project is the initial data cleanup and exploration. There are just a lot of slow, tedious steps involved in understanding a new dataset. You throw data into Querri, and it immediately starts performing exploratory data analysis (EDA) for you. It automatically summarizes descriptive statistics, identifies data ranges, and even looks at potential join keys to figure out how you can bring different sources together.
Instead of manually pulling data into a Jupyter notebook to start this process, you get very quick insights right away. Querri will even draw exploratory graphs for you. It also provides suggestions on what to do next. If you bring in multiple datasets, it will suggest how to join them and what kind of analyses you could run. This automation removes a significant portion of the manual prep work, letting you get to the core of your analysis faster.
I came across a reel where an Indian creator showcased 7 newly invented tools, Querri was one of them. As a data analyst who works 24/7 with Excel formulas, functions, pivot tables, and Power Query, I had to check it out, and wow, it's unbelievably incredible! I honestly can't believe a tool this powerful is still so underground. It deserves to be a massive hit. Absolutely loved it. Awesome. Superb. Highly recommended!"
— MG Morshed
Advanced Analysis and Feature Engineering on Command
Once you have a handle on the data, the real analysis begins. With Querri, you can just ask for pretty much any analysis you need. It can run quick machine learning models, like regressions, and it can manipulate the dataset for feature engineering. All of this can be done using natural language, making the entire process more intuitive and efficient. You can perform your exploratory tasks directly within the platform, streamlining your workflow.
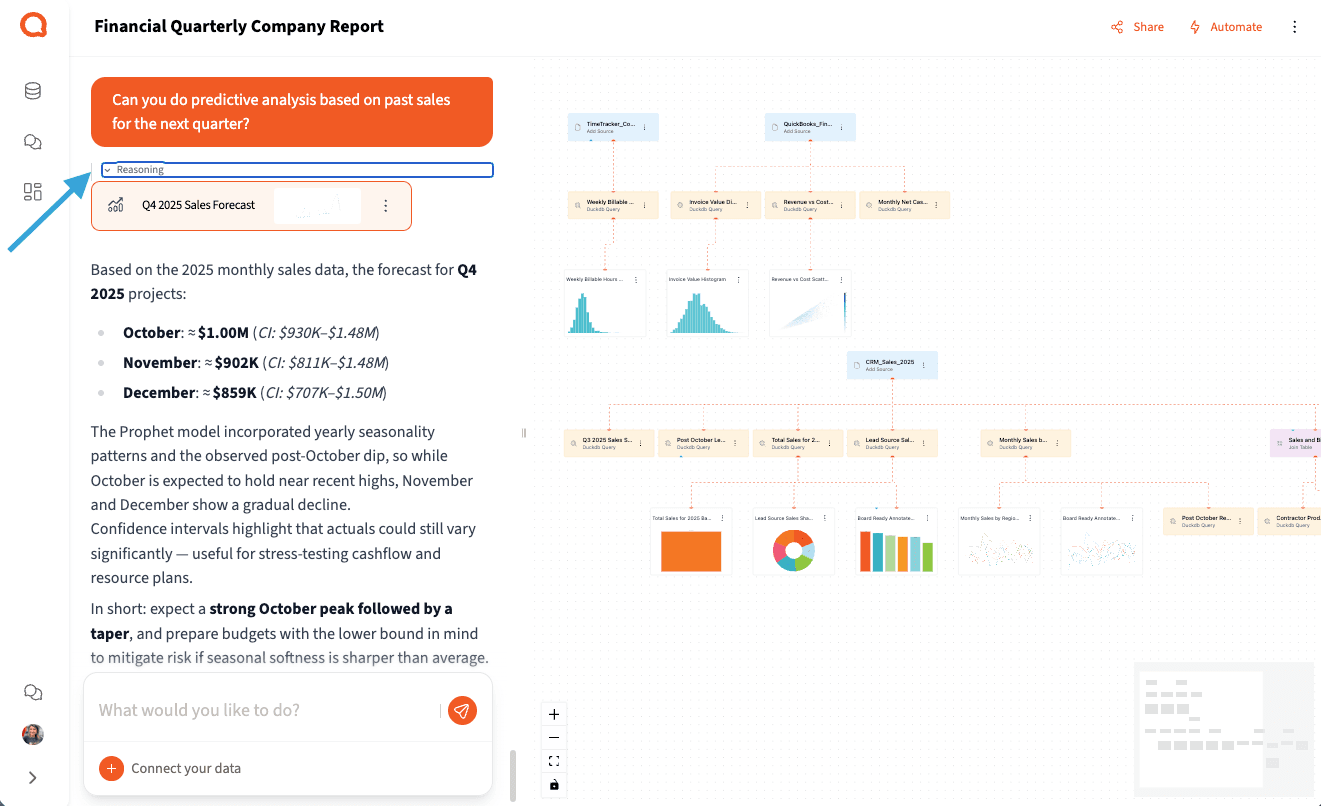
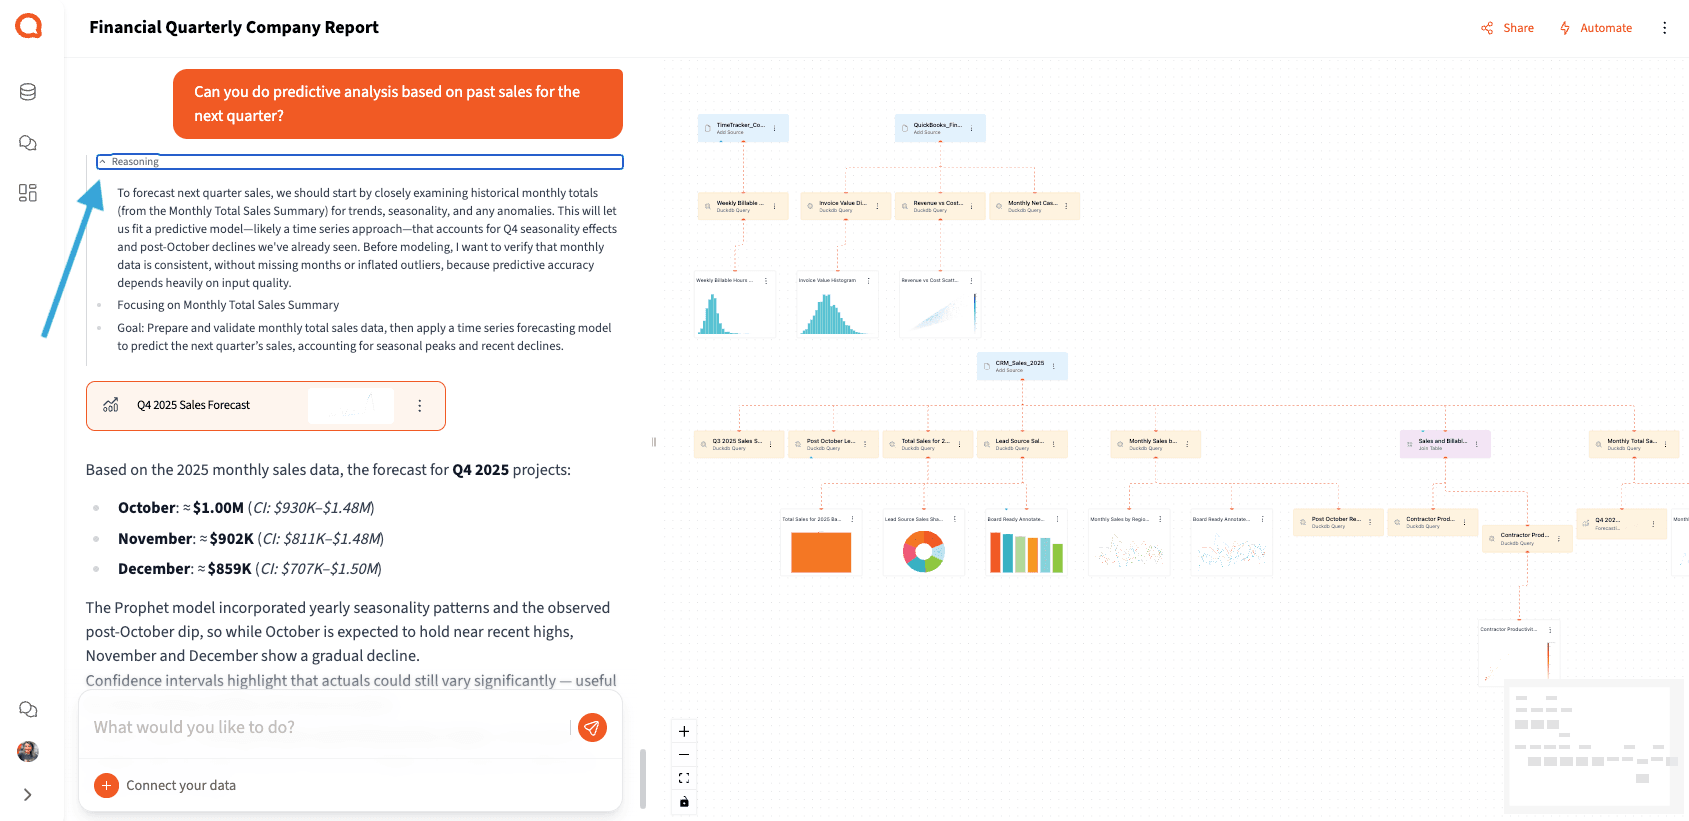
Of course, a tool that does this much needs to be transparent. You want to understand what Querri is doing behind the scenes. We built in several ways for you to see the reasoning behind its actions. The models expose their thinking, allowing you to see what it's considering and why on every step. At the bottom of the interface, there's explanatory text that you can expand to see the entire Python code that was written. It provides a full description of every transformation, giving you complete visibility and control.
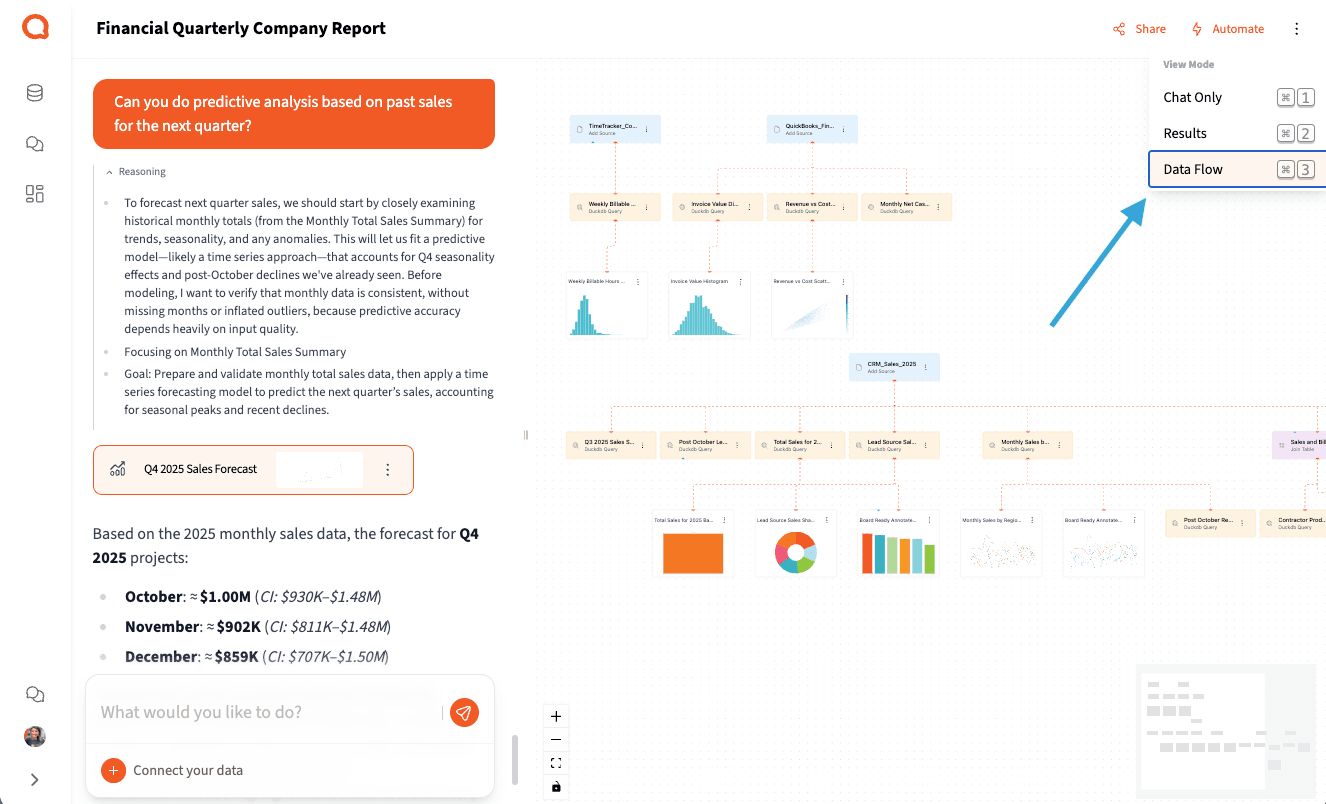
As your project grows, Querri builds a visual representation of your workflow. It creates a directed acyclic graph (DAG) — essentially an ETL graph — that shows all the analyses, joins, and transformations you've performed. You can access this in your view settings under "Data Flow." This makes it incredibly easy to track your steps and show stakeholders exactly what you did in a simple, clear visualization.
Empowering Stakeholders and Freeing Up Your Time
The other thing that data analysts find incredibly useful about Querri is the ability to give more capabilities to their stakeholders. As an analyst or data engineer, you can set up your data library using our integrations or by uploading files you may have already cleaned. You can then share view-only access to these data sources with your stakeholders.
This allows them to come in and ask their own questions, running their own projects to get the analysis they need. You no longer have to build complex dashboards with dozens of filters just to give them access to an Excel dump or a simple visualization. They can even automate some processes themselves or build their own dashboards with a simple drag-and-drop interface. And, of course, they can export transformed data into Excel files.
When stakeholders have questions about their analysis, you can easily come in and validate what they did. You can review all the explanatory text and the underlying code to see how they arrived at their conclusions. This self-service capability means your ticketing system won't be filled up with basic data analysis requests.
Focus on What Matters: Strategic Impact
By automating the mundane and empowering your colleagues, Querri frees you up to concentrate on bigger, more interesting data analysis tasks. Your role can shift from being a reactive report-builder to a proactive, strategic partner in the business. Instead of spending your days on ad-hoc queries, you can focus on the complex challenges that require your deep expertise and contextual understanding.
We built Querri to be an ally for data analysts. It's a tool designed to enhance your skills, not replace them. It handles the repetitive work so you can dedicate your time to driving strategic decisions, uncovering new opportunities, and making a more significant impact on your organization.
Tags