QUERRI FOR REVENUE OPERATIONS
Less Data Wrangling. More Revenue Impact.
What RevOps teams use Querri for
Every revenue workflow. One platform.
From pipeline coverage to forecast presentations — every analysis your team runs, in one place.
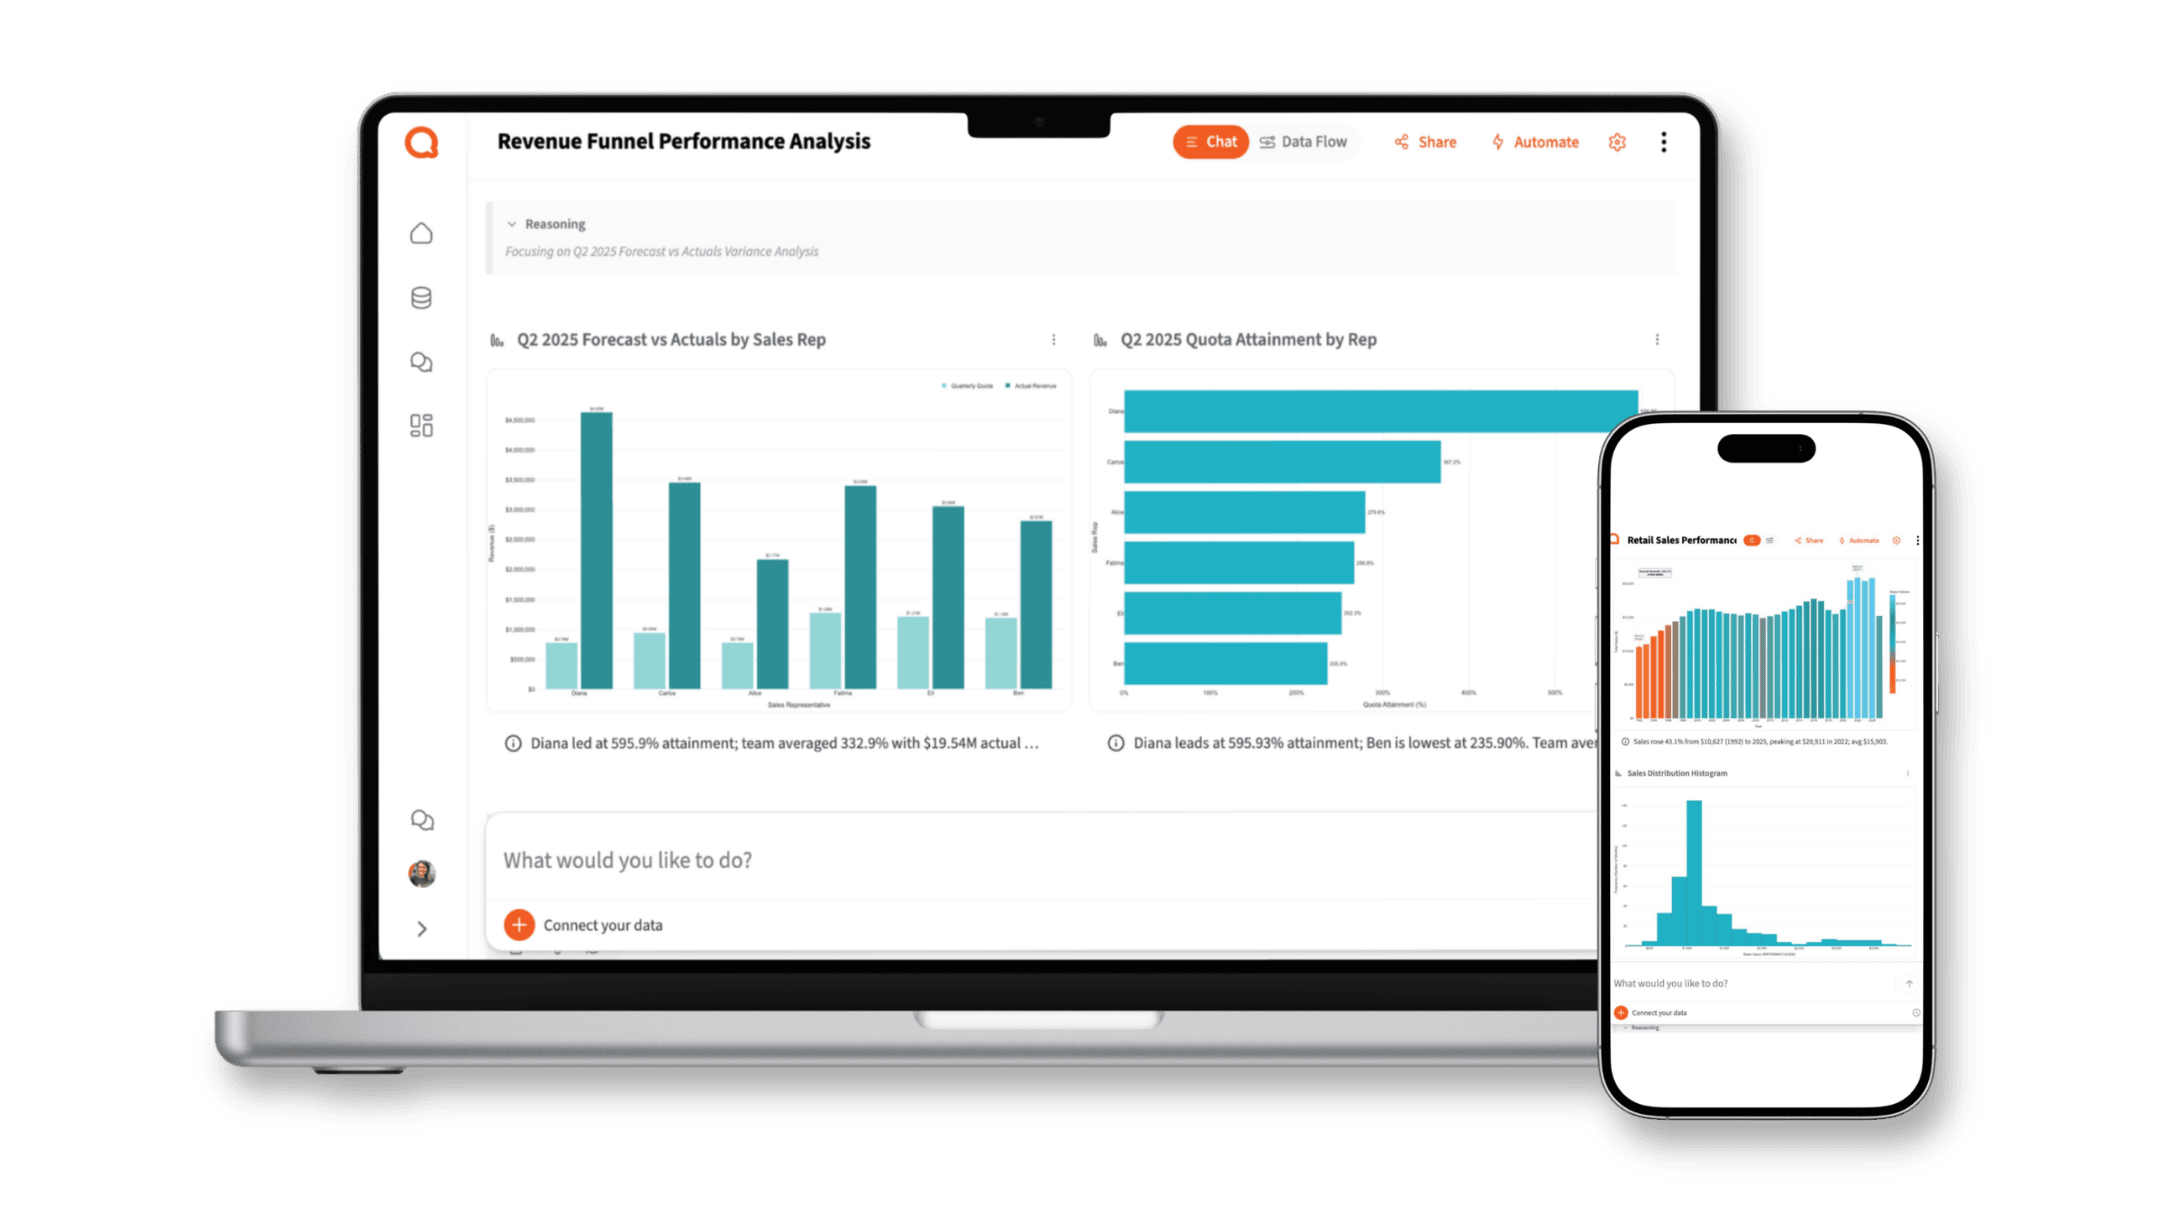
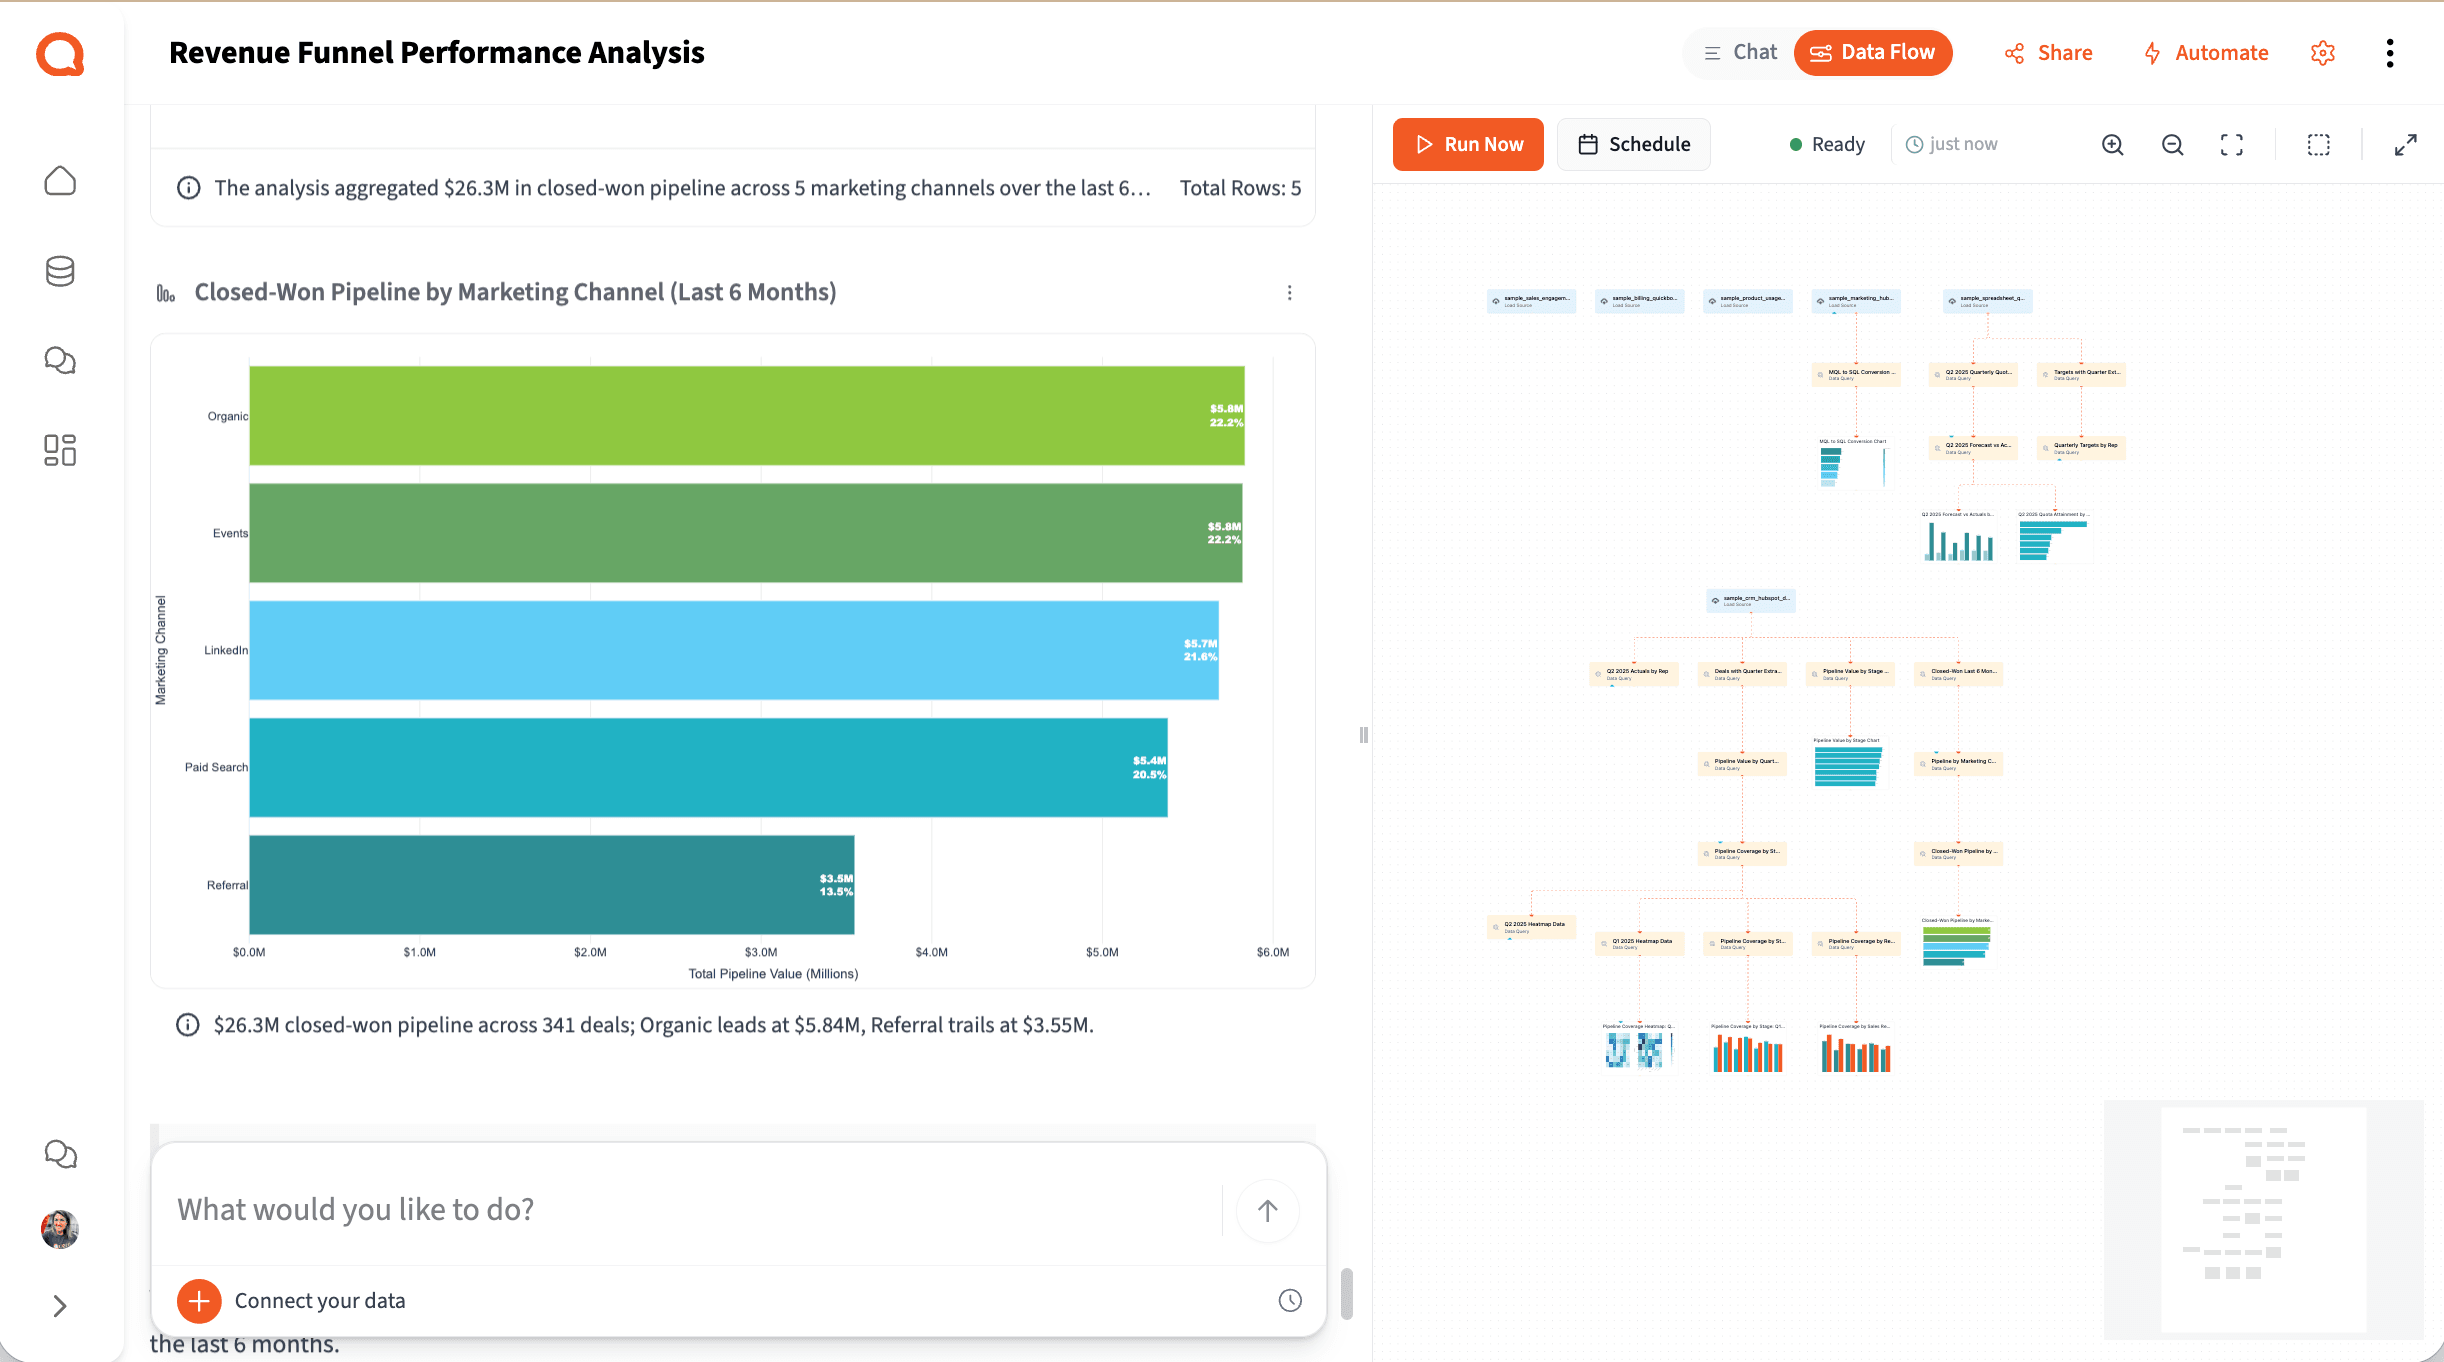
Pipeline Coverage & Health Analysis
Stop rebuilding pipeline summaries before every forecast call. Querri pulls your CRM data, joins it across sources, and tells you where coverage is healthy, where it's at risk, and which reps or stages need attention.
Try asking
How it works
How Querri Works for Revenue Operations
Step 1 — Connect
Connect Your Entire Revenue Data Stack
Step 2 — Clean
Clean the Mess That's Been Hiding Your True Pipeline
How it works
From messy CRM export to board-ready output in four steps
Any RevOps manager can run this workflow. No SQL, no data engineering ticket, no waiting in a queue.
Connect
Upload CRM exports or connect to HubSpot, Salesforce, QuickBooks, BigQuery, and Google Drive with a native integration.
Clean
Querri automatically normalizes stage names, removes duplicates, fixes date formats, and resolves mismatches across CRM and billing sources.
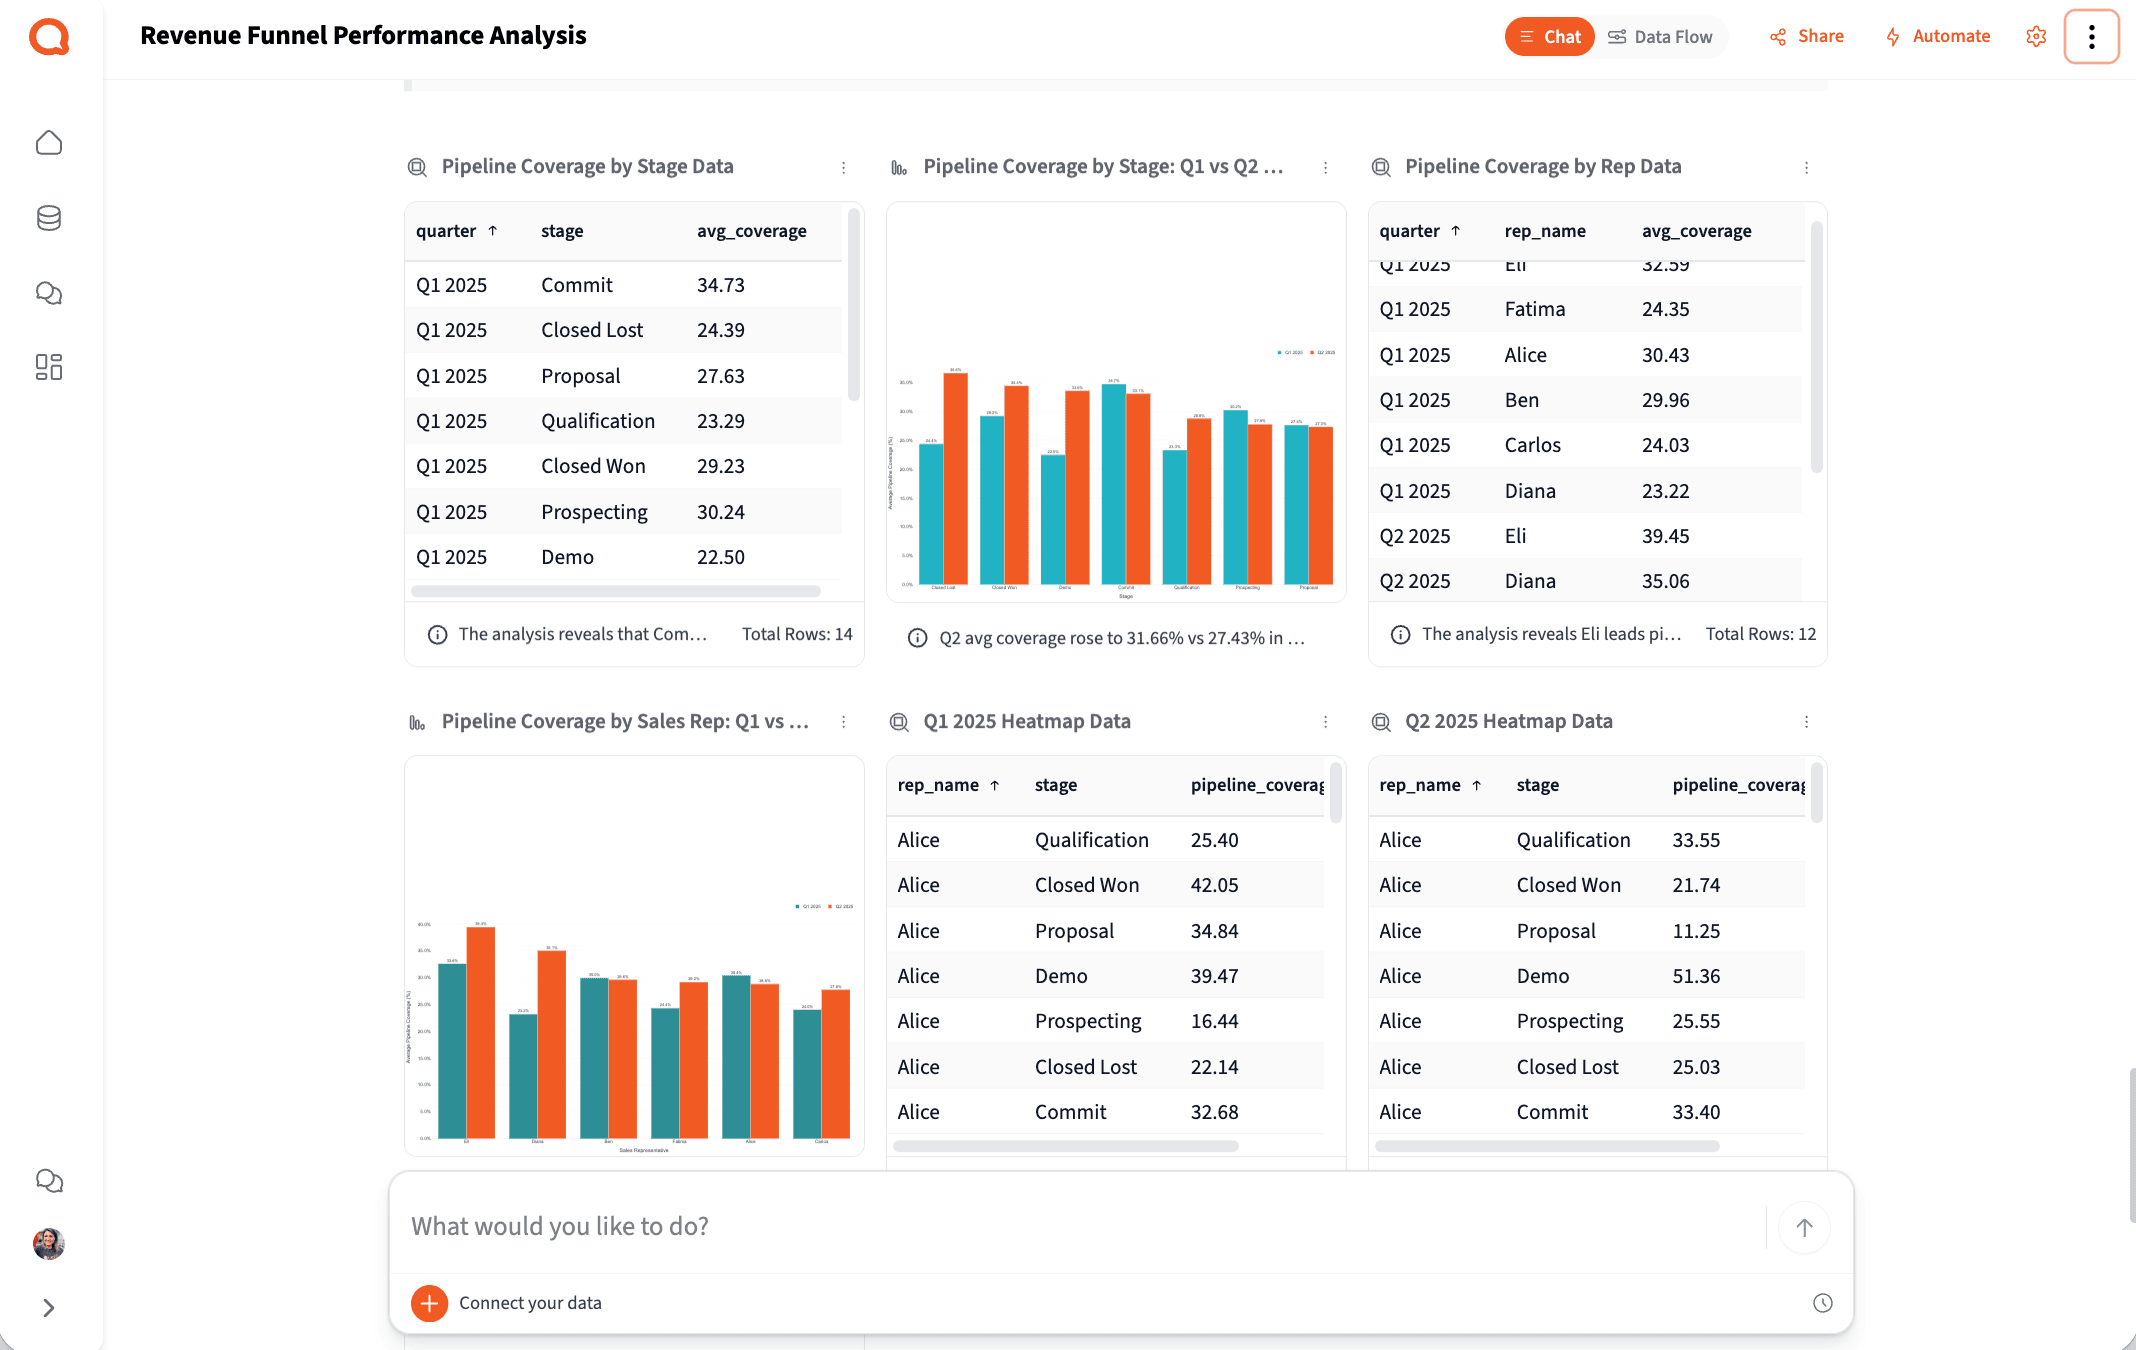
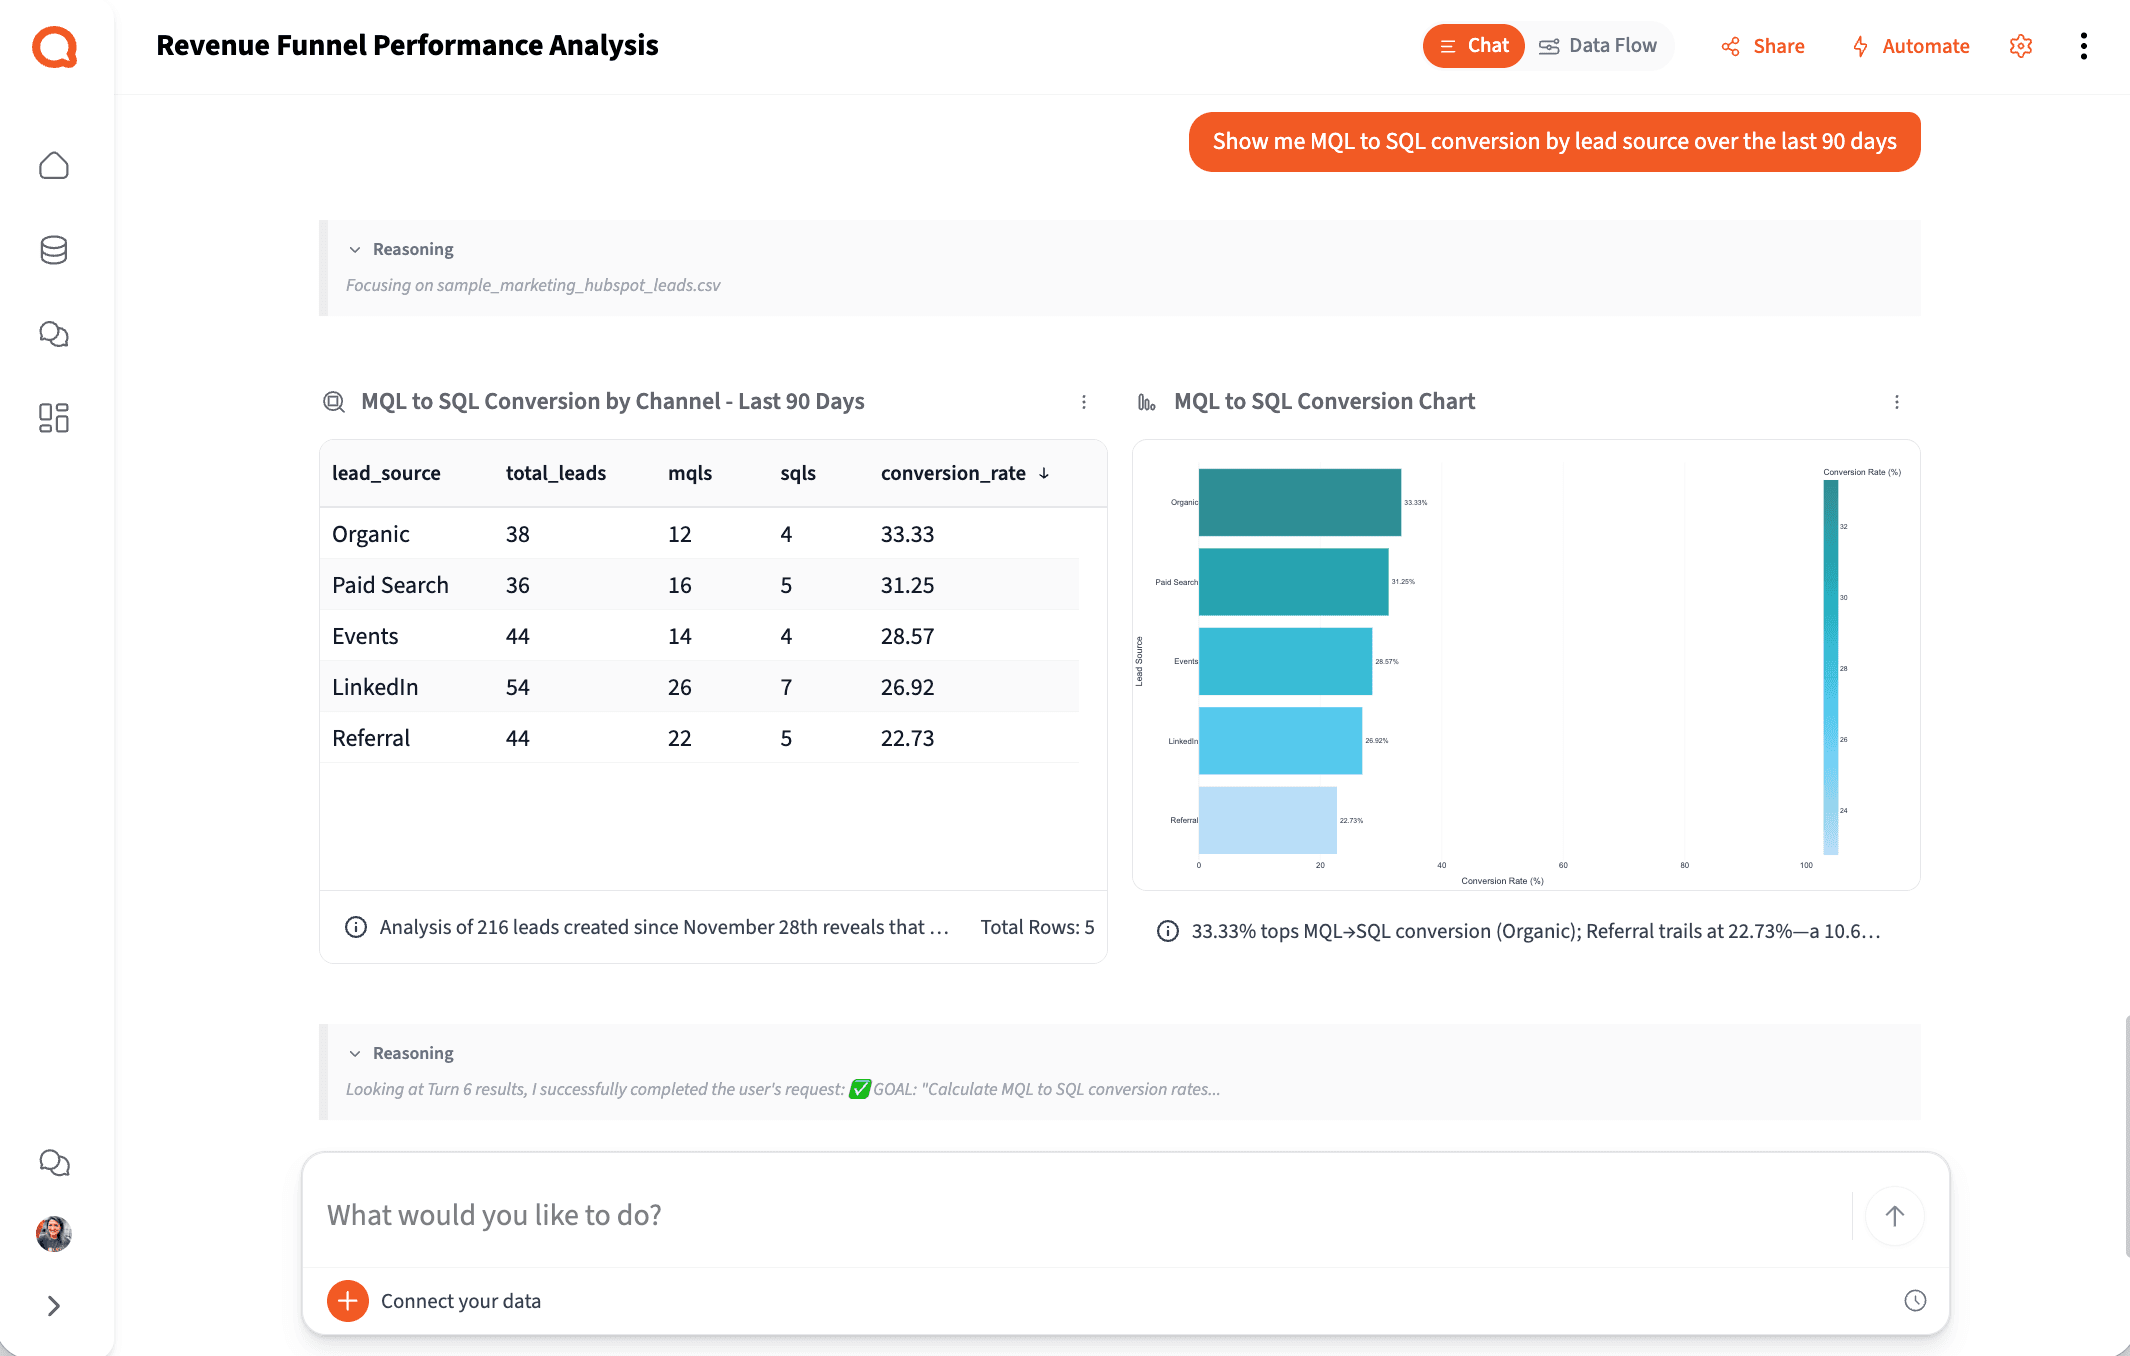
Analyze
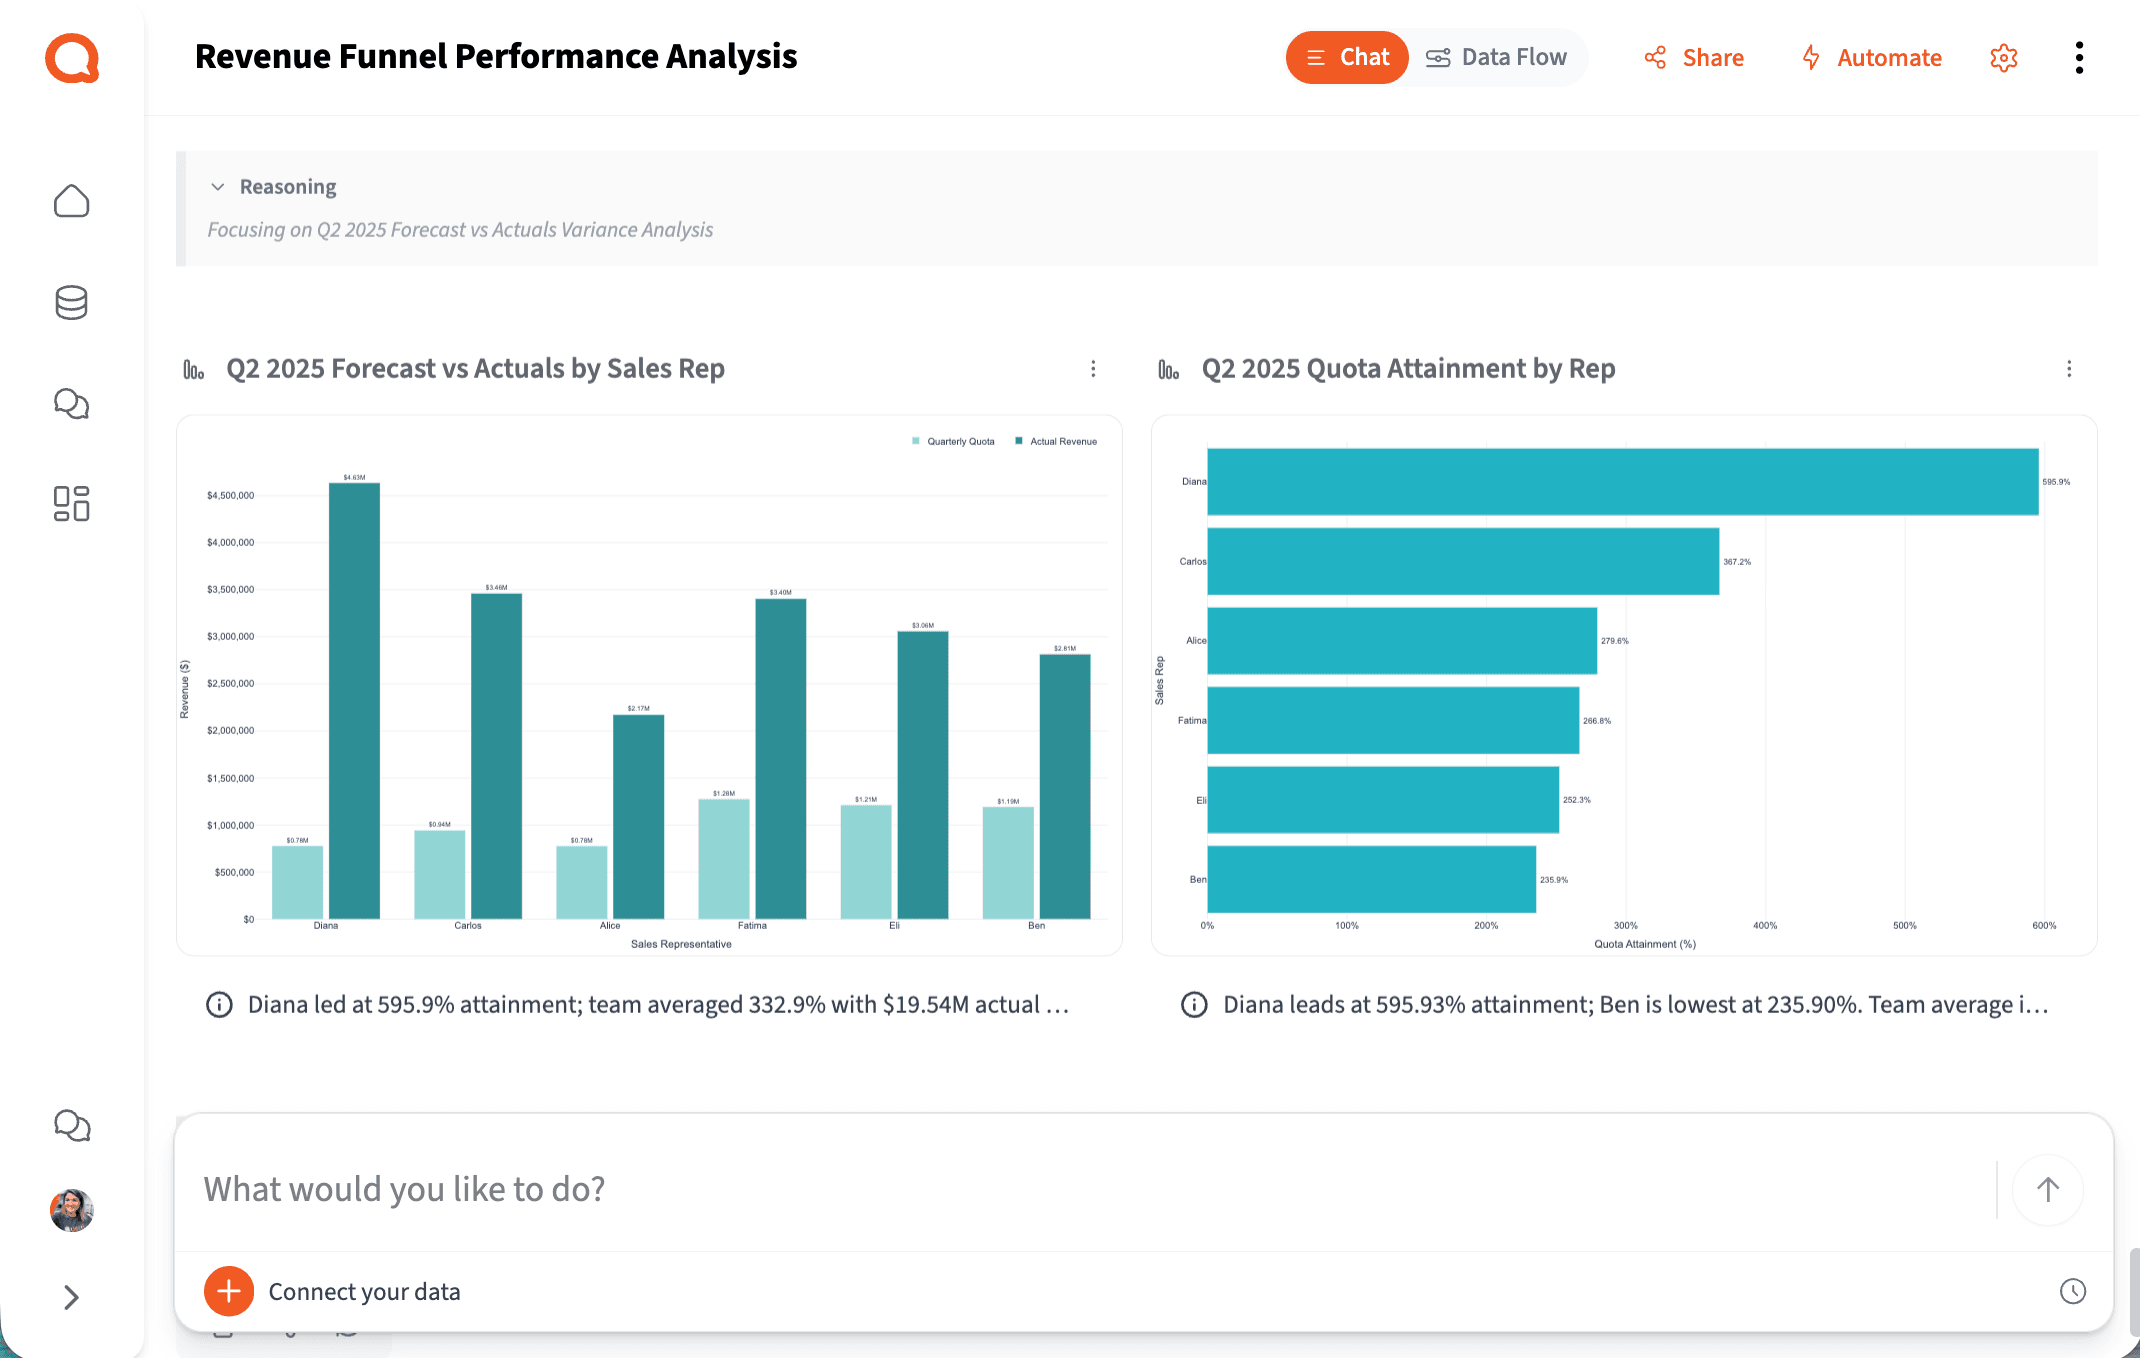
Ask your question in plain English. Querri runs multi-step analysis — pipeline coverage, funnel conversion, rep attainment, attribution — and shows its reasoning in explicit, inspectable steps.
Share
Export to Excel, PowerPoint, or PDF. Build a live pipeline dashboard. Or schedule the whole workflow to run automatically every week.
See each step in action with our playbooks
Step-by-step walkthroughs for real RevOps workflows — from connecting your CRM to building an automated weekly pipeline report.
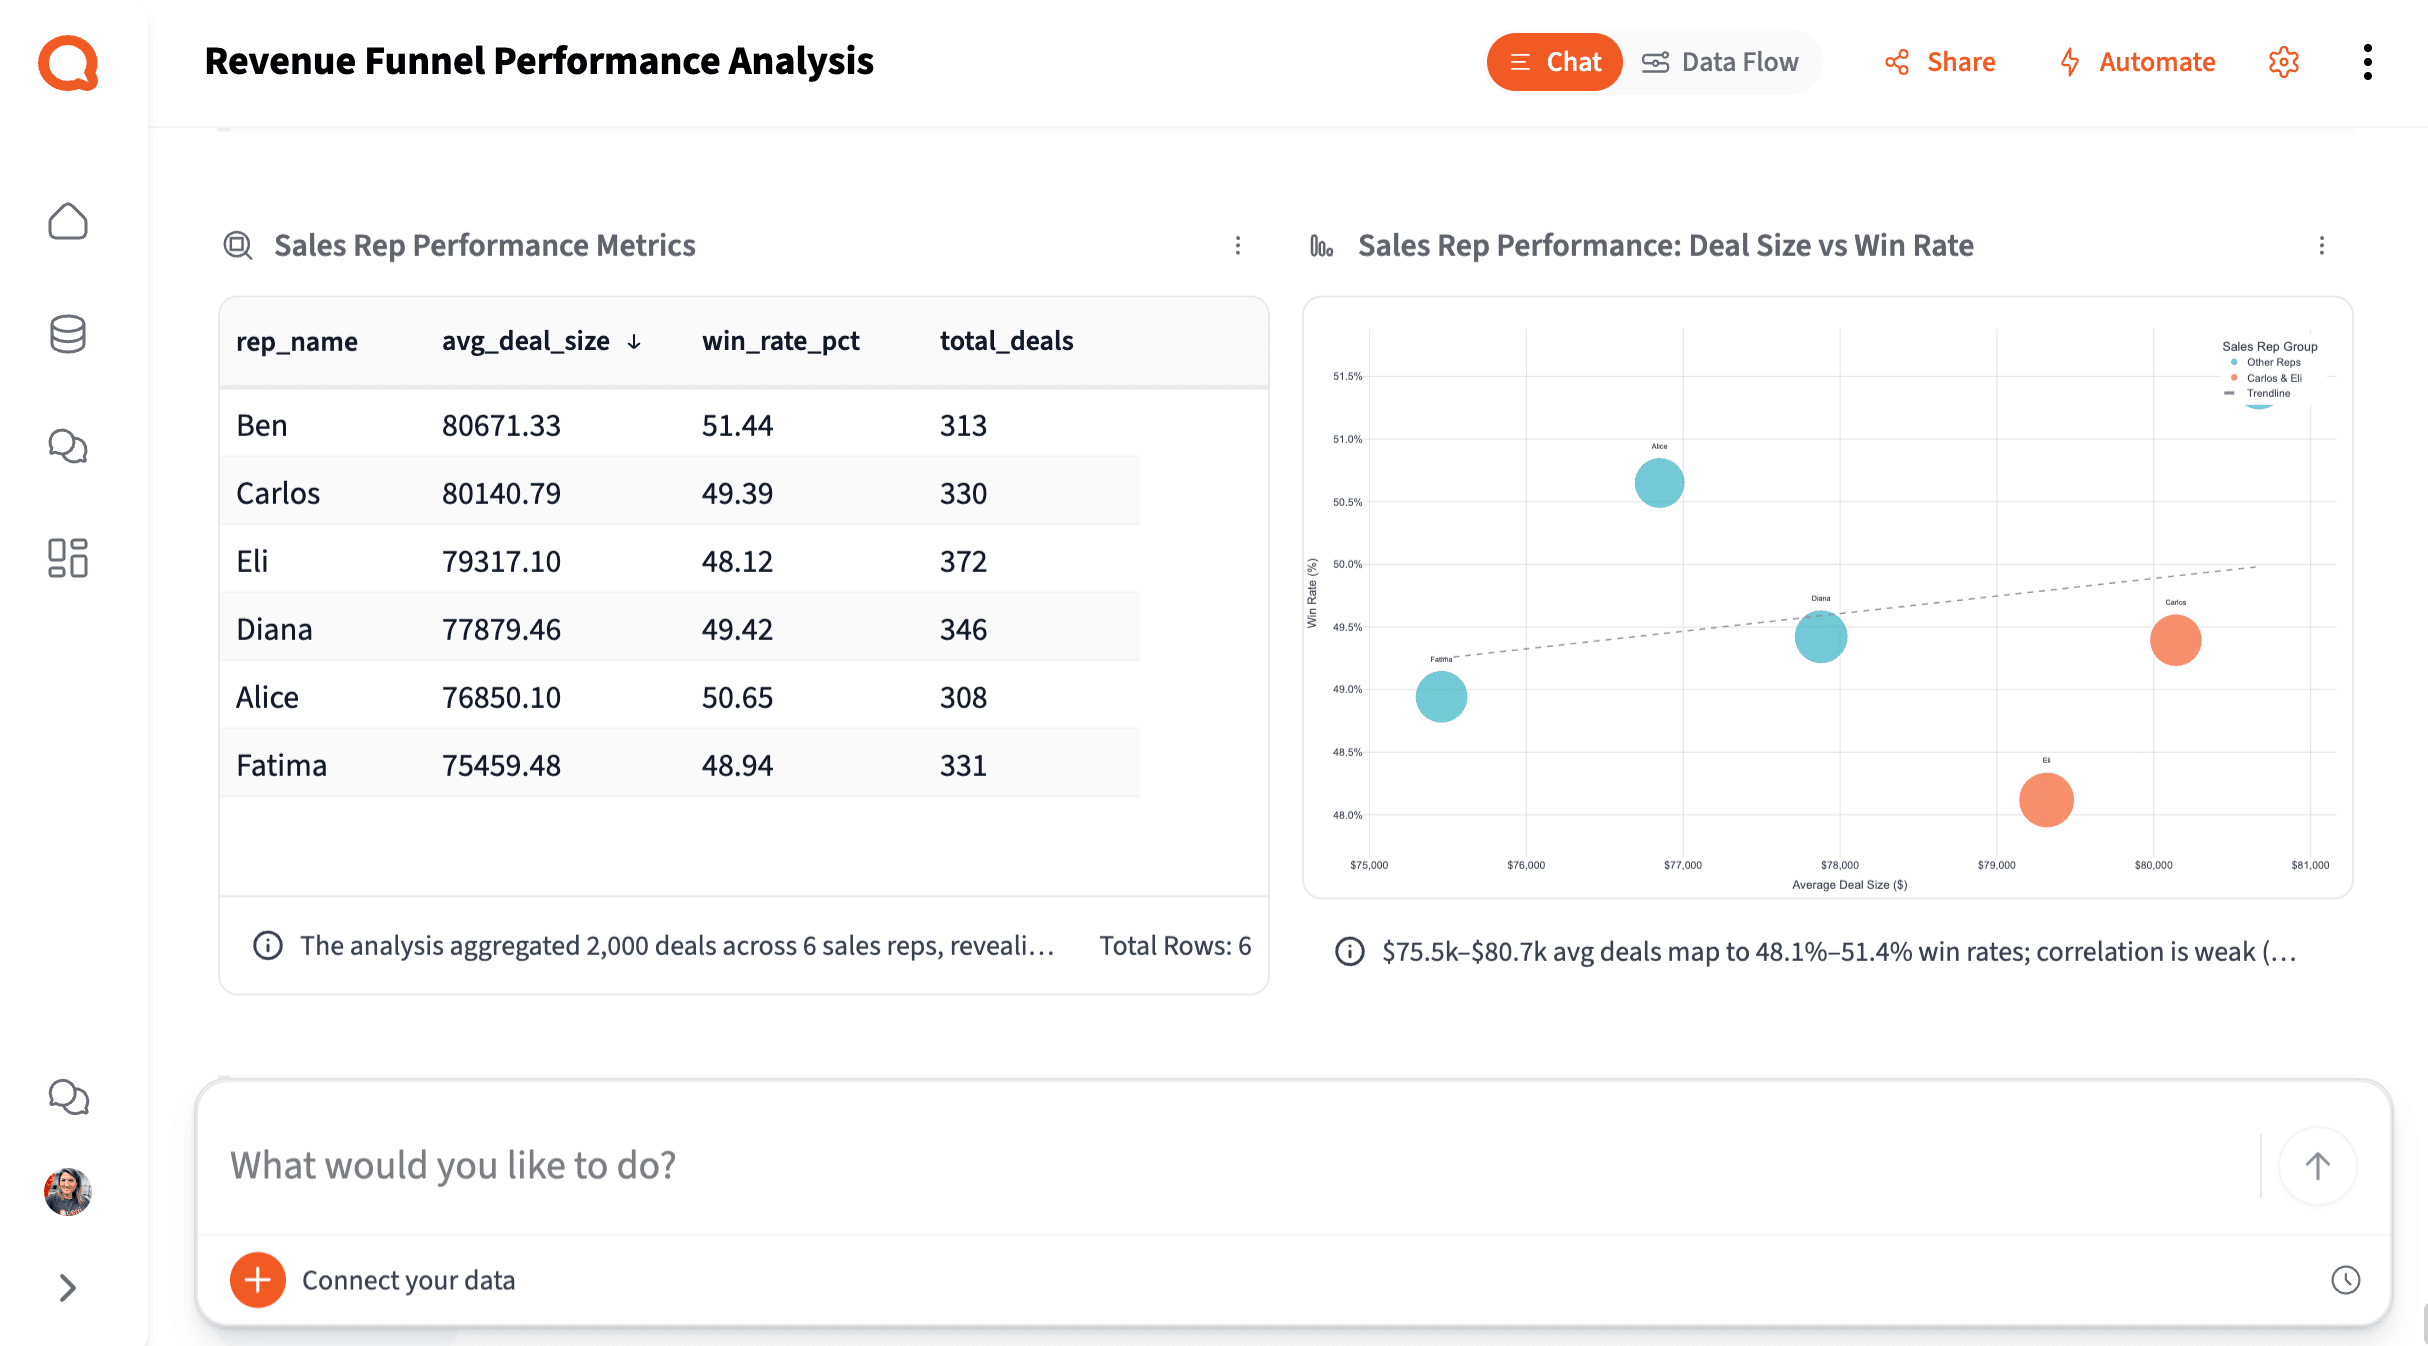
Step 3 — Analyze
Answer Revenue Questions Without a Ticket to Engineering
The reality for most RevOps teams
You own the most important data in the company — and spend most of your week just getting it ready to use.
Based on research across RevOps and sales operations teams at software SMBs.
3–5 hrs
Per pipeline report, built manually
Exporting from the CRM, cleaning in Excel, joining attribution data, writing the narrative — before every forecast call.
4+
Disconnected systems RevOps manages
CRM for pipeline, MAP for attribution, billing for revenue, spreadsheets to stitch them together — each with its own export, none agreeing on the same number.
~15 min
Of a 4-hour report spent on insight
When most of your time goes to data janitorial work, the diagnosis and the recommendation barely get a look-in.
Step 4 — Share & Automate
Automate Weekly Pipeline Reports and Forecast Updates
The value RevOps creates is in diagnosing the coverage gap — not in being the human data pipeline between every team that needs a number.
Revenue Operations Manager
B2B SaaS, 200-person company
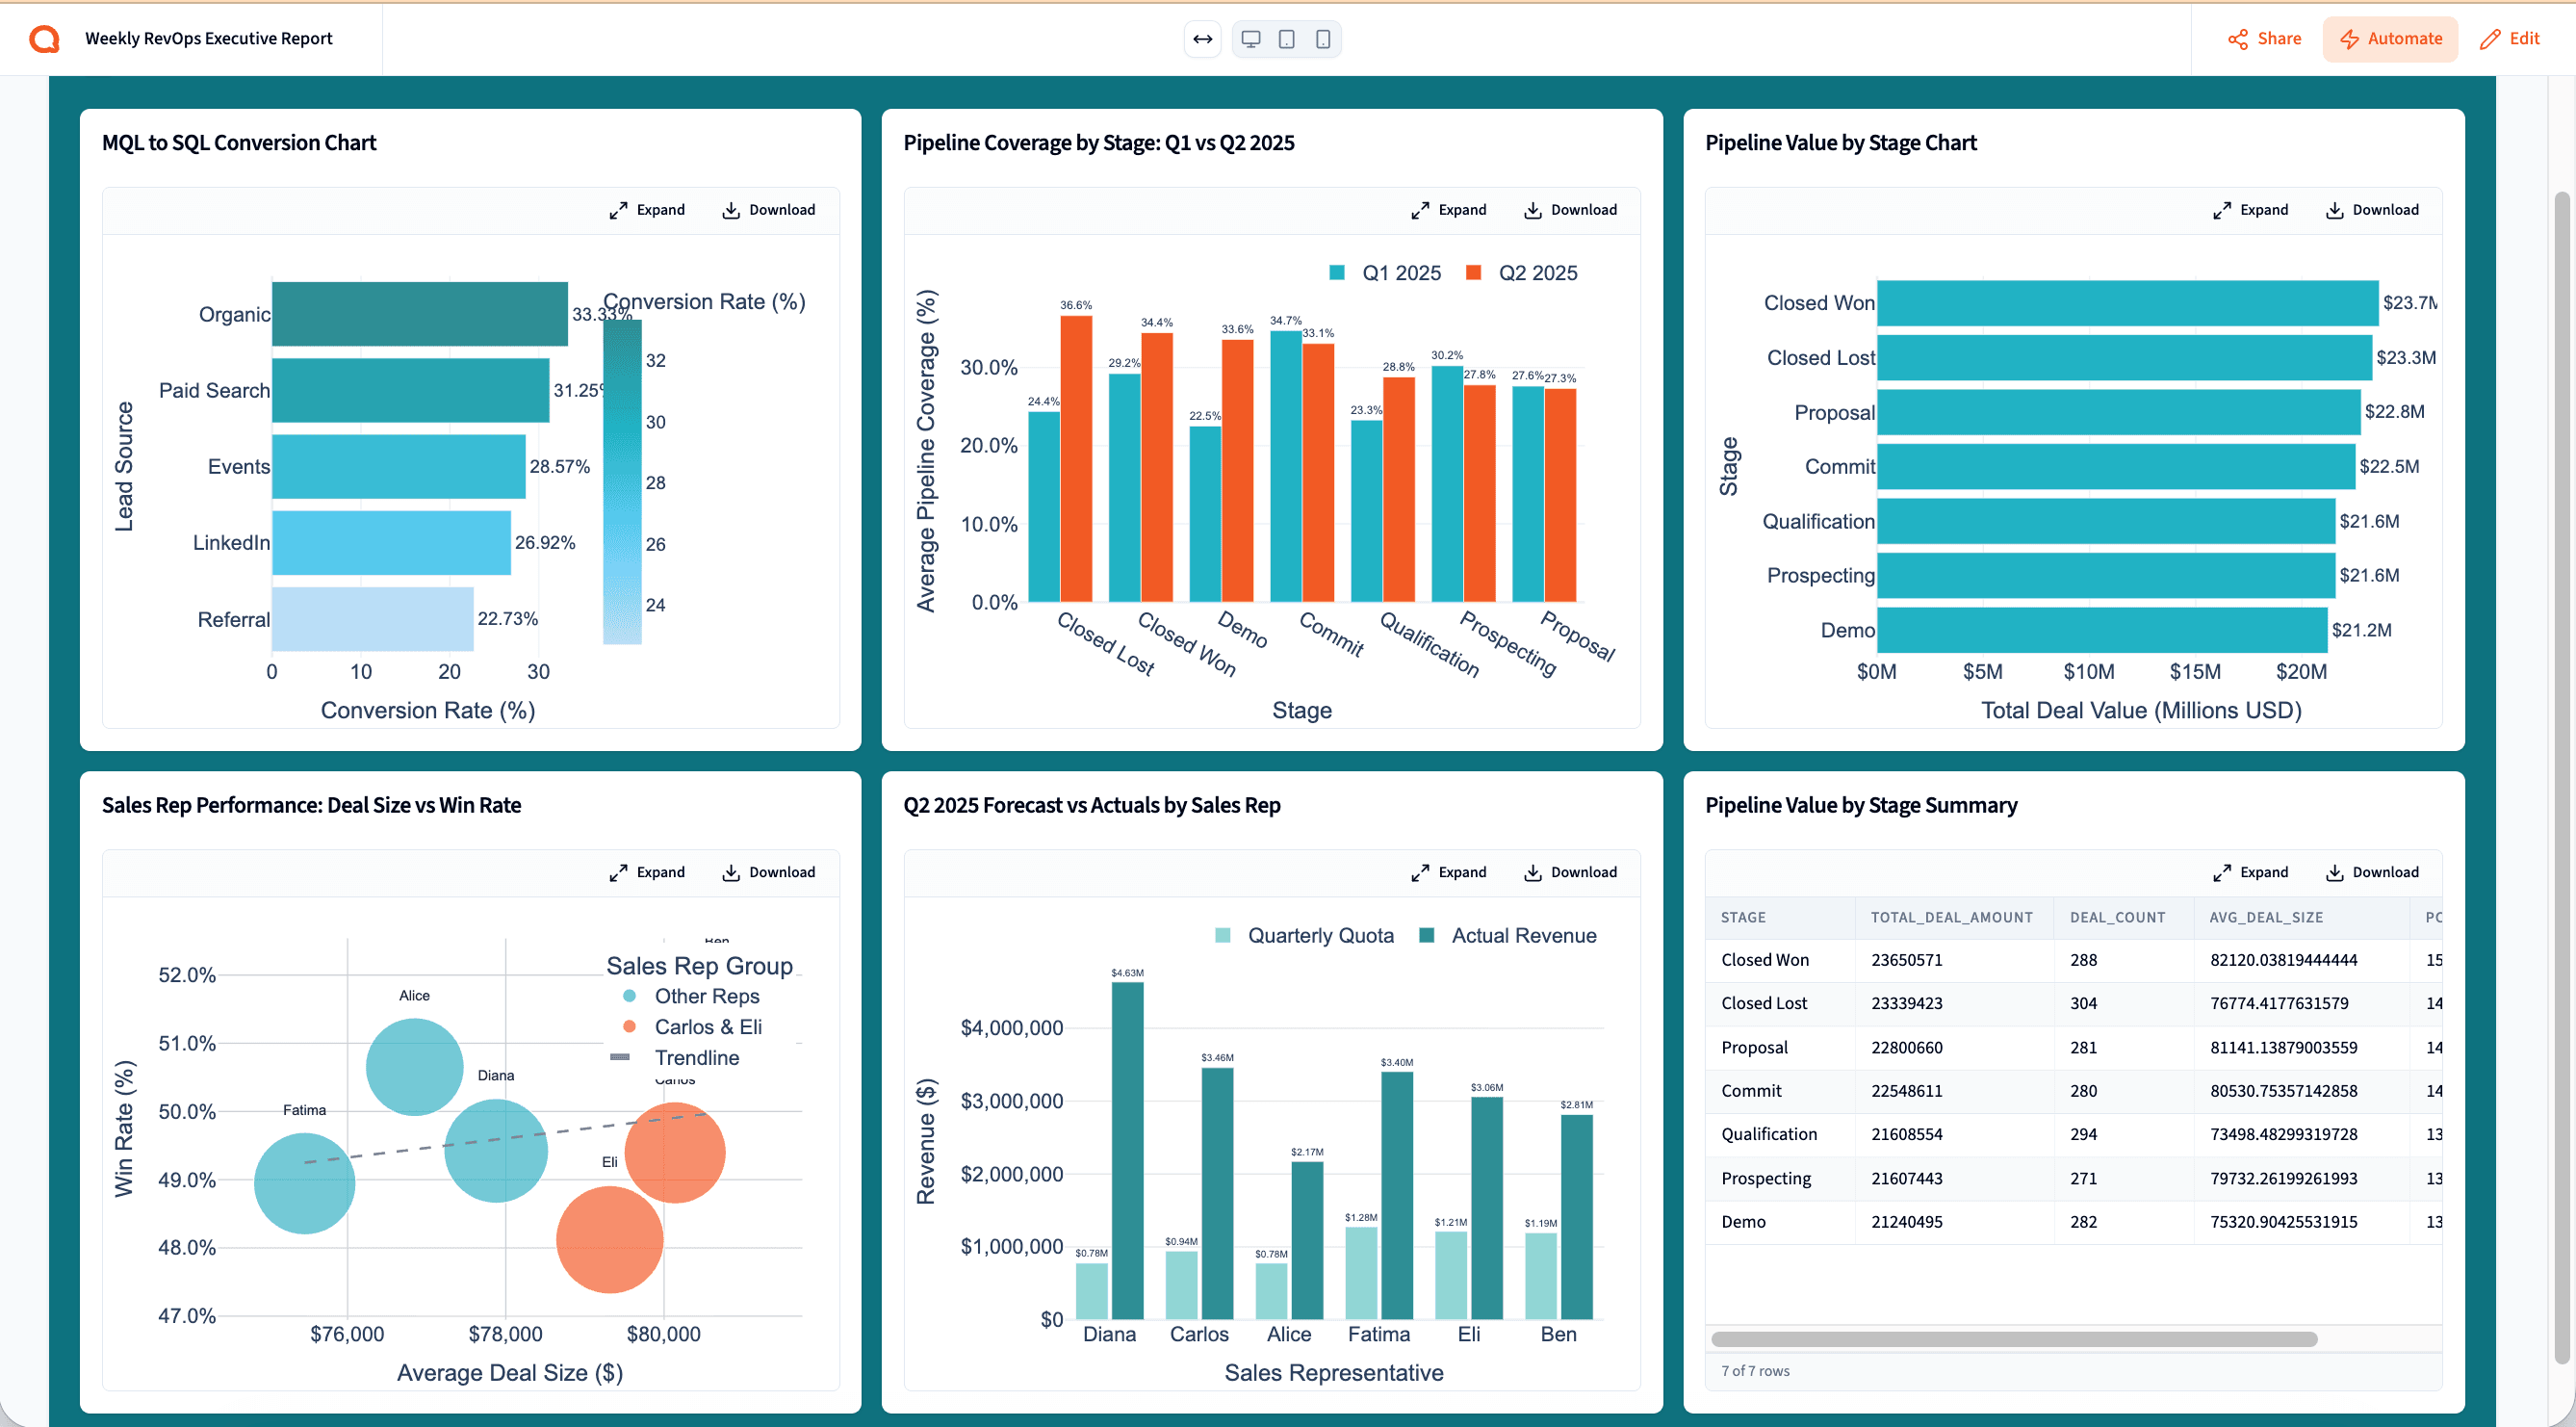
New — Querri Wrapped
You ran the analysis.
Querri builds the forecast deck.
The best use of RevOps time isn't formatting slides — it's knowing what the pipeline data means and what to do about it. Querri Wrapped closes the loop: once your analysis is done, Querri's agentic pipeline turns it into a complete, branded revenue presentation in seconds.
25 slide templates. Interactive Plotly charts. Fullscreen 16:9 presentation mode. Export to PowerPoint or PDF. Pipeline coverage, stage conversion, rep attainment, and narrative — all in one output ready for the forecast call.
Ready to see Querri in action for your specific RevOps workflows?
Explore our library of step-by-step RevOps playbooks — each one built around a real revenue operations job-to-be-done.
Why Querri
Built differently — so RevOps can actually use it.
It joins the data your other tools won't.
CRM + MAP + billing + database in one project — automatic. No more spreadsheet stitching between systems that refuse to talk to each other.
Every analysis is transparent and defensible.
Step-by-step logic you can inspect before you put it in front of the CRO. No black box, no numbers you can't explain.
Self-serve, without the wait.
Ask revenue questions in plain English, get answers in minutes — not a two-week BI ticket. Pipeline coverage, funnel conversion, attribution, all from the same project.
The complete revenue analytics workflow. One platform. Any RevOps manager can run it.
Try it freeSecurity & Privacy
Your revenue data stays yours.
Revenue data is among the most sensitive data in the organization. Querri is built for teams that can't afford a data security incident — enterprise-grade protection, full auditability, and a strict zero-training policy from day one.
SOC 2 Type II Certified
Independently audited →
Encryption in transit and at rest →
All revenue data is encrypted end-to-end. Tenant isolation, RBAC, SSO/MFA, and full audit logging are included at every tier.
Transparent, step-by-step analysis — not a black box →
Every step Querri takes is visible and reviewable. See exactly how a pipeline number was calculated and validate the answer before you share it with the CRO.
Zero data training policy →
Your revenue data is never used to train AI models. Customer data is isolated per tenant and never shared or commingled across accounts.
Why Revenue Operations Teams Choose Querri
Simple ways to do hard things
Talk to your data through a chat interface and watch it transform in a spreadsheet view.
Reliable, repeatable data workflows
Clean, merge, and analyze once. Then set up your data workflows to run on your schedule.
Designed for humans, not machines
It’s not a black box. See an explanation of the data workflows behind every Querri.
Frequently Asked Questions
Why does our pipeline data feel so hard to trust?
Which data sources does Querri connect to for RevOps?
How is Querri different from Tableau, Looker, or Power BI?
Can Querri join CRM, marketing attribution, and billing data in one place?
How long does it take to build a weekly pipeline report?
Can RevOps teams without SQL skills actually use this?
Is Querri secure enough for revenue data?
How does Querri handle the Salesforce and HubSpot export mess?
What is revenue operations analytics and why does it matter?
Your revenue data has the answers. Querri helps you get to them before the forecast call.
Connect your revenue data stack, run your first pipeline analysis, and see what your CRM has been trying to tell you.