Querri for Customer Segmentation Know your best customers, to target better and grow faster.
Querri helps you uncover your most valuable customer groups automatically using smart segmentation. Whether you want to compare customer types by revenue, behavior, region, or advanced clustering, Querri makes it fast and easy to find the patterns hiding in your data.
See Customer Segmentation in Action
Watch how Querri automatically discovers customer segments and helps you understand your most valuable customers
Why It's So Hard to Know Which Customers Actually Matter
Most businesses are sitting on piles of customer data, but don't know how to use it to answer basic questions like:
"Who's loyal?"
"Who's likely to churn?"
"Which customers bring the most value?"
Spreadsheets make it hard to compare patterns.
BI dashboards can't discover segments on their own.
And advanced methods like clustering usually require specialists.
That means you're stuck guessing instead of knowing, and missing chances to personalize marketing, improve service, or grow key relationships.


How Querri Simplifies Segmentation
With Querri, just ask:
"What are the key customer segments in our data?"
"Group my customers by spending and order frequency."
"Which segments are growing fastest?"
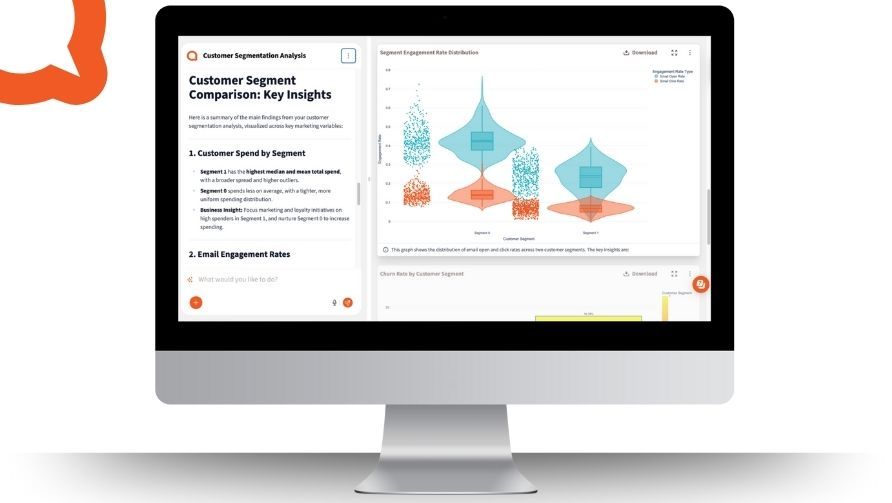
Querri will explore your data, clean it up, and automatically group your customers—using clustering (like K-means) or simple breakouts (by region, store, behavior). It can recommend how many segments make sense, label them based on traits, and give you easy ways to compare trends. Once you've got segments, ask Querri to visualize how they're performing or how they've changed over time.
What You Gain When You Finally Know Your Customers
Clear Visibility into Who Your Customers Are
Smarter Targeting for Marketing and Sales
No More Waiting for a Data Team
Actionable Insights That Improve Retention and Revenue
How-To:
1 Upload your customer data
From Excel, CSV, database, or cloud app. Include columns like Customer ID, revenue, order count, join date, location, etc.
2 (Optional) Add more context
You can upload additional data like product preferences, support ratings, or campaign responses. Querri will help you match them.
3 Clean and prep your data
Prompt: "Fix column names, remove duplicates, format dates, and fill missing values." Prompt: "Merge customer and order data using Customer ID."
4 Ask for customer segmentation
Prompt: "Find the best customer segments using revenue, recency, and frequency." Prompt: "Group customers by store and product preference."
5 Analyze the results
Prompt: "Show churn rate and revenue trend by segment." Prompt: "Describe what makes each segment different."

Best Practices:
Start simple, then go deeper
Segmenting by store or region is easy and useful. Then try asking Querri to run clustering to find more nuanced groupings.
Name your segments clearly
Whether Querri suggests names or you do it yourself, clear labels like "VIPs," "At-Risk," or "Frequent Bargain Shoppers" make it easier to act on insights.
Use at least 6–12 months of customer data
This helps capture meaningful trends and recurring behavior, like holiday buyers or loyal customers.
Track key fields: revenue, number of orders, join date, and location
These give you a good base to calculate recency, frequency, and value—standard inputs for smart segmentation.
FAQs:
I'm not sure what to segment by. Can Querri help?
What if my data is messy or incomplete?
Do I need to understand clustering algorithms?
Can I just segment by geography or store?
How do I use the segments once they're created?
Can I combine multiple files for a richer view?
Will it be easy to repeat this analysis later?
Can I combine this with marketing data or support logs?