Querri for Multi-Source Data Analysis Grow your business with strategic insights
Finance leaders, such as CFOs, Controllers, FP&A Managers, rely on many systems—accounting, CRM, ERP, spreadsheets. Querri brings these sources together, allowing leaders to quickly view risks, opportunities, and performance in a single view and dig deeper in minutes.
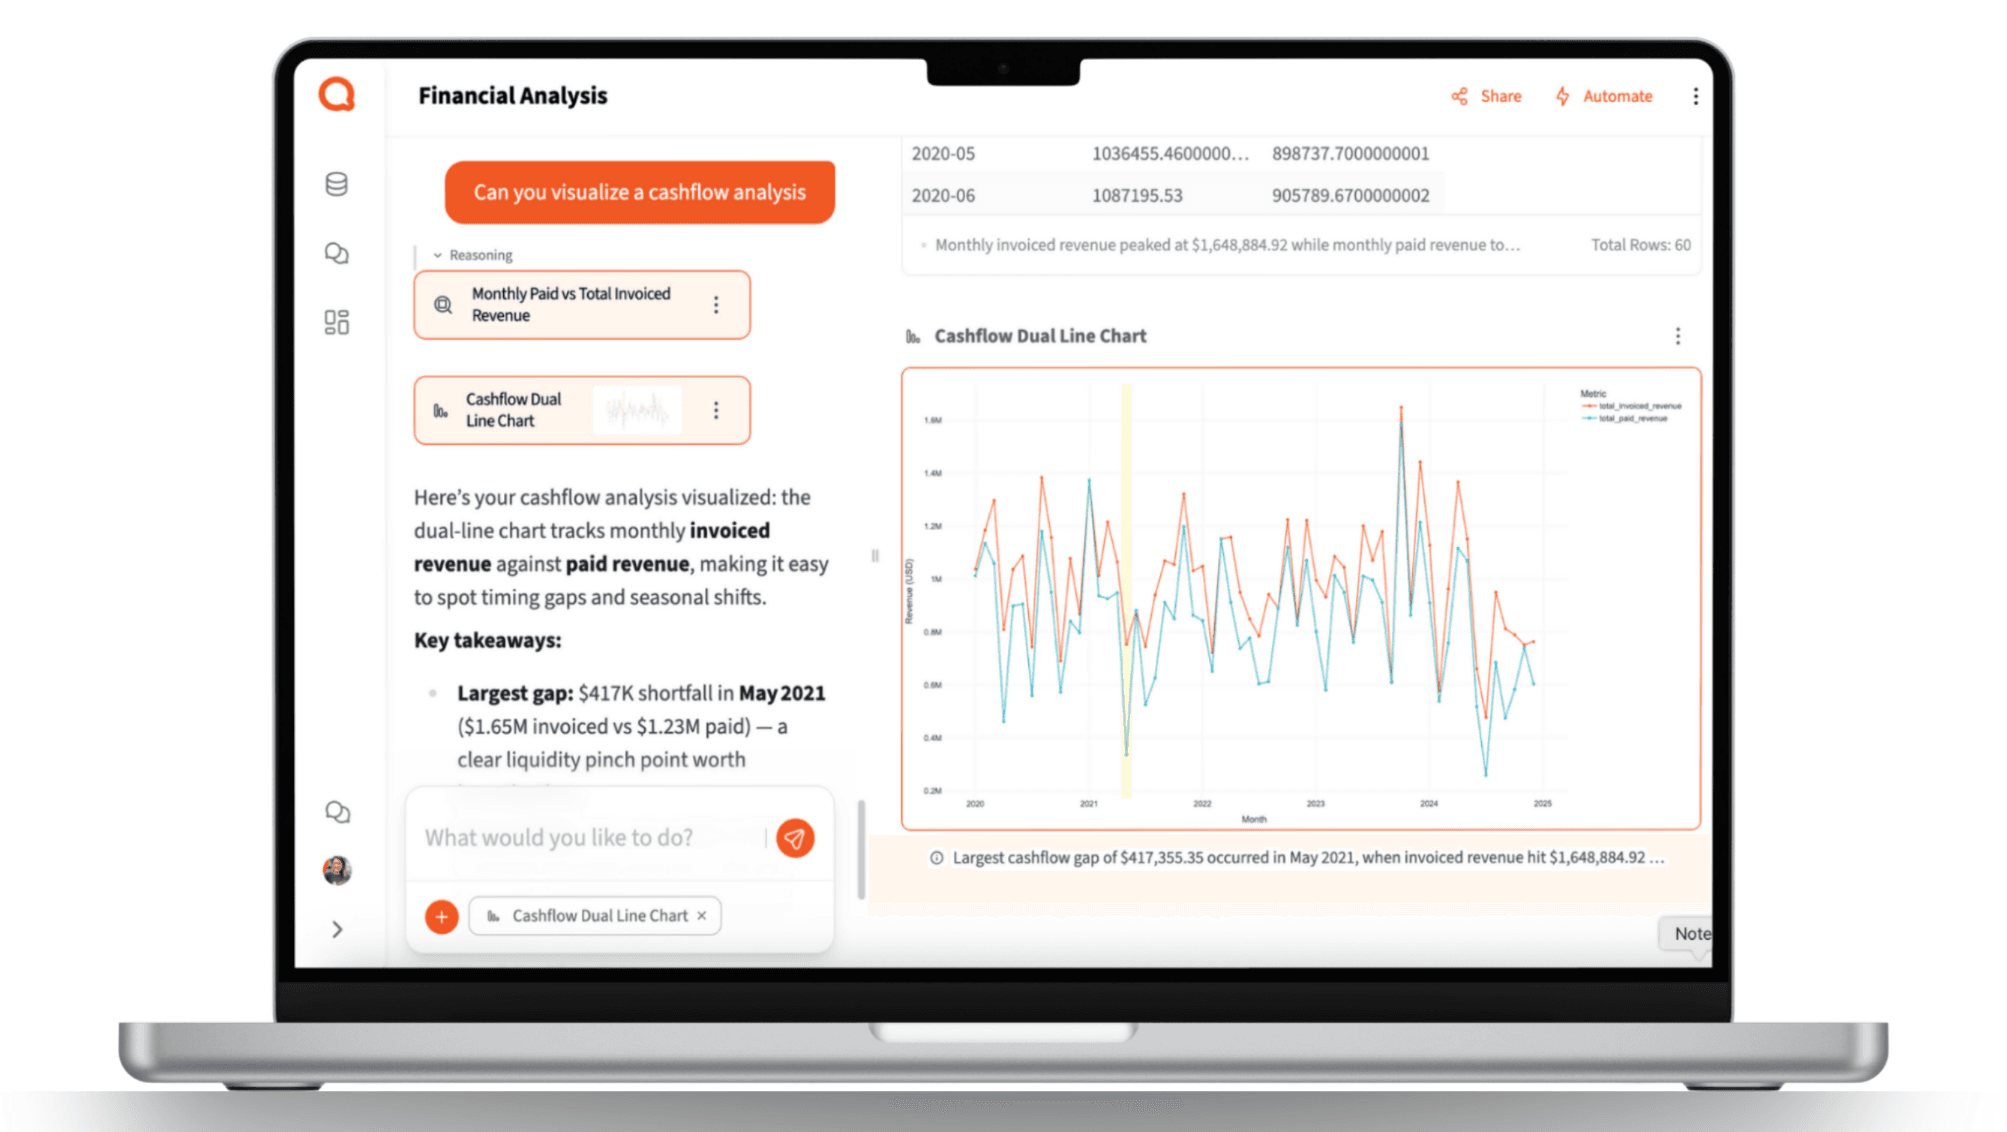
See Multi-Source Data Analysis in Action
Watch our demo to see how Querri connects accounting, CRM, and spreadsheet data for unified financial insights and faster reporting
"I spend up to 15 hours a month combining payroll and time tracking data in Excel for my most complex clients to split out the data by department and project."— Accounting Firm Owner
Why Finance Teams Spend Hours on Reports
Financial data is rarely in one place. You might track revenue in QuickBooks, pipeline in Salesforce, expenses in Excel, and budgets in a planning tool. Pulling these together takes hours of manual exports, VLOOKUPs, and pivot tables. The result? Delayed reporting, missed trends, and decisions made on partial information.

A Unified View for Smarter Financial Decisions
With Querri, you can drag and drop multiple data sources —spreadsheets, accounting exports, CRM reports— or integrate them directly and clean, join, and analyze them in minutes. Just ask:
"What's my revenue conversion rate by customer segment?"
Querri aligns columns, fixes inconsistencies, and delivers the answer with charts and tables. No complex SQL, no wasted time.
Measurable Business Gains
Unified View of Performance – Connect pipeline, revenue, and costs into a single source of truth
Faster Month-End Close – Reduce manual reconciliations and reporting delays
Deeper Insights – Spot margin leaks, cash flow risks, and growth drivers across datasets
Time Savings – Free up finance teams from data prep so they can focus on strategy
How-To in Querri
1 Upload or connect your accounting, CRM, and expense data
Excel, CSV, QuickBooks, etc.
2 Use Querri to join data by customer, invoice, or account ID
Clean up common issues (duplicate customers, inconsistent date formats, missing entries)
3 Standardize and clean your data
Prompt: "Standardize customer names and merge duplicates." Prompt: "Fix date formats and align fiscal quarters."
4 Ask your question in plain English
"Show conversion rate from pipeline to invoiced revenue by customer segment." "Compare expense growth vs. revenue growth by quarter."
5 Save the analysis as an automated dashboard
For ongoing reporting and month-end close automation.

Best Practices
Use consistent keys across systems
Whenever possible, align customer IDs or invoice numbers between CRM and accounting tools. Querri can help clean mismatches, but a shared key speeds analysis.
Track both top-line and bottom-line metrics
It's not enough to join revenue and pipeline; include costs, margins, and cash flow for a complete financial view.
Use enough history
Aim for 2–3 years of data when possible. This helps capture seasonality, growth trends, and long-term shifts.
Segment smartly
Group customers by industry, size, or region. Broad categories often reveal clearer patterns than granular account-by-account views.
Automate recurring reports
Month-end close and board reports repeat every month. Once built in Querri, automate them so finance teams don't waste hours redoing work.
FAQs
What if my systems don't share a common key (like customer ID)?
Can I include spreadsheets alongside ERP or CRM data?
What about missing or inconsistent data?
Can I track metrics like CAC, LTV, or margins?
How do I keep analyses updated?