Querri for Impactful Financial Leadership Reporting Spend your time on the story behind the numbers, not on assembling them
Querri connects the systems finance reports from, such as accounting, CRM, payroll and spreadsheets, and answers questions across them in plain language. Build the management report once, with the same definitions every month, and Querri reruns it on fresh data and sends it to leadership.
See It in a Real Project
This walkthrough comes from the Over Budget and Why playbook. It joins ERP detail, the budget, card spend and the HR roster to show which departments are over budget and what caused it.
"Due to the volume of day-to-day operational tasks, I only spend about 10% of my time on financial analysis, though I would like to spend more."— Controller
Why Finance Reports Can Fall Short
Most finance leaders work across several systems: QuickBooks or NetSuite, a CRM, payroll, time tracking and spreadsheets. Preparing the management report means hours of exporting, cleaning and stitching data together.
Even after all that work, reports often raise more questions than they answer:
- Dashboards show trends but miss the context behind them.
- Executives ask follow-up questions that take days of extra work.
- Reports cover "what happened" but rarely "why it happened" or "what comes next".
- Next month, the whole exercise starts again from the exports.
Finance teams end up preparing numbers when they should be guiding strategy. Decisions are delayed, or made on incomplete information.

Transform Data Into Strategic Guidance
With Querri, finance leaders move past static dashboards and manual pivots. Connect accounting, CRM and payroll, or upload your workbooks, and ask questions in plain English.
Querri will:
- Clean and join messy data from multiple sources.
- Point out anomalies and findings you might not have looked for.
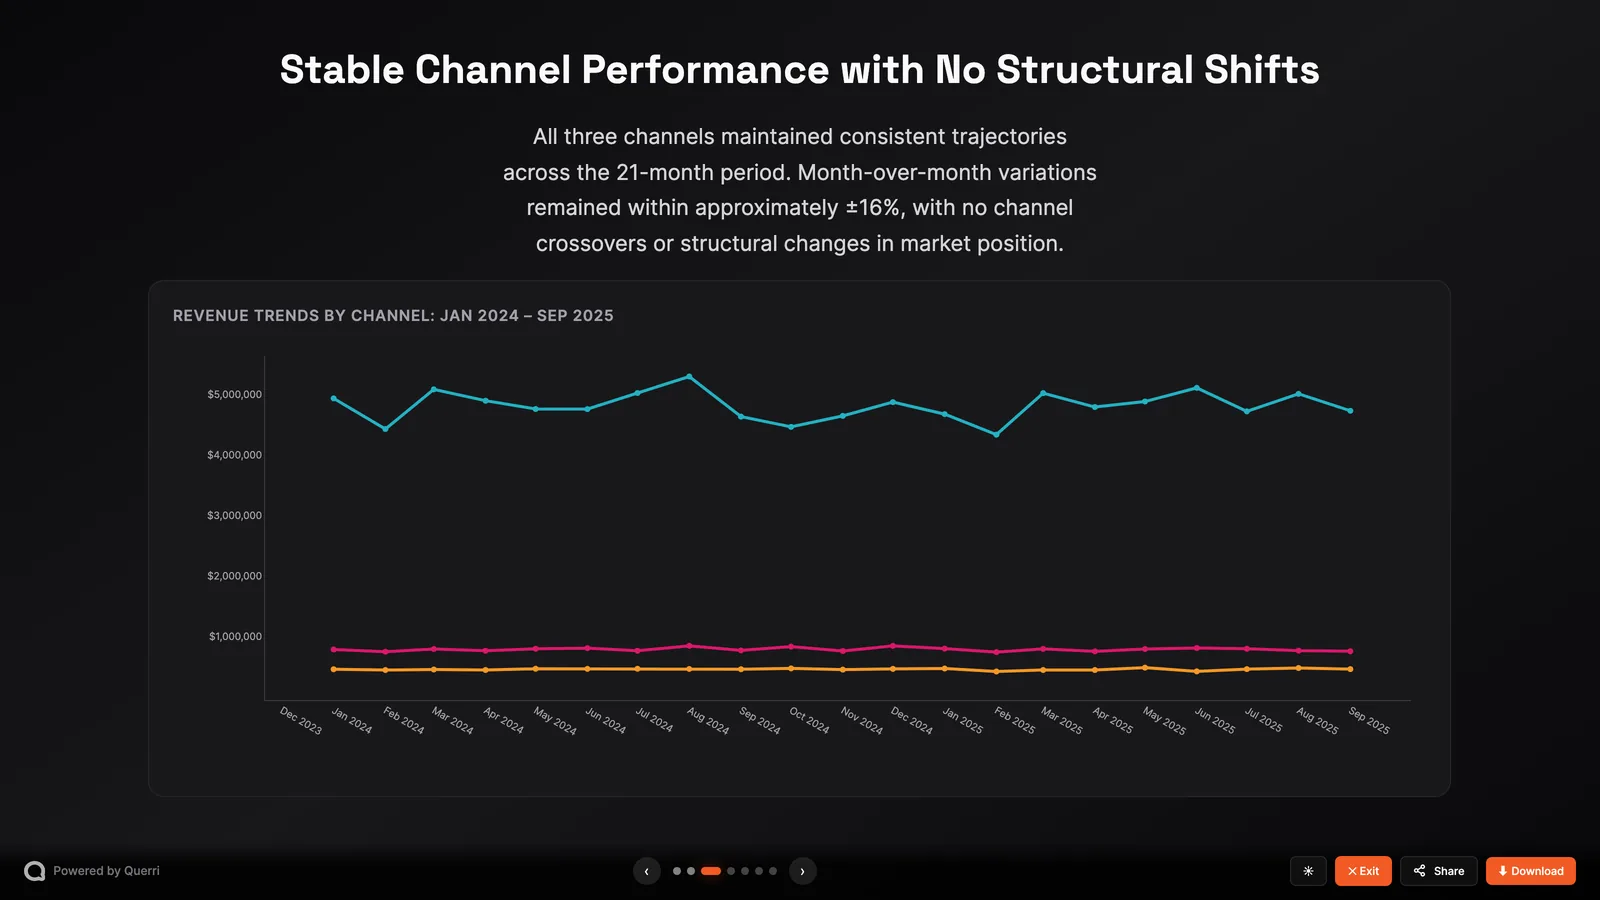
- Build charts that explain the story behind the numbers, with annotations on the events that matter.
- Forecast, so you report on likely outcomes as well as past performance.
- Show the query behind every number, so each figure holds up in the meeting.
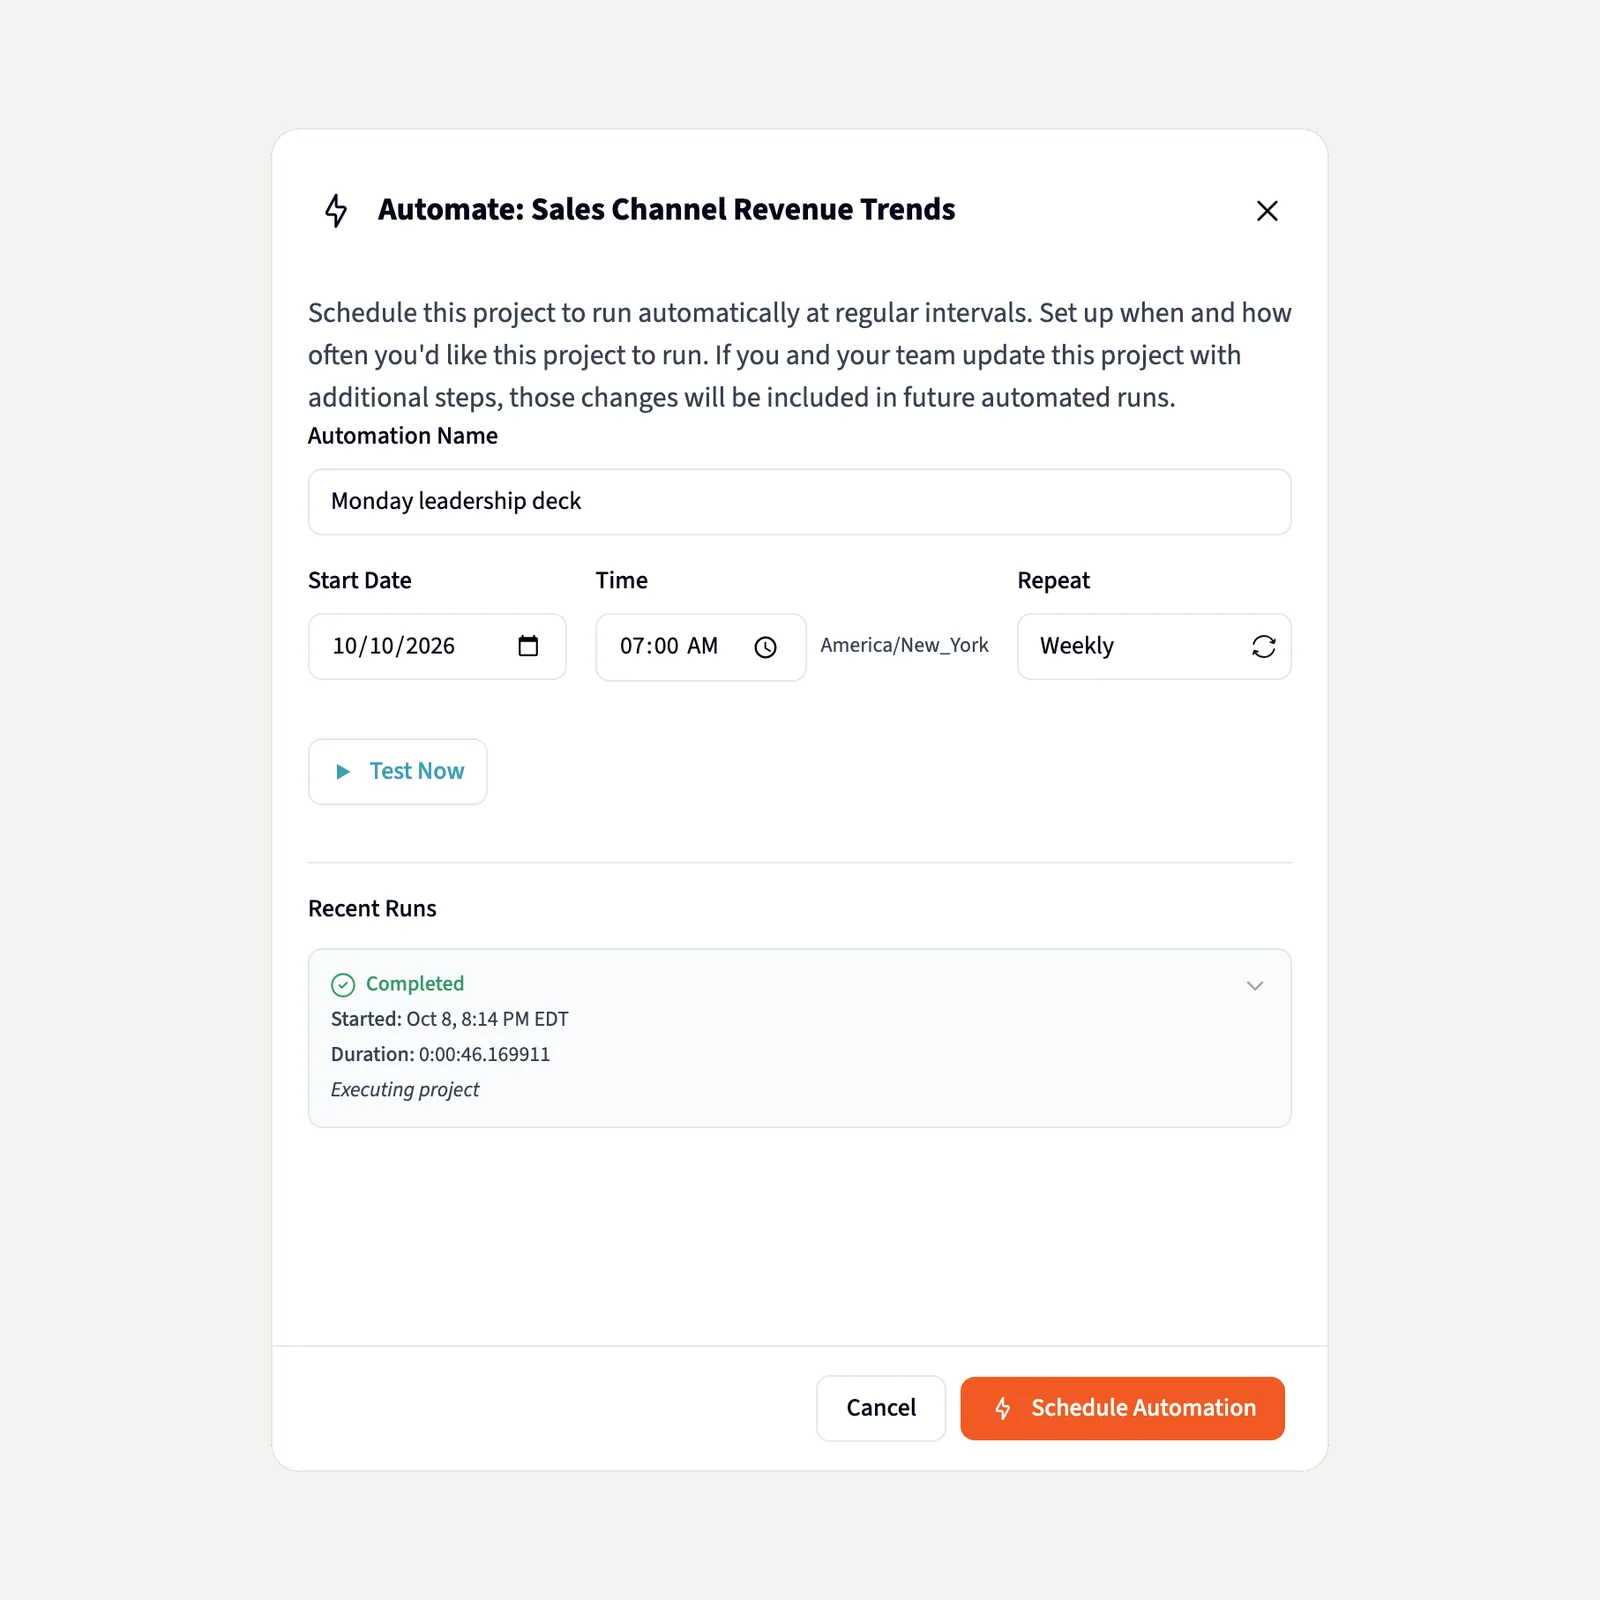
- Rerun the report on schedule and send it as an email, an Excel workbook or a branded deck.
You spend less time on Excel formulas and more on the why, and on the story your leadership team needs to hear.
Business Impact for Finance Leaders
Clarity in reporting: show the full picture, not isolated metrics
Time saved each month: hours back from data prep and manual pivots
One definition of each number, used in every report
Strategic guidance: answer "what happened", "why" and "what's next"
Reports that rebuild themselves on fresh data
Leadership confidence: every number can be traced to its source
How-To: Create Impactful Reports in Querri
1 Connect Your Data
Connect QuickBooks, NetSuite, your CRM or Google Drive, or upload Excel and CSV files. See all 125+ connectors.
2 Clean and Join Data
Prompt: "Join sales by branch from the CRM with revenue from QuickBooks. Fix date formats and remove duplicates." Querri checks every table as it arrives and asks you the judgement calls. Save the answers, such as which accounts count as revenue, under Facts and Rules, and next month's report uses them without asking.
3 Explore Anomalies and Trends
Prompt: "Show me sales by branch and highlight anomalies compared to last quarter."
4 Visualize the Story
Prompt: "Chart the revenue trend by branch. Annotate the branch closure and highlight increases elsewhere."
5 Forecast, Then Schedule It
Prompt: "Forecast cash flow for the next 3 months." When the report reads the way you want, click Automate to rerun it monthly and send it to your leadership team. Share the project with your finance workspace so the whole team works from one version.

Best Practices for Financial Reporting
Use Multiple Sources Together
A single dataset rarely tells the whole story. Joining accounting with CRM or HR data shows the context behind the numbers.
Agree Each Definition Once
Decide what "revenue", "active customer" or "headcount" means and save it under Facts and Rules. Track the headline numbers as KPIs so every report quotes the same figure.
Aim for Consistency
Make sure categories like branch, region and department are standardized. Inconsistent labels are a common reporting trap.
Be Ready for the Follow-Up Question
Leaders will always ask something the report didn't cover. With the data already connected, you can answer in the meeting instead of next week.
Tell the Story, Not Just the Numbers
Add context like branch closures, promotions or a change in strategy. That turns a table of figures into something leaders can decide from.
Report Forward, Not Just Backward
Historical numbers are the start. Forecasts and scenarios give the forward view management expects.
FAQs
What if my data is incomplete or has gaps?
Can I build reports that combine finance with other functions?
How does Querri handle anomalies?
Can I trust the numbers in front of the board?
Can I share these reports with my leadership team?
How often should I refresh my reports?
Can I get the report in Excel?
Where can I see more finance examples?

Step-by-Step Playbooks for This Job
Each playbook walks through one real report: the data to connect, the prompts to use and a recording of the result.
Which Departments Are Over Budget This Month, and Why?
Join NetSuite transaction detail, the budget workbook, Brex and the HR roster in Querri to rank departments against budget, split every variance into headcount, vendors and timing, and find the department whose misses are cancelling out.
Read playbookFinanceWhat Moved ARR This Month, and Does It Tie to Billing?
Build the monthly ARR roll-forward from Stripe in Querri, take billing corrections out of contraction, and tie billing ARR to Salesforce and NetSuite before the number goes to the board.
Read playbookRevOpsHow to Automate Your Weekly RevOps Executive Report
Replace the Monday morning CRM scramble with an automated, always-current pipeline and forecast executive report. Build it once in Querri, then deliver it on schedule every week.
Read playbookBuild the Report Once, Send It Every Month
The value of a leadership report is in the conversation it starts. These pieces take the assembly work off your plate and let the whole finance team work from the same numbers.
Connect your finance stack
Connect accounting, CRM, payroll and spreadsheets once. Querri copies the data on a schedule and only ever reads it.
Browse connectorsAgree the numbers
Describe a KPI in a sentence. Querri measures it from your data and quotes the same figure everywhere.
How KPIs workSchedule the board pack
Querri reruns the report on fresh data and sends it as an email, an Excel workbook or a branded deck.
Automated reportsControl who sees what
Give each department head the same report, filtered to their own rows.
Workspaces and access