Querri for Impact Reporting for Non-Profits Connect Outcomes to Funding, Without the Spreadsheet Overload
Querri helps nonprofits translate raw data into meaningful stories. Just ask questions in plain language, and Querri will clean, analyze, and summarize your data—so you can show funders, board members, and your community the real difference you're making.
When Outcomes Are Hard to Track, Funders Stay in the Dark
Nonprofits do a lot with limited resources but reporting on impact is often messy, manual, and inconsistent.
Data lives in separate spreadsheets and tools. Staff spend hours each month trying to tally results, fix errors, and make sense of outcomes.
It's easy to get buried in tracking outputs instead of showing real-world outcomes. This slows down funding requests, reduces clarity for stakeholders, and leaves powerful insights locked away in unused data.


How Querri Turns Your Program Data Into Clear, Compelling Impact Reports
With Querri, just upload your program, donor, and outcome data and then ask questions like:
"How many individuals served this quarter, by program?"
"What's the trend in outcomes by demographic?"
"Which funders support the highest-impact programs?"
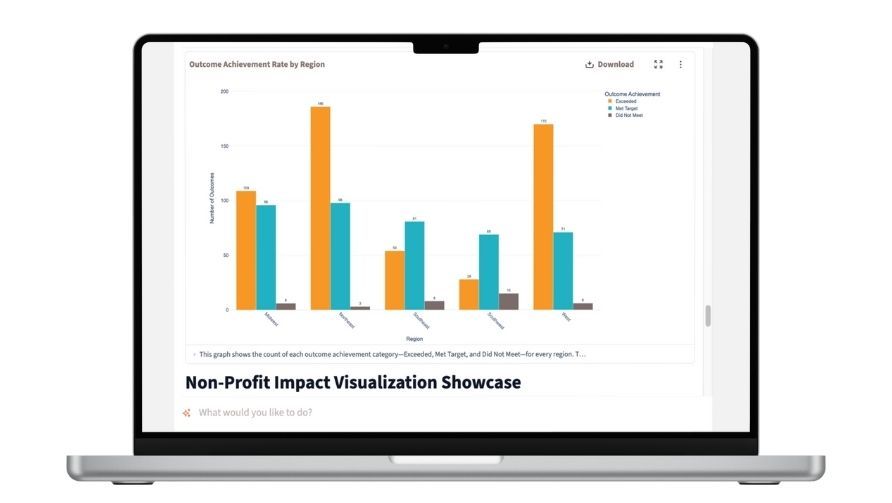
Querri automatically cleans the data, joins different datasets, and builds the charts and summaries you need.
No code. No waiting. Just answers you can use in board reports, grant proposals, and community updates.
Special Non-Profit Pricing Available
We offer discounted rates for qualified non-profit organizations. Get the tools you need to make a bigger impact while staying within your budget.
What You Gain: Clear Reports, Saved Time, and Stronger Funding Cases
Clear, Consistent Reporting
Less Manual Work
Reusable Dashboards for Recurring Reports
Easier Conversations with Funders
Faster Grant Applications
More Visibility into Real-World Impact
How-To in Five simple steps
Upload Your Data
Bring in Excel, CSV, or cloud data from your CRM, donor platform, or service tracking tools.
Combine multiple data sources
Link service delivery data with program outcomes or donor history by client ID, date, or campaign name.
Clean It Up
Use prompts like: "Remove duplicates based on email and name" "Fix inconsistent state abbreviations" "Standardize casing for names and addresses" "Flag incomplete rows with missing phone numbers"
Ask impact questions
Ask: "Show total people served by program and quarter" Ask: "Visualize impact by geography and age group"
Create a board-ready summary
Turn your results into repeatable dashboards or clean markdown that's ready for reports and slides.

Best Practices
Track Outputs and Outcomes
Record what you did (outputs like meals served) and what changed as a result (outcomes like job placements). Funders care about both.
Use Timestamps and Unique IDs
Dates and consistent IDs (like client or program ID) make it possible to track progress over time and link data across systems.
Keep Data Fresh
Update your datasets monthly or quarterly to avoid stale reports and keep funders confident in your numbers.
Group by Meaningful Segments
Break down results by program, region, or population served to surface trends, gaps, and equity insights.
Automate What You Repeat
Save time and avoid rework by turning your most common reports into dashboards that update with new data.

FAQs
What if my data is incomplete or messy?
Can I report across multiple programs or years?
How do I handle qualitative data like testimonials?
Will Querri help with grant-specific metrics?
Can I export charts and summaries?
