Querri for Visual Storytelling Transform reports into context-rich, exploratory stories that show what happened and reveal why it matters
Querri helps finance leaders cut through scattered systems and messy spreadsheets to deliver reports that tell the full story—fast, accurate, and impactful.
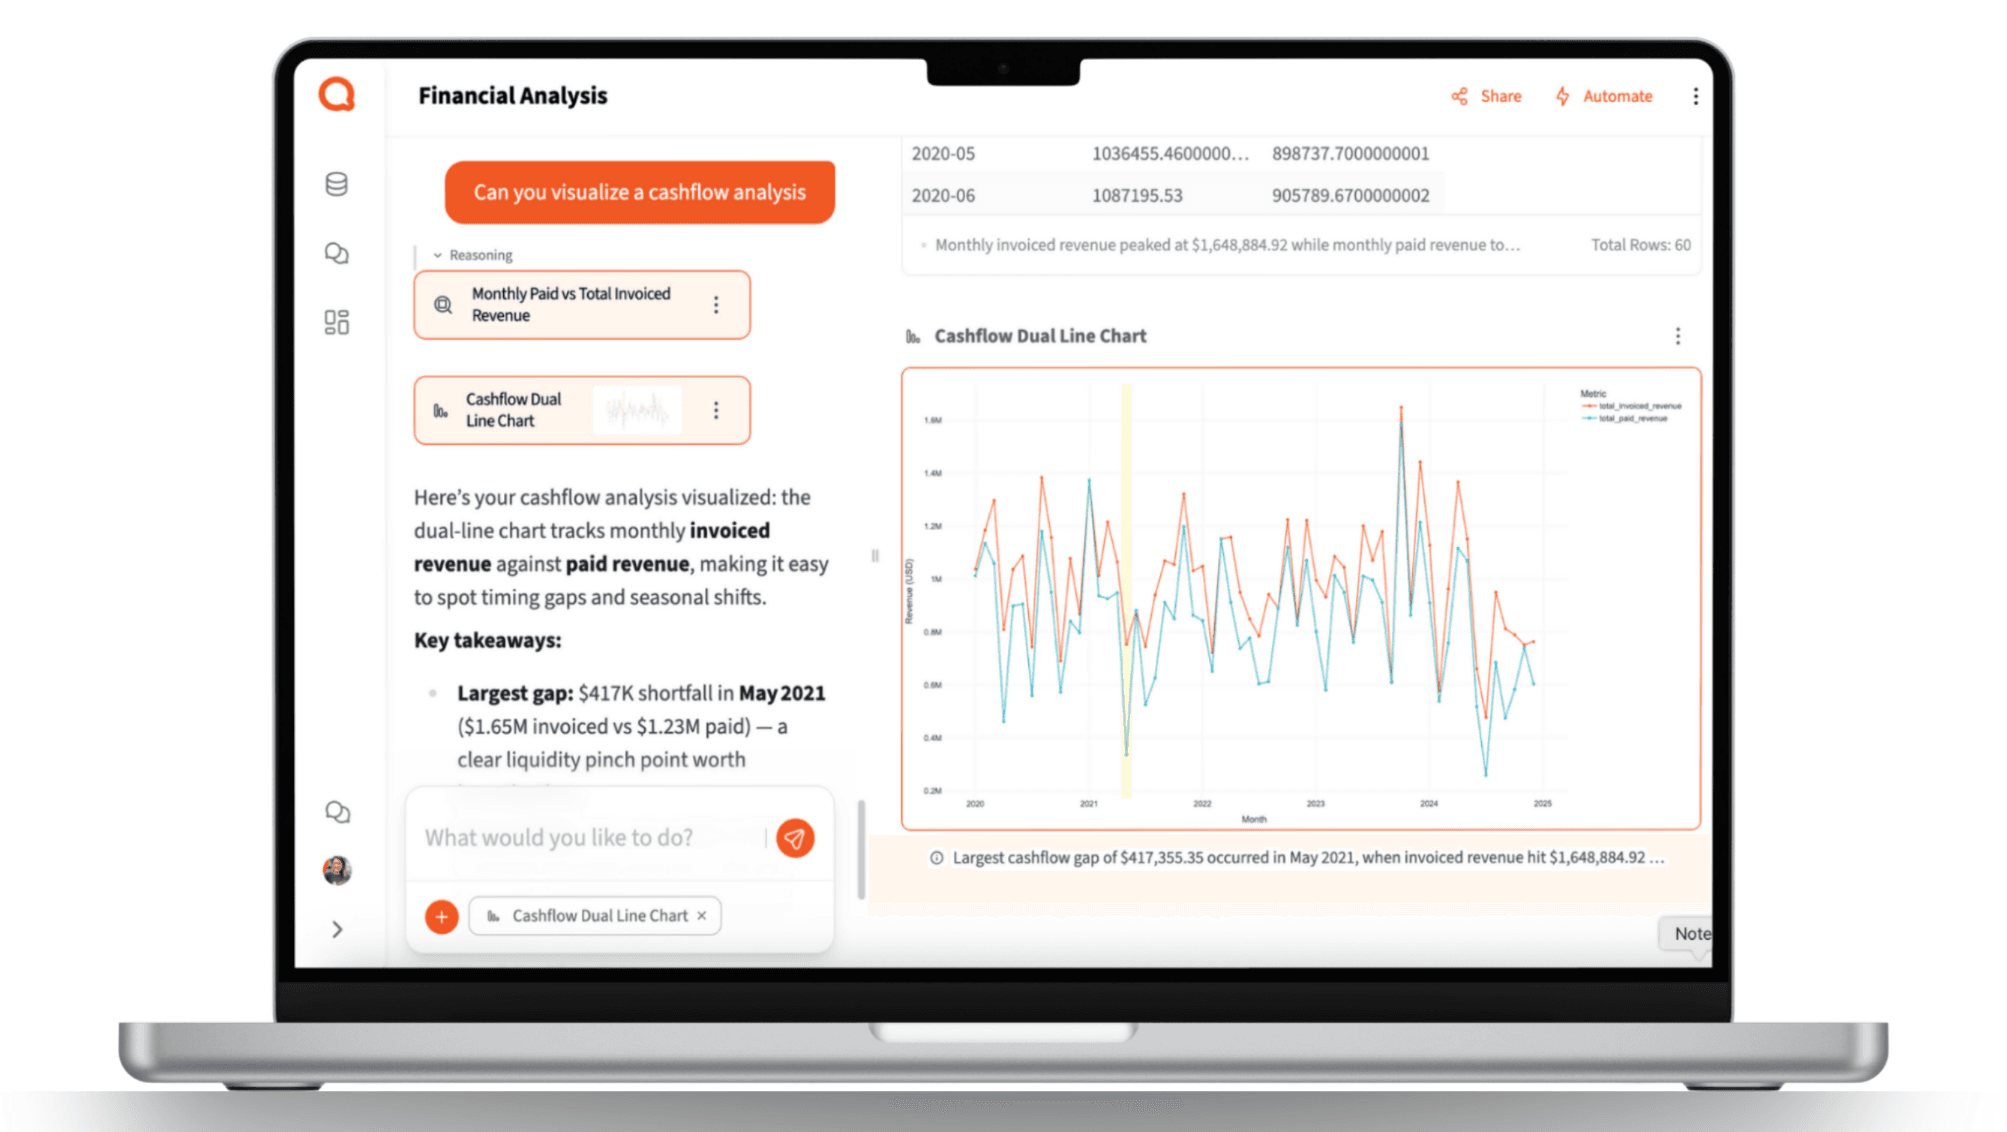
See Impactful Financial Reporting in Action
Watch our demo to see how Querri allows you to dig deeper into the multiple related data sets to create impactful leadership reports.
"Due to the volume of day-to-day operational tasks, I only spend about 10% of my time on financial analysis, though I would like to spend more."— Controller
Why Finance Reports Can Fall Short
Most finance leaders juggle multiple systems—QuickBooks, CRM, ERP, time-tracking, spreadsheets. To prepare management reports, they spend hours exporting, cleaning, and stitching data together.
Even after all that work, reports often raise more questions than answers:
- Dashboards show trends but miss the context behind them.
- Executives ask follow-up questions that require days of extra work.
- Reports focus on "what happened" but rarely explain "why it happened" or "what comes next."
The result: Finance teams waste hours preparing numbers instead of guiding strategy. Critical decisions may be delayed—or worse, made on incomplete information.

Transform Data Into Strategic Guidance
With Querri, finance leaders move past static dashboards and manual pivots. You simply upload your data—or connect systems like accounting, CRM, and payroll—and ask questions in plain English.
Querri will:
- Clean and join messy data from multiple sources.
- Spot anomalies and highlight insights you might not have looked for.
- Generate charts that tell the story behind the numbers, not just the numbers.
- Allow you to create dozens of graphs to help you find the one that tells the story best.
- Create annotations, per your request, on graphs you choose to focus on to highlight key findings for leadership.
- Forecast so you can report on likely outcomes, not just past performance.
Instead of spending a lot of time with Excel formulas, you can dig deeper into the why and focus on telling the story your leadership team needs to hear to lead the company into the right direction.
Business Impact for Finance Leaders
Clarity in Reporting – Show the full picture, not just isolated metrics
Time Saved Each Month – Hours back from data prep and manual pivots
Strategic Guidance – Answer not only "what happened" but also "why" and "what's next"
Leadership Confidence – Deliver reports that help executives make better, faster decisions
How-To: Create Impactful Reports in Querri
1 Connect Your Data
Upload Excel/CSV files or integrate with QuickBooks, Google Drive, Dropbox, etc.
2 Clean and Join Data
Prompt: "Join sales by branch from CRM with revenue from QuickBooks. Fix date formats and remove duplicates."
3 Explore Anomalies and Trends
Prompt: "Show me sales by branch and highlight anomalies compared to last quarter."
4 Visualize the Story
Prompt: "Graph revenue trend by branch. Annotate the branch closure and highlight increases elsewhere."
5 Forecast the Future
Prompt: "Forecast cash flow for the next 3 months with and without seasonal adjustments."

Best Practices for Financial Reporting
Use Multiple Sources Together
A single dataset rarely tells the whole story. Combining accounting with CRM or HR data uncovers the context behind the numbers.
Aim for Consistency
Make sure categories like "branch," "region," or "department" are standardized. Inconsistent labels are a common reporting trap.
Go Beyond Static Dashboards
Dashboards are helpful, but Querri allows dynamic Q&A. Leaders will always ask new questions—prepare to answer them live.
Tell the Story, Not Just the Numbers
Add context like branch closures, promotions, or shifts in strategy. This turns a report from a table of figures into a decision-making tool.
Report Forward, Not Just Backward
Historical numbers are just the start. Forecasts and scenario analysis provide the forward-looking view management expects.
FAQs
What if my data is incomplete or has gaps?
Can I build reports that combine finance with other functions?
How does Querri handle anomalies?
Can I share these reports with my leadership team?
How often should I refresh my reports?