QUERRI FOR MARKETING
Marketing Analytics Built for Marketers
What marketers use Querri for
Every workflow. One platform.
From campaign performance to revenue metrics — every analysis your team runs, in one place.
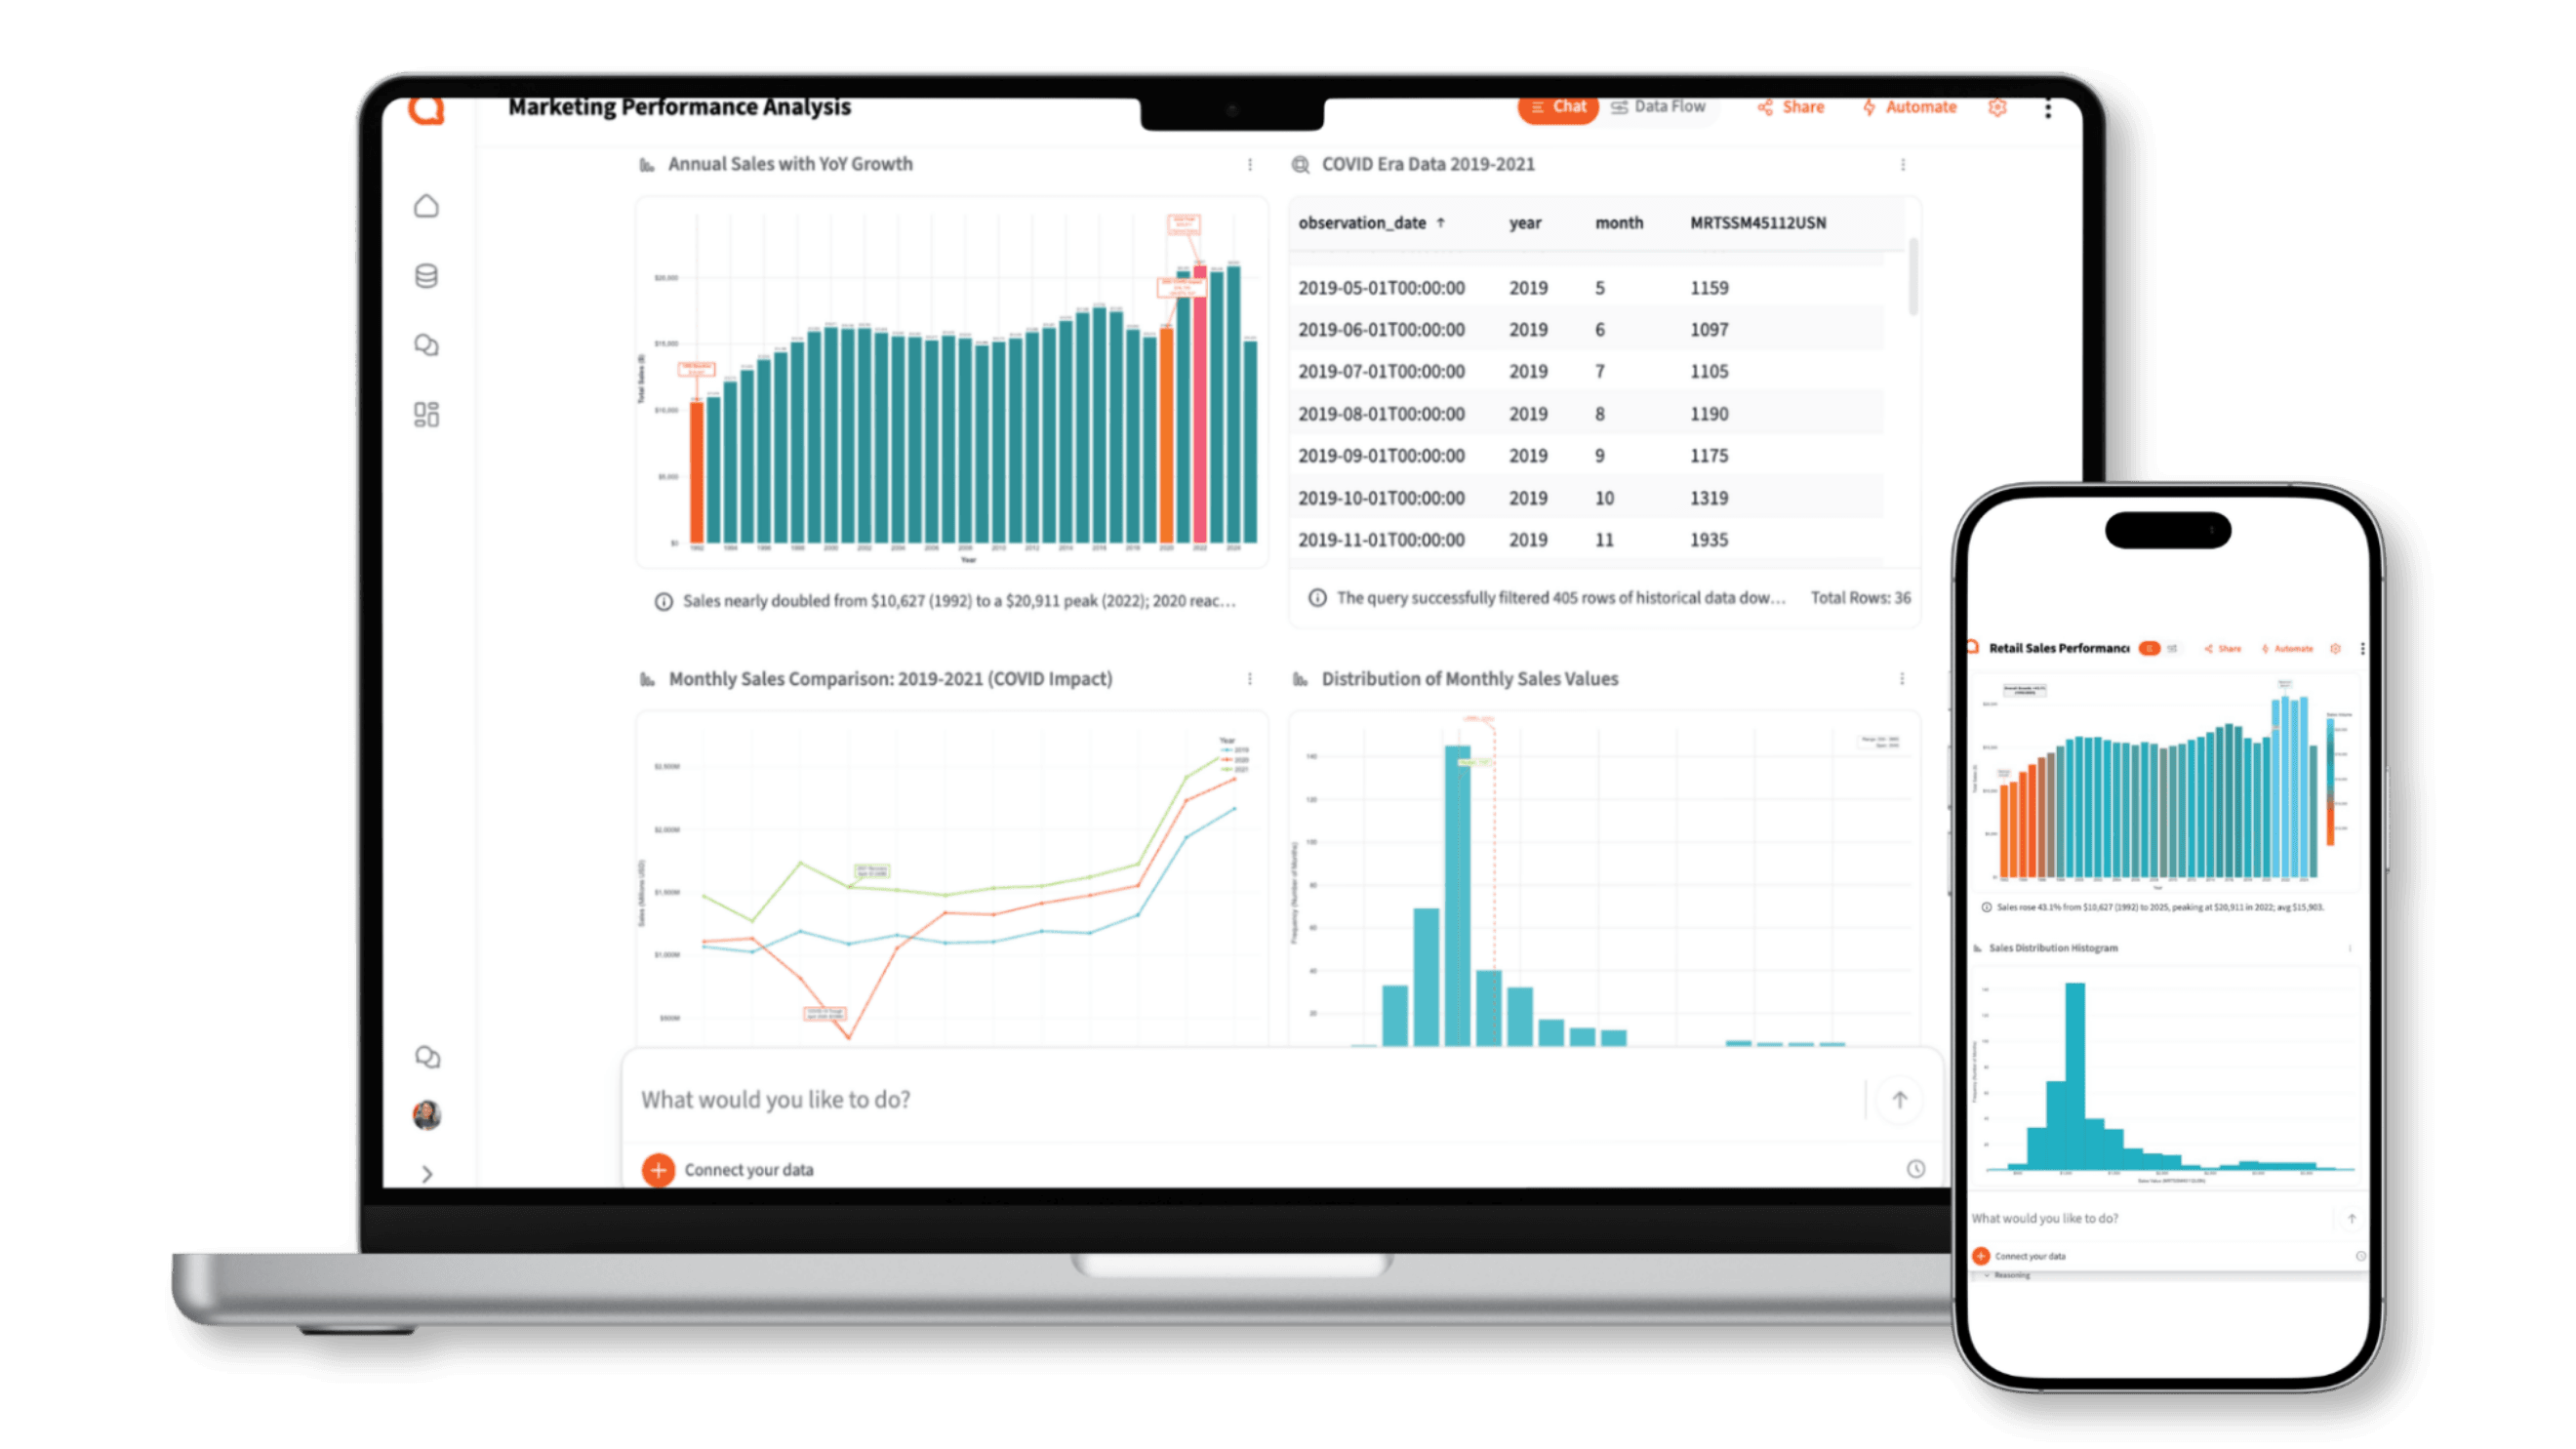
Campaign Performance Analysis
Stop piecing together performance data from five different platforms. Querri pulls it together and tells you what's working, what isn't, and where to reallocate budget.
Try asking
How it works
How Querri Works for Marketers
Step 1 — Connect
Connect Your Entire Marketing Stack
Step 2 — Clean
Clean the Mess That's Been Hiding Your True Performance
How it works
From messy exports to polished presentation in four steps
Any marketer can run this workflow. No SQL, no data engineering, no waiting in a queue.
Connect
Upload CSVs from any ad platform or connect to HubSpot, BigQuery, Salesforce, and Google Drive with a native integration.
Clean
Querri automatically normalizes headers, removes duplicates, fixes date formats, and resolves mismatches across sources.
Analyze
Ask your question in plain English. Querri runs multi-step analysis — CAC, ROAS, funnel drop-offs, WoW comparisons — and shows its reasoning.
Share
Export to Excel, PowerPoint, or PDF. Build a live dashboard. Or schedule the whole workflow to run automatically every week.
See each step in action with our playbooks
Step-by-step walkthroughs for real marketing workflows — from connecting your first ad platform export to building an automated weekly performance report.
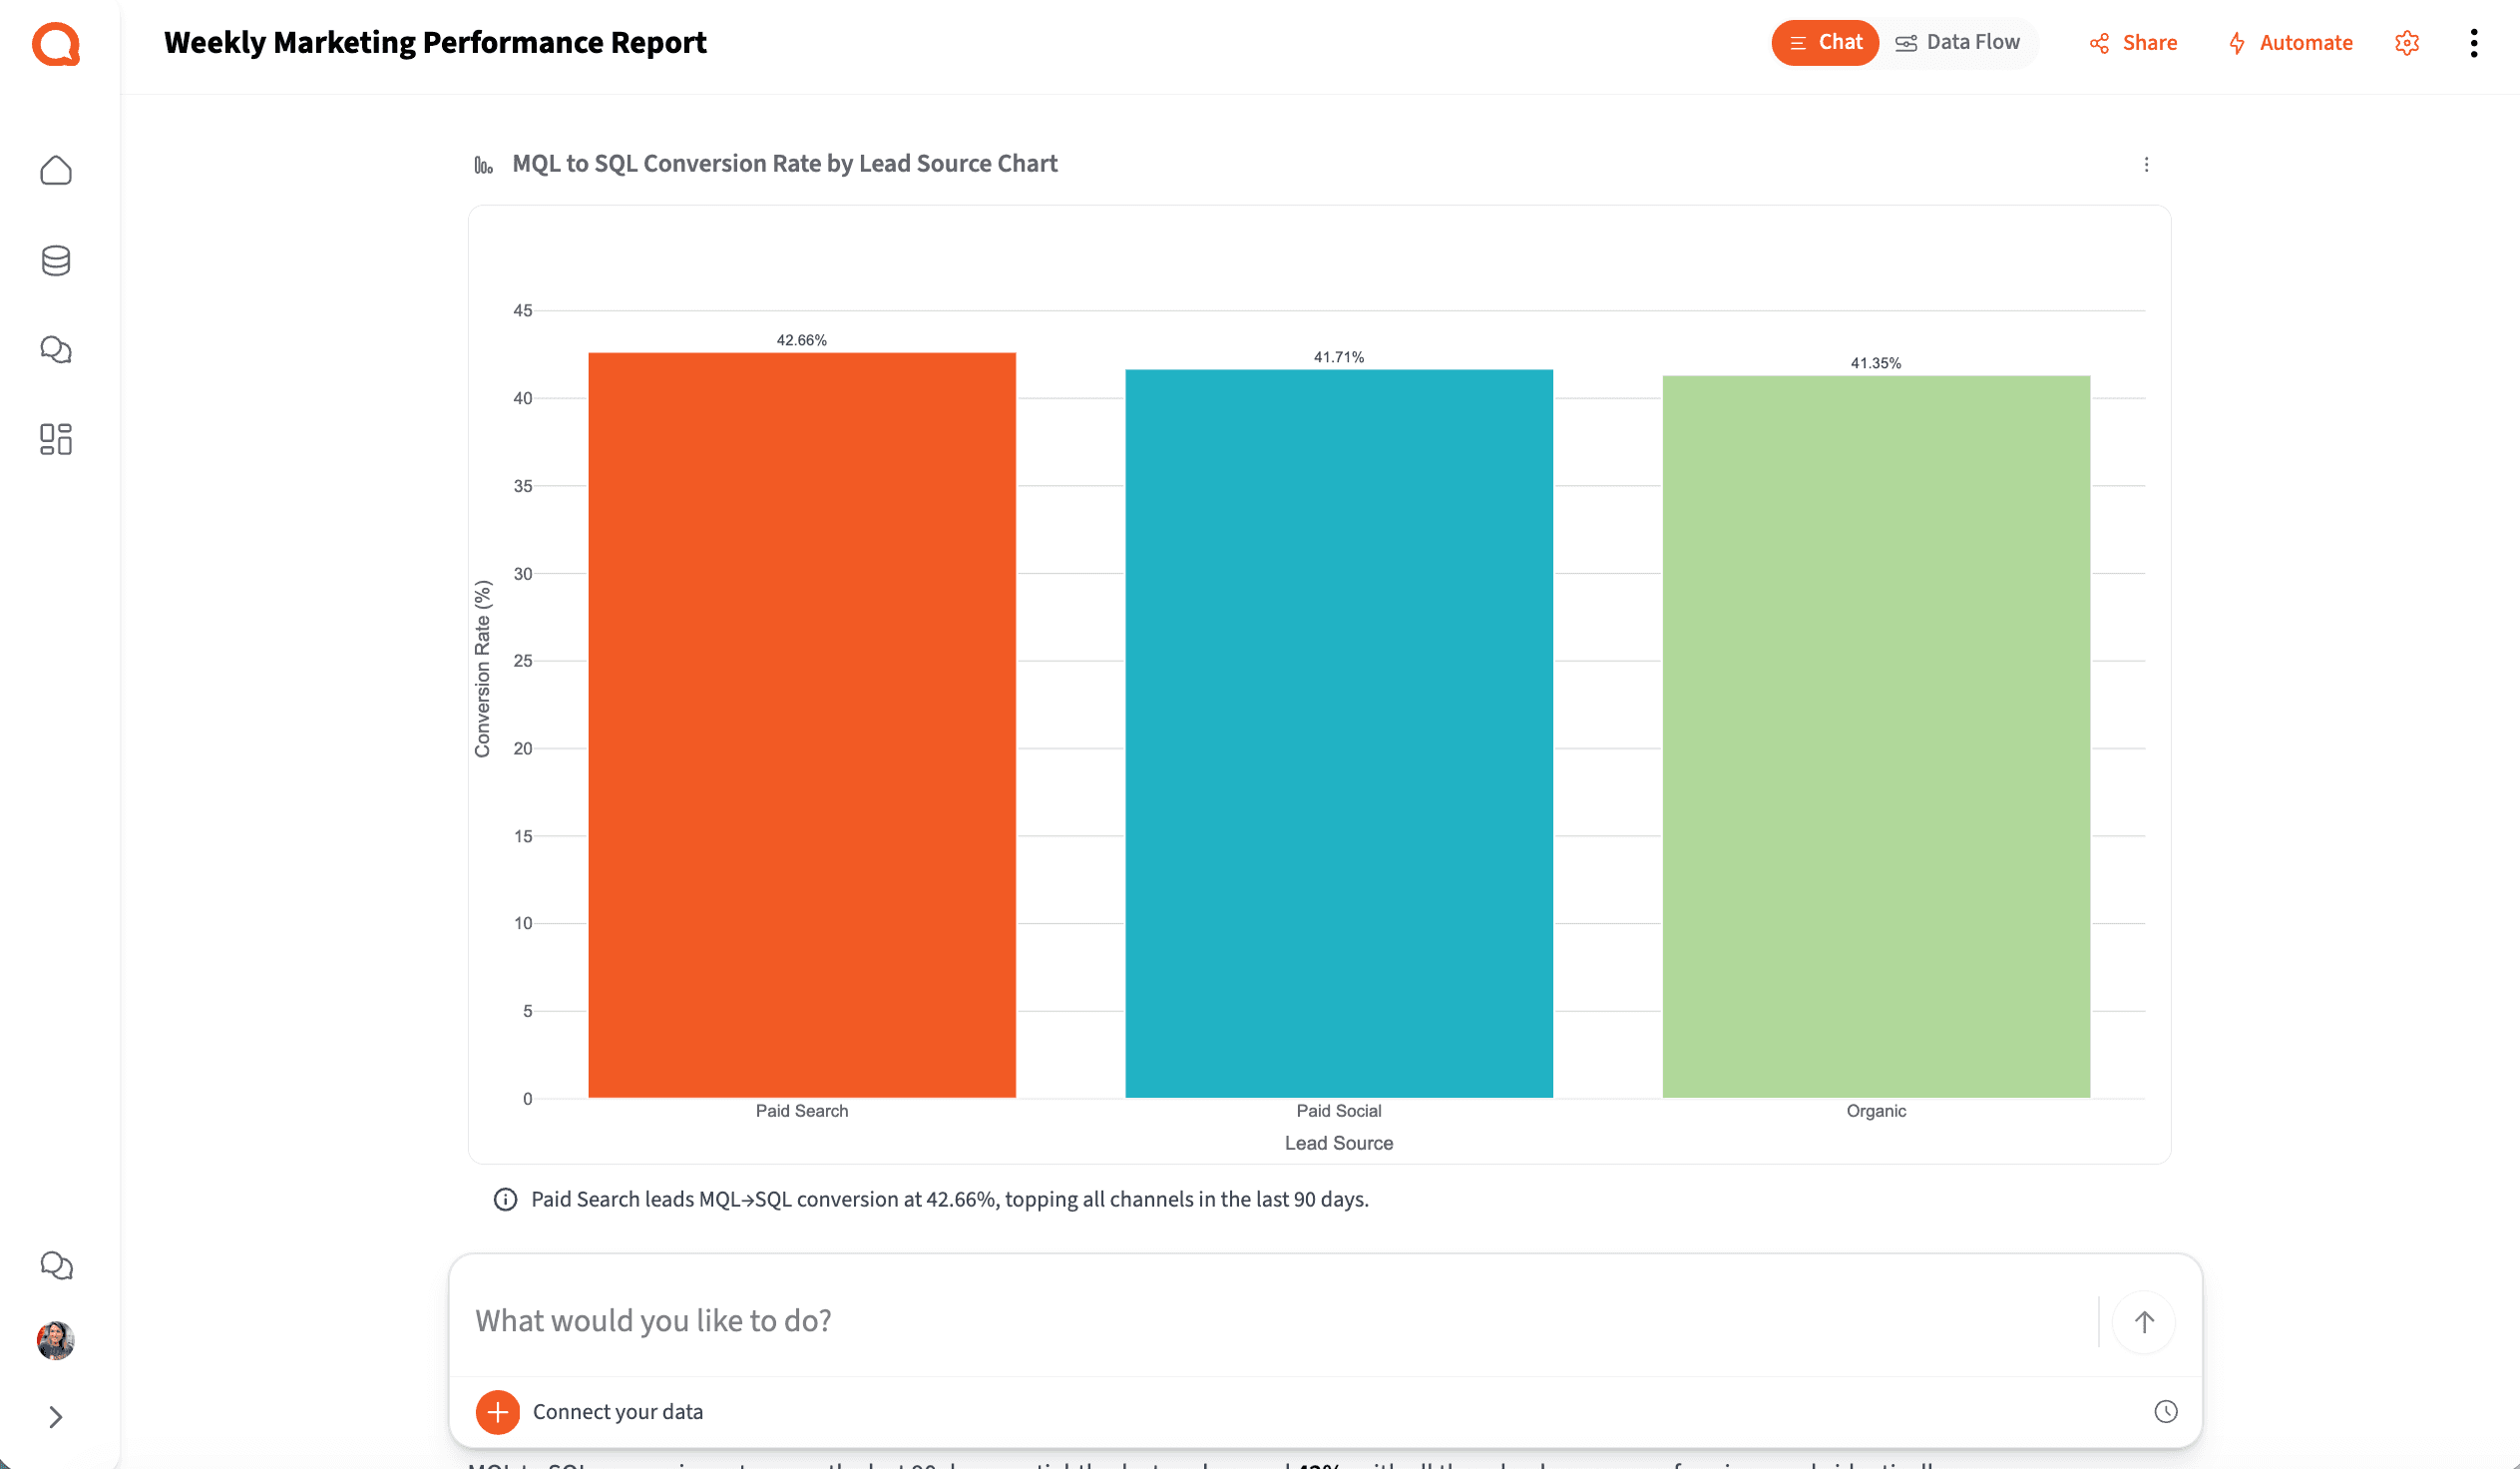
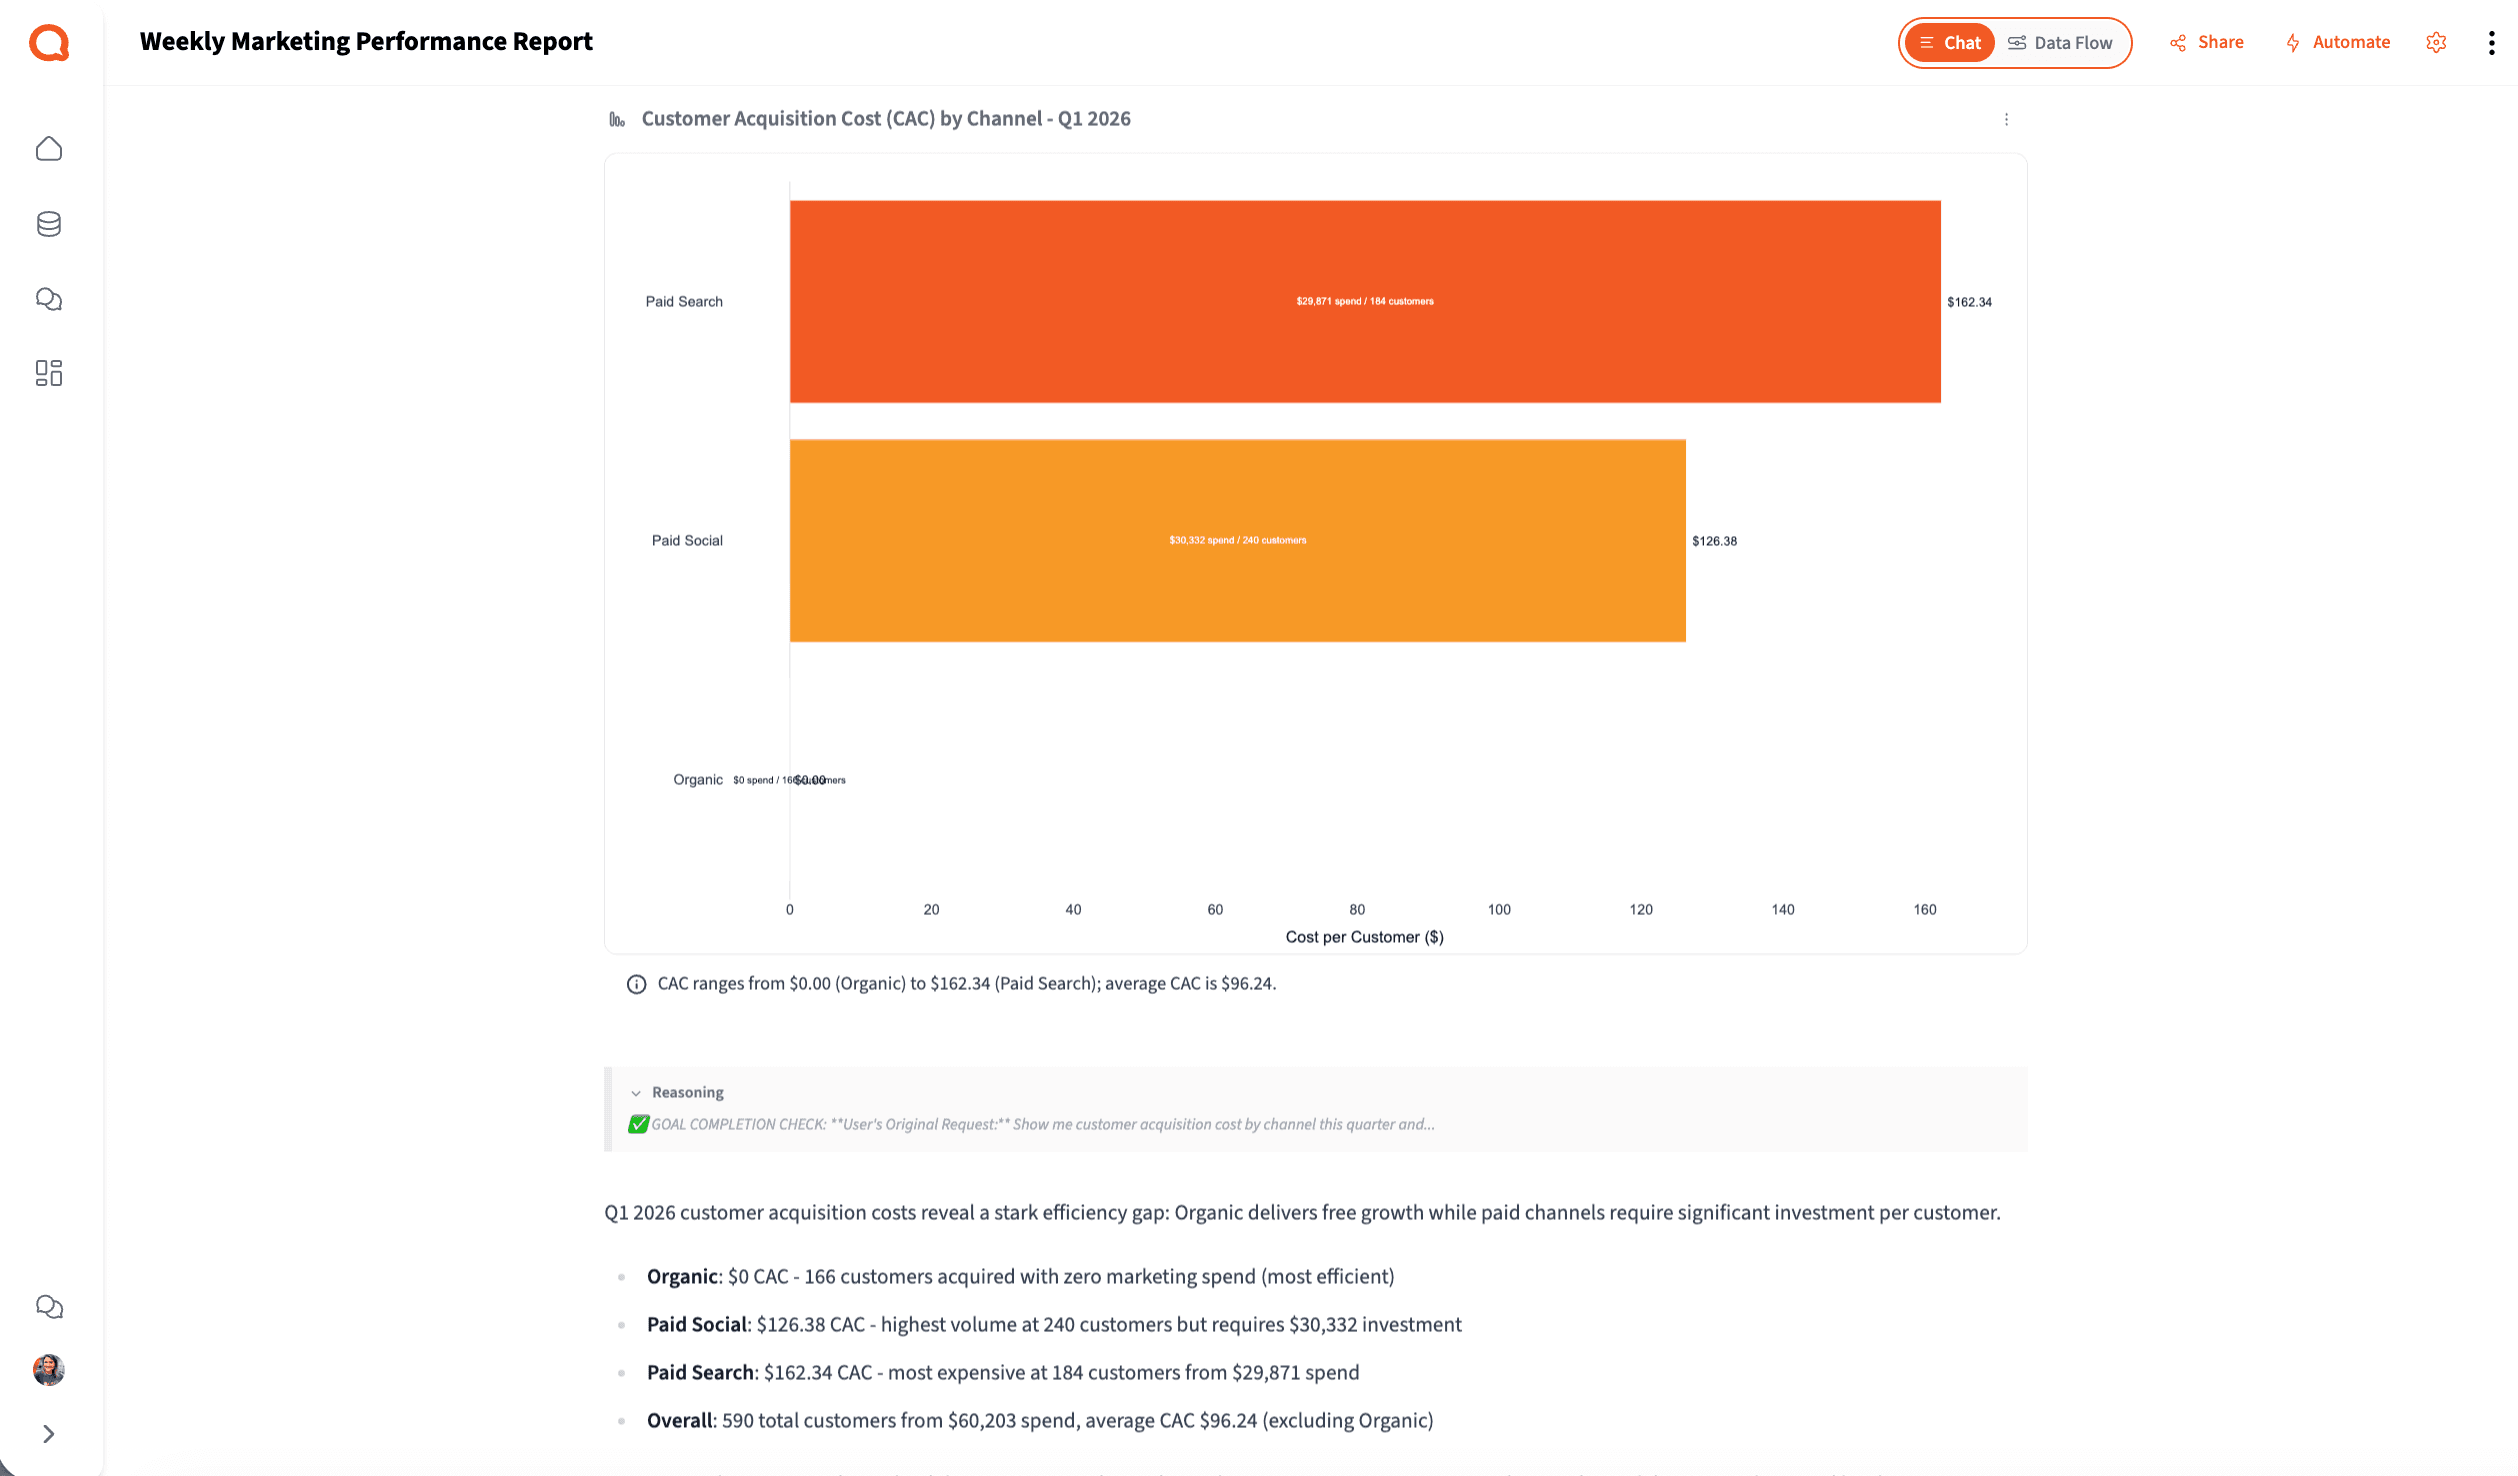
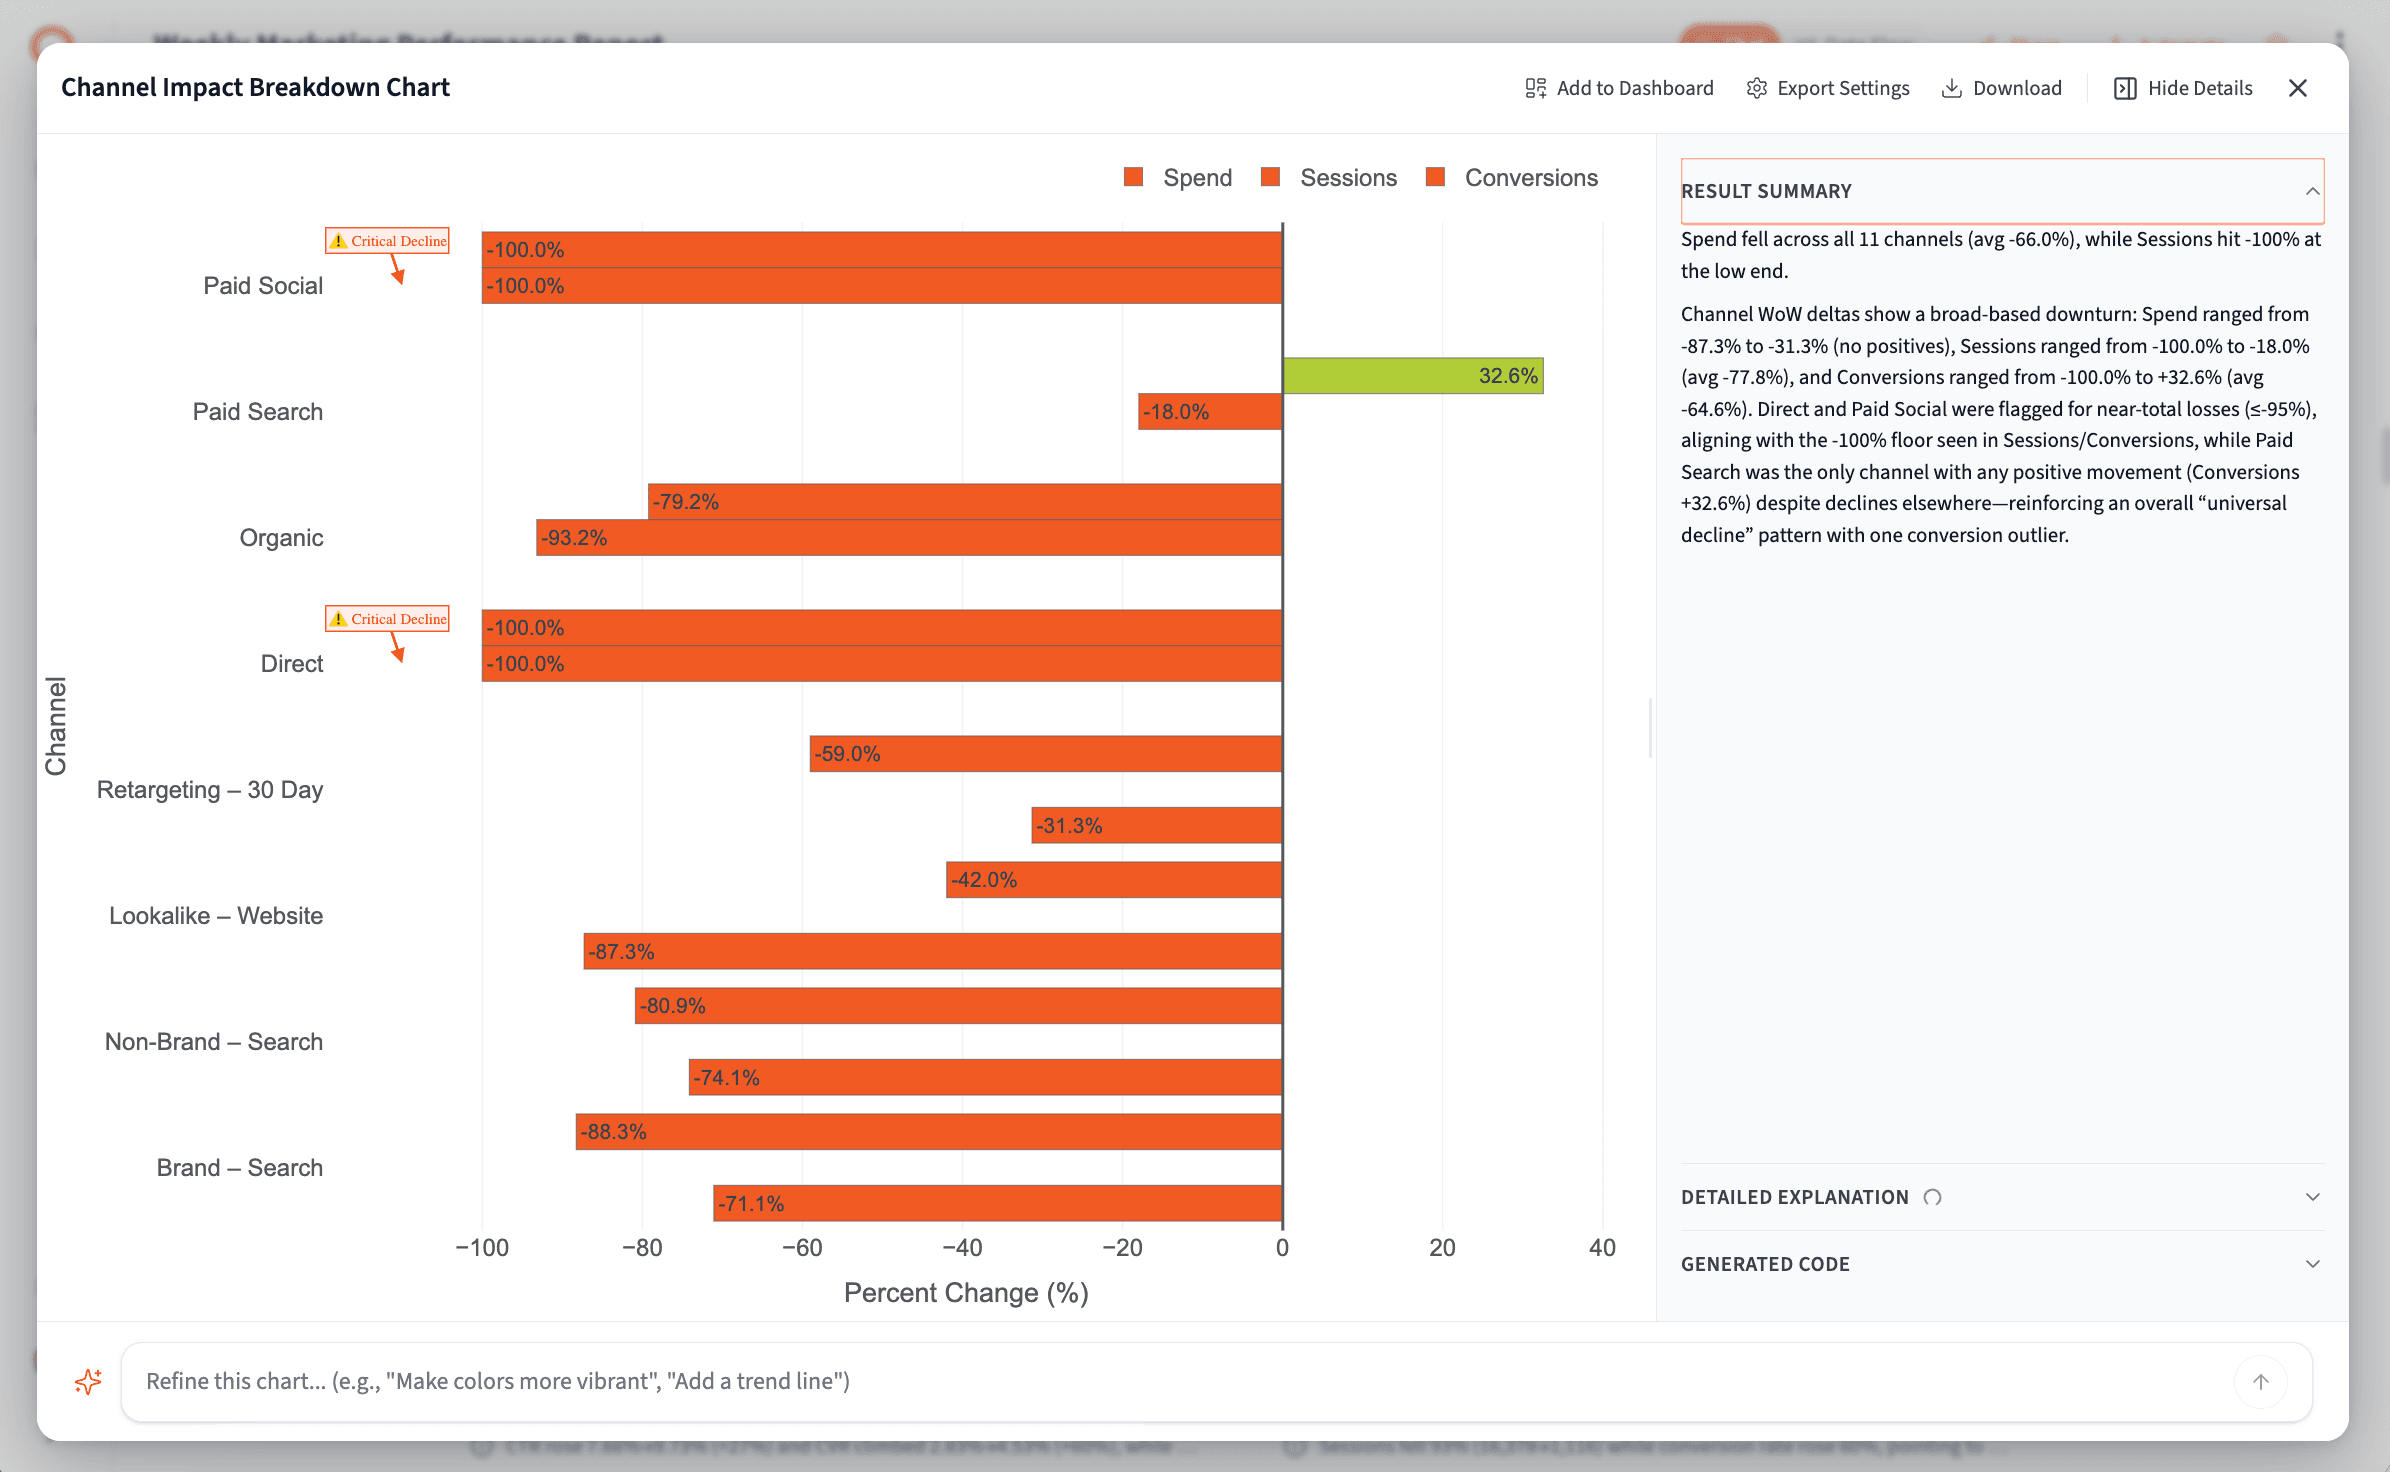
Step 3 — Analyze
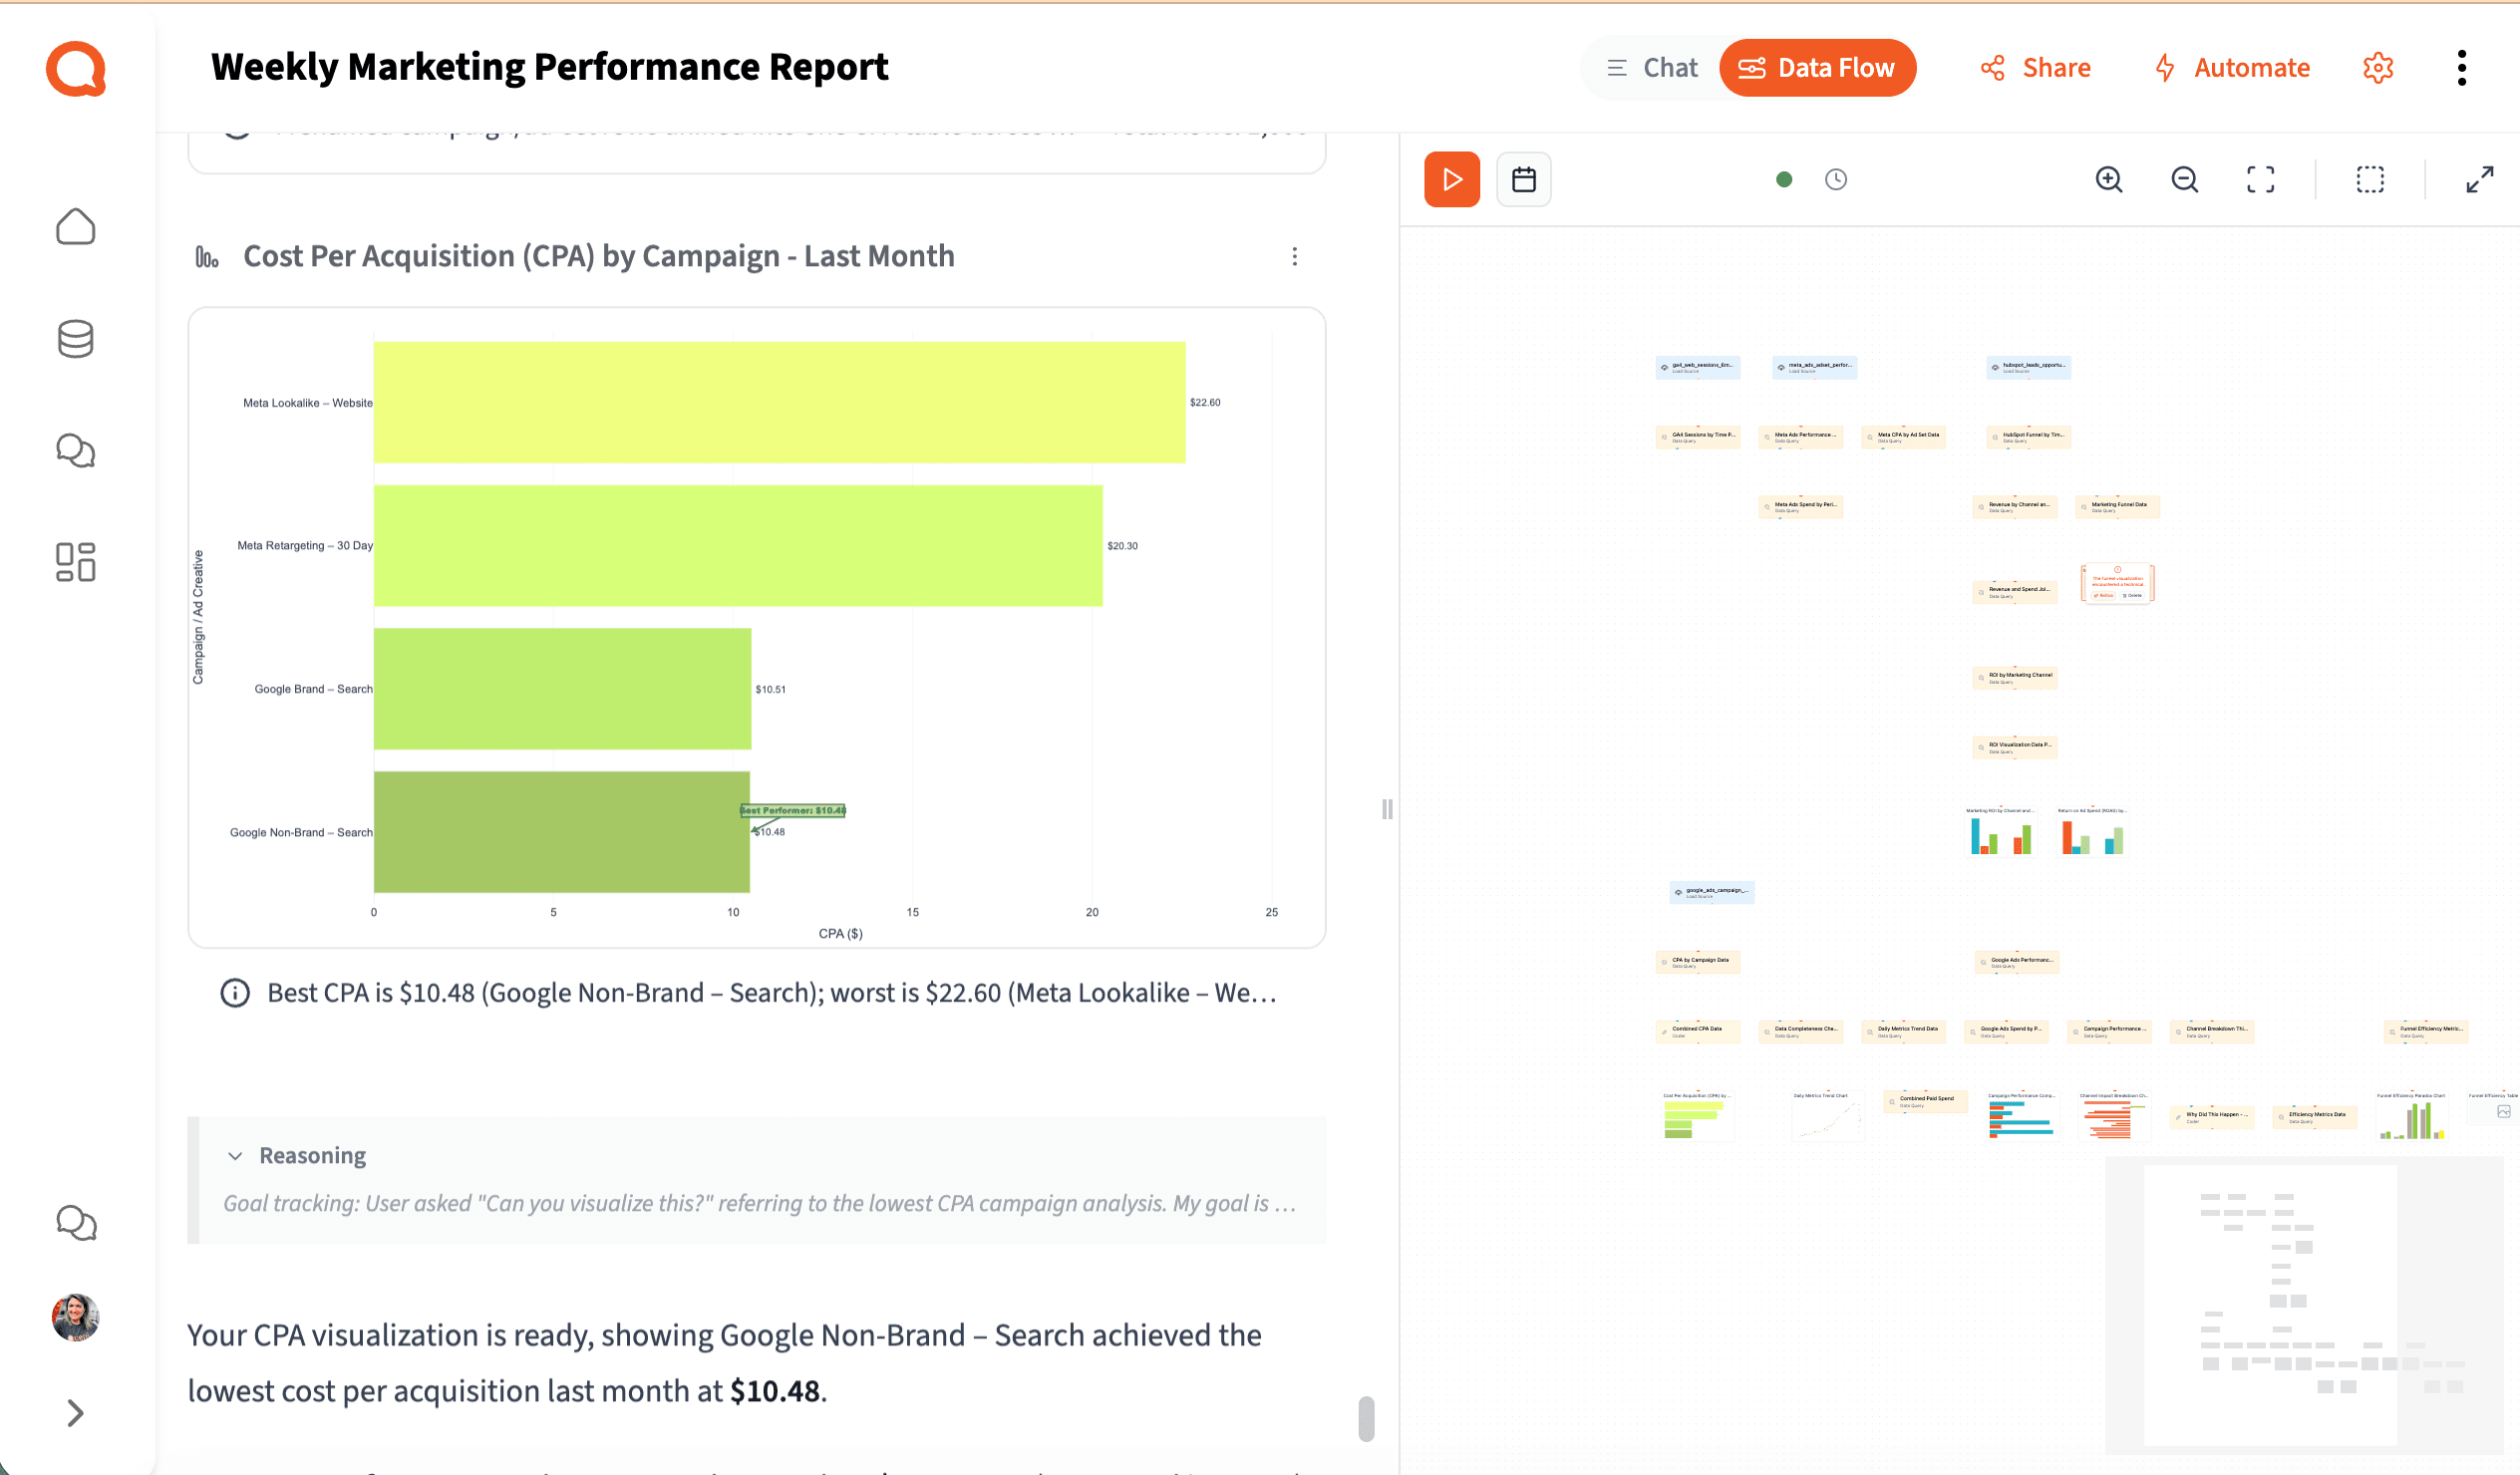
Move Beyond Clicks — Analyze What Actually Drives Revenue
The reality for most marketing teams
You're spending half your time on the report — and none of it on what the report is supposed to answer.
Based on research across demand gen and marketing ops teams at software SMBs.
2.5 hrs
Per report, built manually
Every reporting cycle — jumping between GA4, Meta, Google Ads, and a slide template.
5+
Tools the average team juggles
Each with its own export, its own format, and none talking to the others.
~20 min
Of a 2.5-hr report spent on insight
When 80% of your time goes to formatting, the narrative and the recommendation barely get a look-in.
Step 4 — Share & Automate
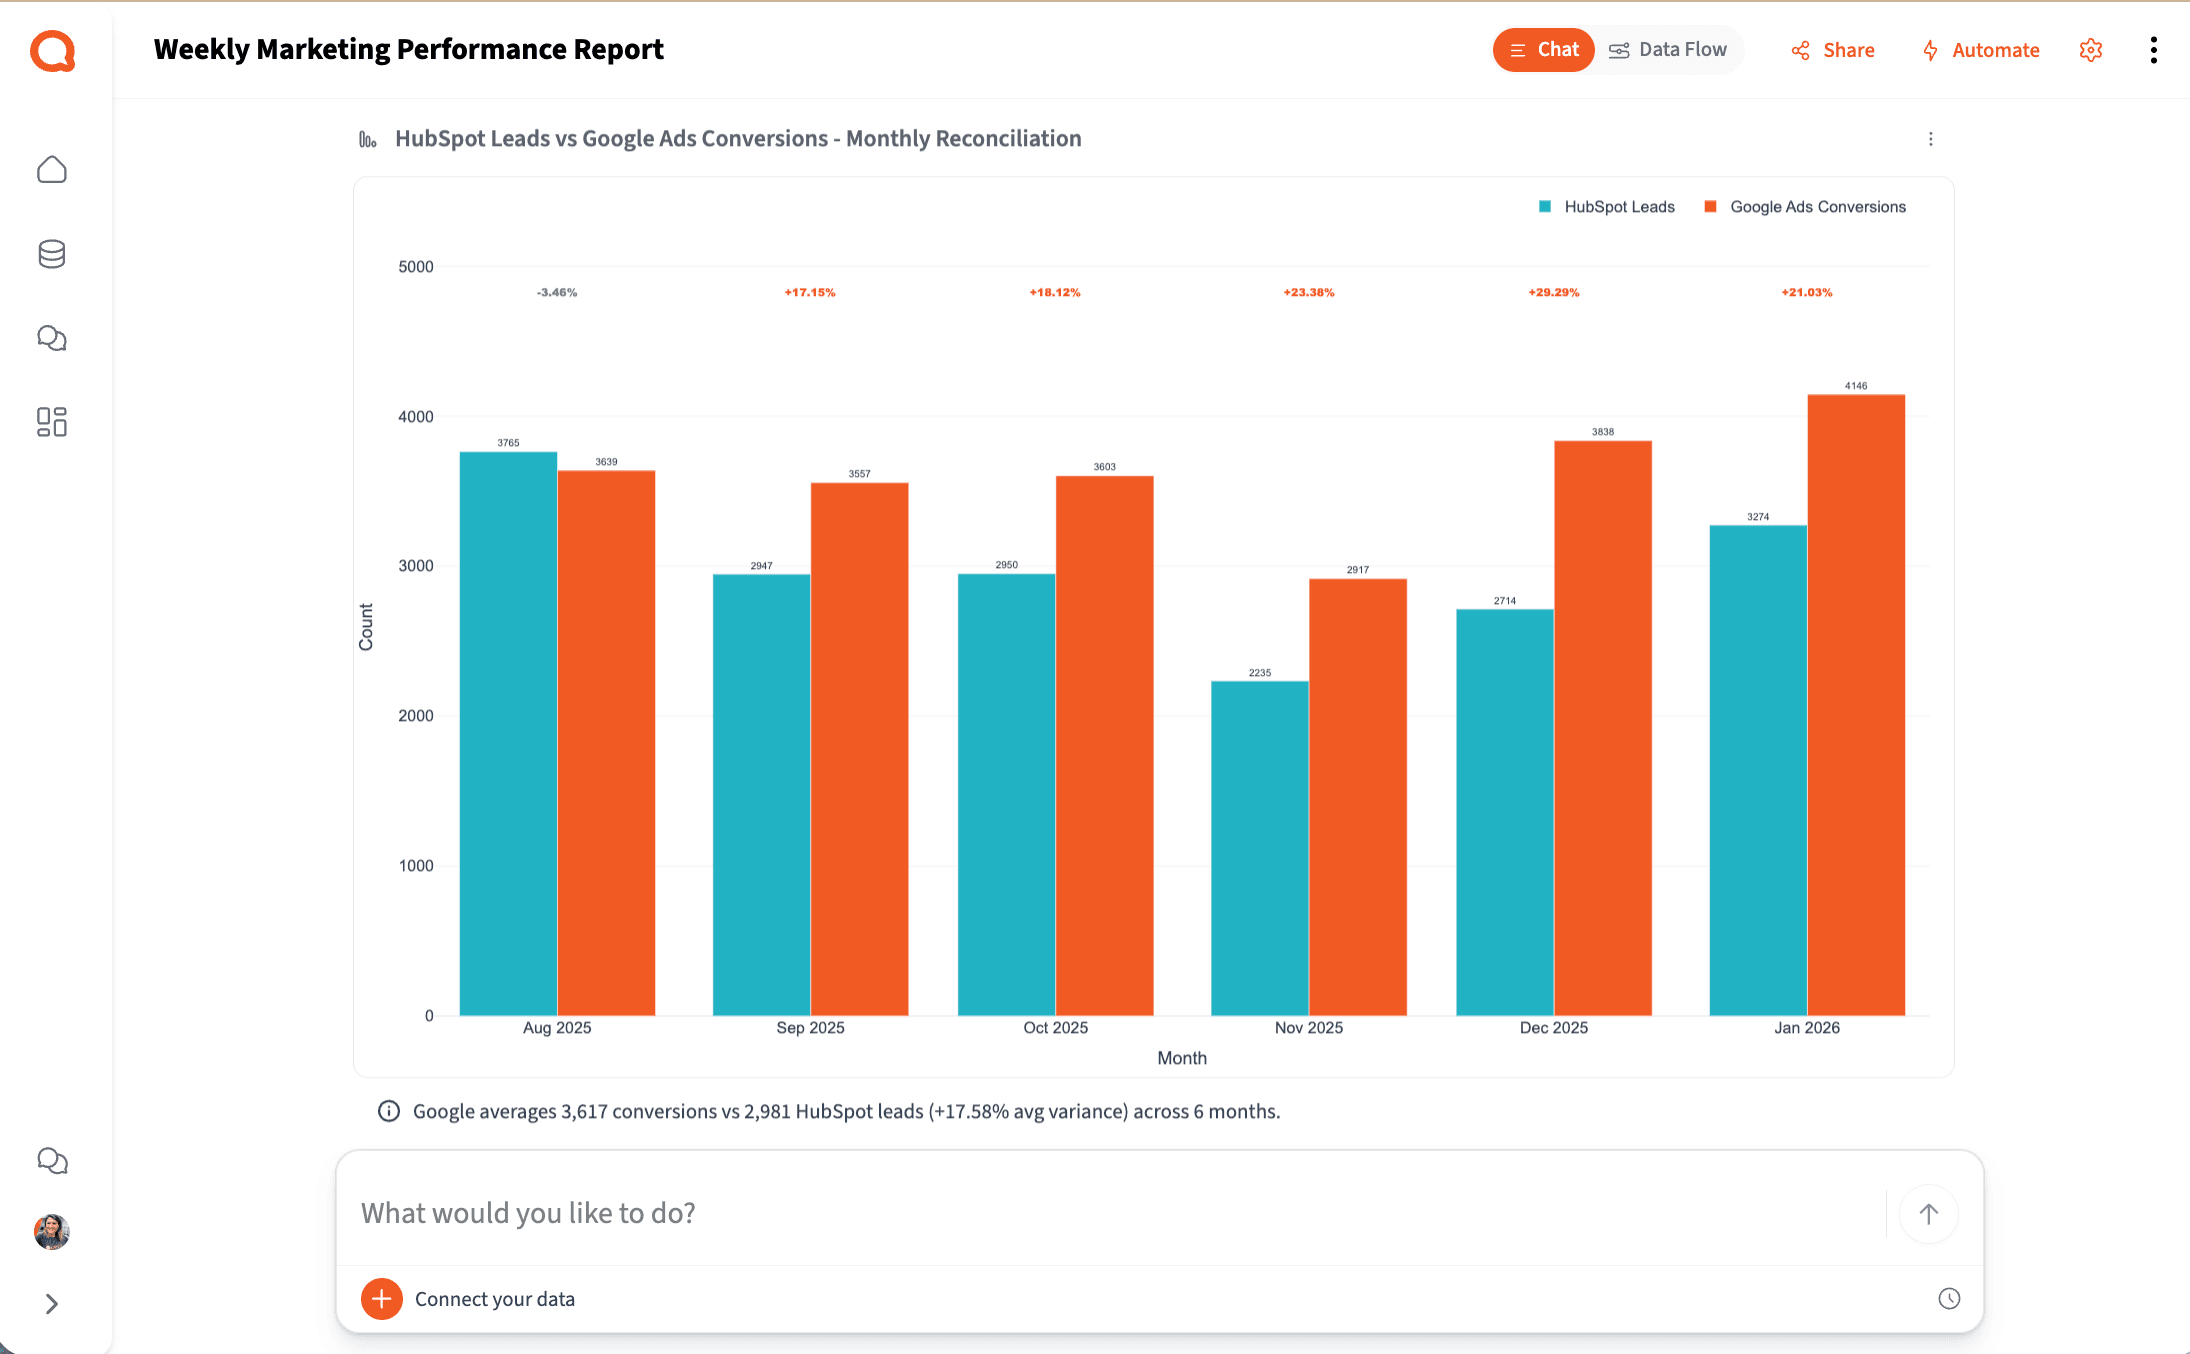
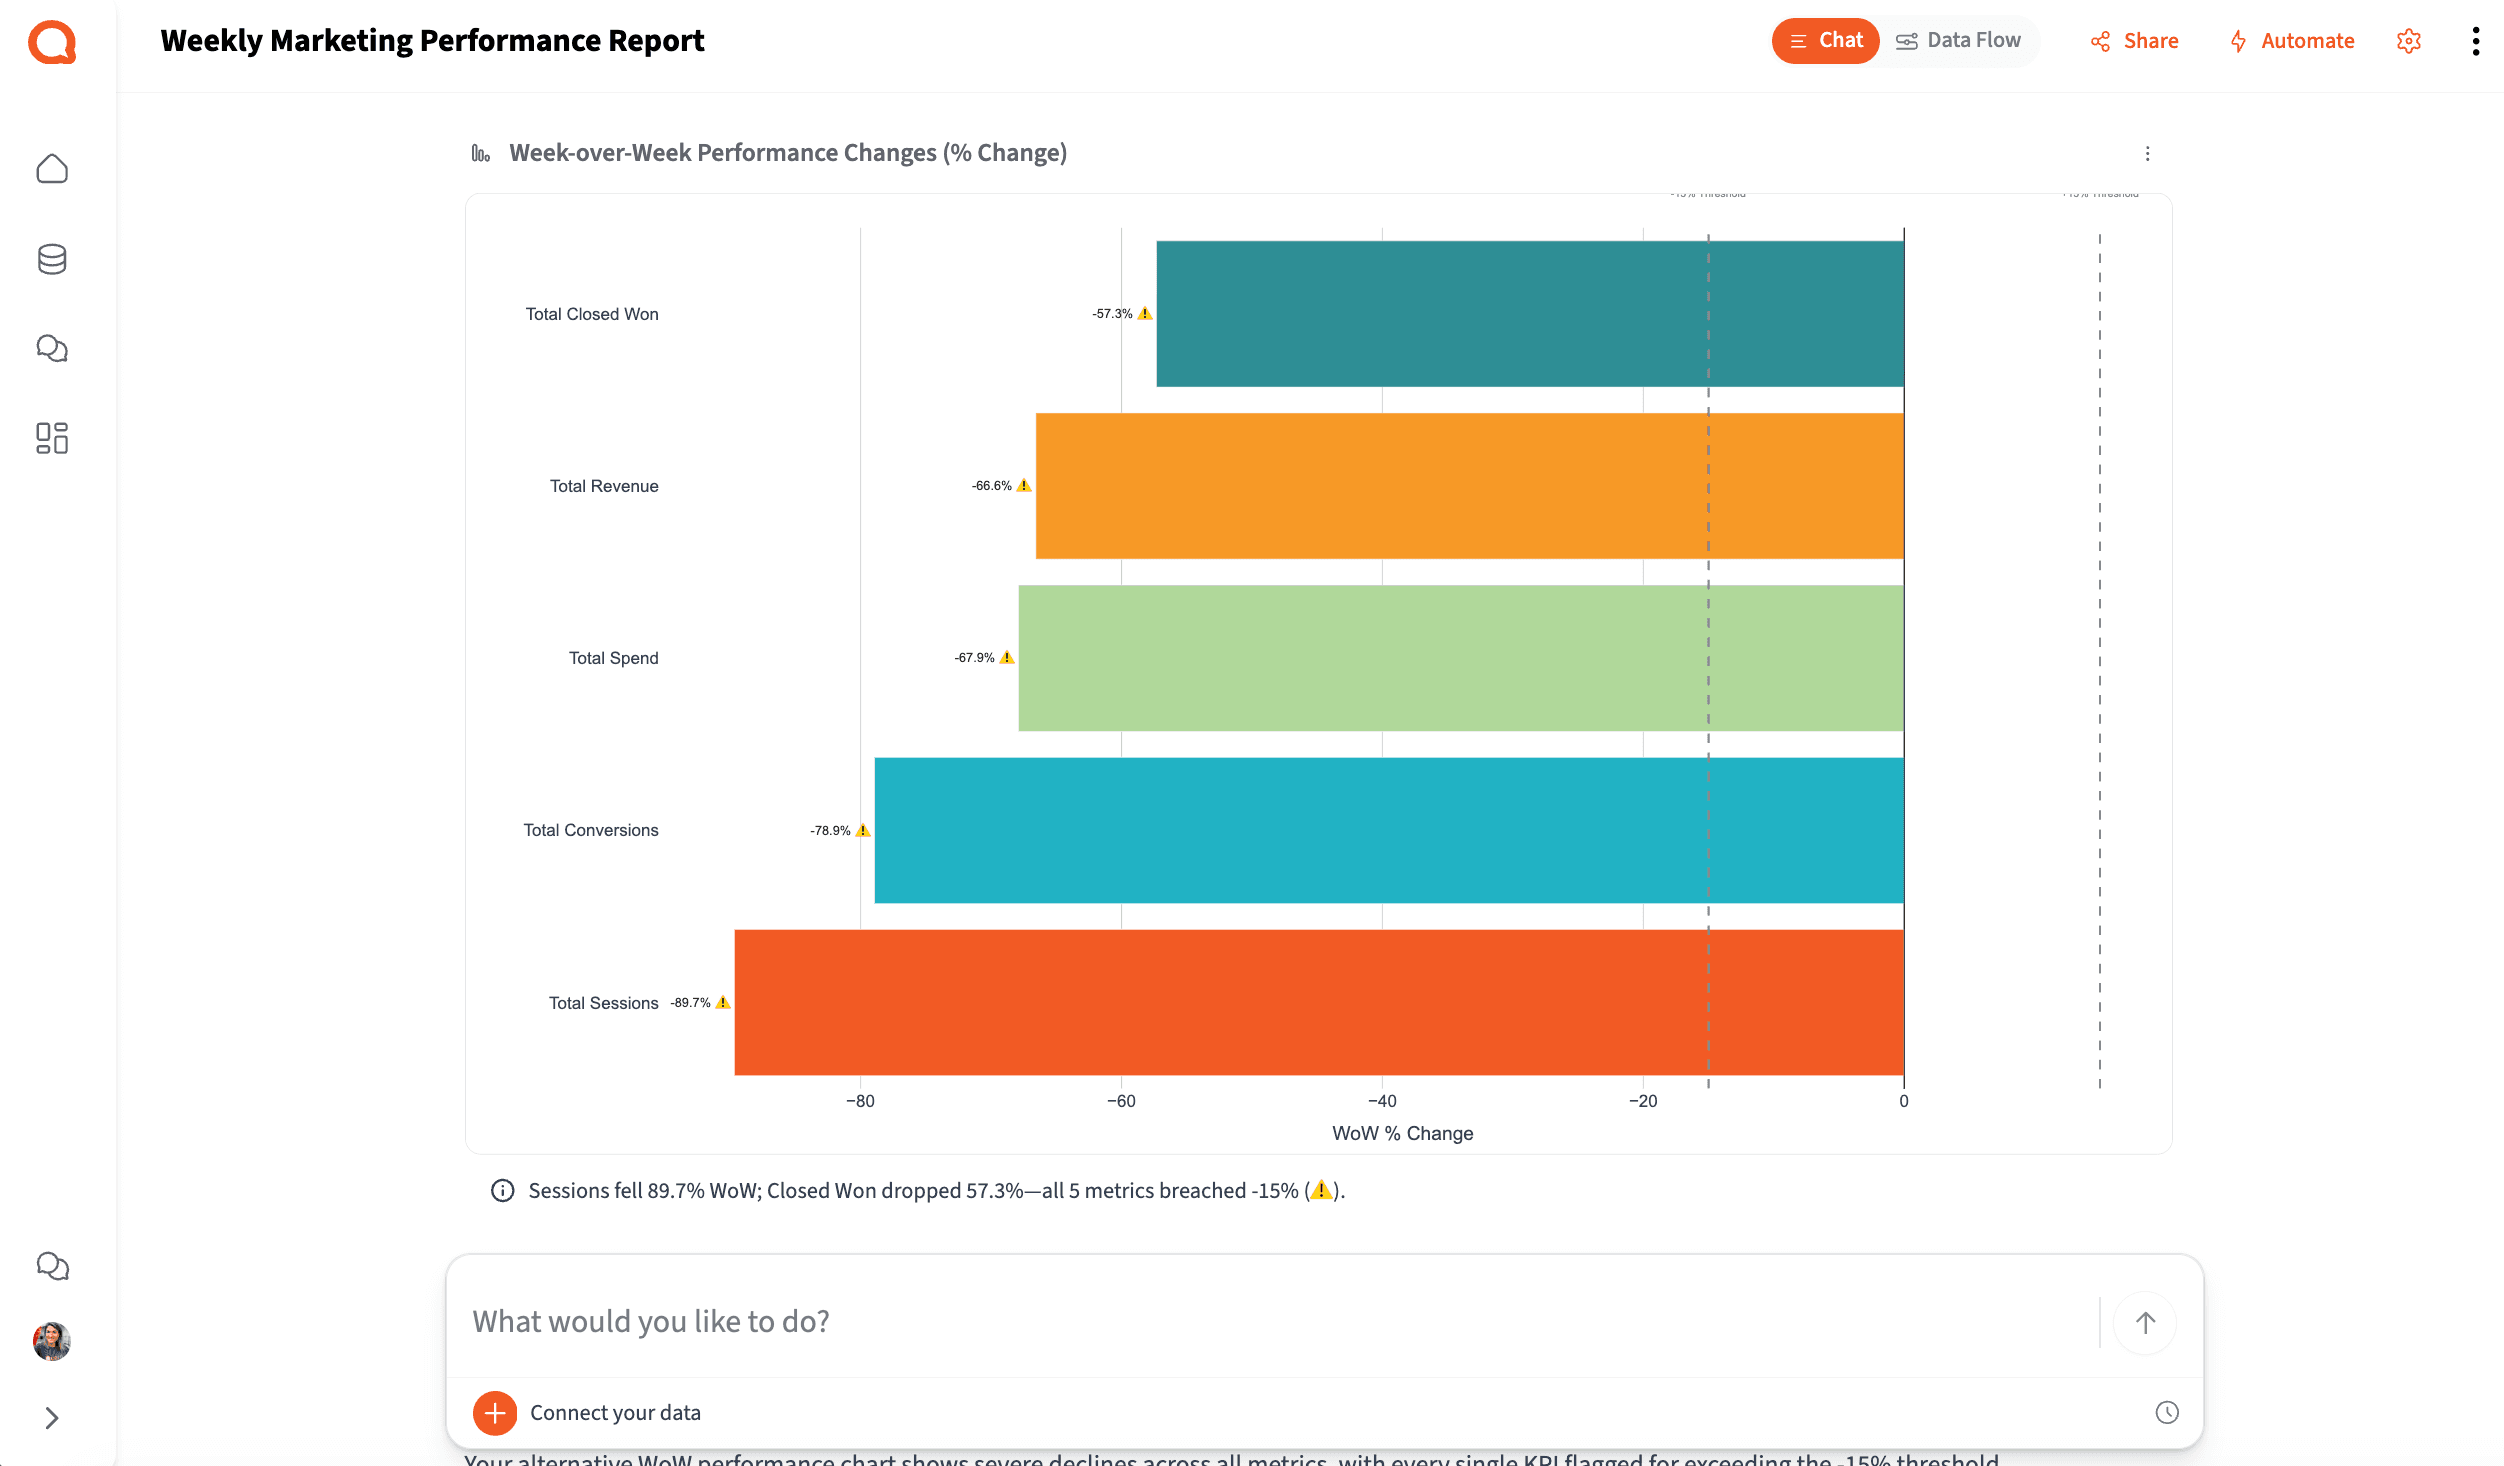
Automate Weekly, Monthly, and Board-Ready Reports
The fee is earned by explaining why things changed — not formatting slides.
Marketing Operations Manager
B2B SaaS, 150-person company
New — Querri Wrapped
You found the insight.
Querri builds the presentation.
The best use of human intelligence isn't formatting slides — it's knowing what the data means and what to do about it. Querri Wrapped closes the loop on that: once your analysis is done, Querri's agentic pipeline turns it into a complete, branded presentation in seconds.
25 slide templates. Interactive Plotly charts. Fullscreen 16:9 presentation mode. Export to PowerPoint or PDF. Your brand colors applied automatically. The AI handles the production work — you walk into the room ready to present.
Ready to see Querri in action for your specific workflows?
Explore our library of step-by-step marketing playbooks — each one built around a real marketing job-to-be-done.
Why Querri
Built differently — so marketers can actually use it.
Projects, not chat sessions.
Your data, steps, and outputs are saved. Follow-up questions take seconds, not a full rebuild.
Transparent, not a black box.
Every step is reviewable — see exactly how a metric was calculated before you share it.
Live data, not stale exports.
Native integrations with HubSpot, BigQuery, Salesforce, and Google Drive refresh on a schedule.
The whole workflow. One platform. Any marketer can use it.
Try it freeSecurity & Privacy
Your data stays yours.
Querri is built for teams that handle sensitive commercial data. Enterprise-grade security, full auditability, and a strict zero-training policy — from day one.
SOC 2 Type II Certified
Independently audited →
Encryption in transit and at rest →
All data is encrypted end-to-end. Tenant isolation, RBAC, SSO/MFA, and full audit logging are included at every tier.
Full transparency — not a black box →
Every step Querri takes is visible and reviewable. See exactly how a metric was calculated and validate the answer before you share it.
Zero data training policy →
Your data is never used to train AI models. Customer data is isolated per tenant and never shared or commingled across accounts.
Why Marketing Teams Choose Querri
Simple ways to do hard things
Talk to your data through a chat interface and watch it transform in a spreadsheet view.
Reliable, repeatable data workflows
Clean, merge, and analyze once. Then set up your data workflows to run on your schedule.
Designed for humans, not machines
It’s not a black box. See an explanation of the data workflows behind every Querri.
Frequently Asked Questions
Why does my marketing data feel so hard to trust?
Which data sources does Querri connect to?
How is Querri different from Looker Studio, Power BI, or Supermetrics?
Can Querri calculate CAC, LTV, and revenue-per-channel?
How long does it take to build a weekly marketing report?
Can non-technical marketers actually use this?
Is Querri secure enough for client or enterprise data?
What formats can I export reports in?
Does Querri connect to Google Ads, Meta, and LinkedIn?
What is marketing analytics and why does it matter?
Your marketing data has the answers. Querri helps you find them.
Connect your marketing stack, run your first performance report, and see what your data has been trying to tell you.