
Querri Start Guide
Welcome to Querri! Below is a quick step-by-step guide to get you started. Querri is built to make working with your data as easy as having a conversation. Just ask a question, and Querri will guide you to get answers quickly...no code or setup required.
Steps
Step 1: Create a Project
Start your first data project in Querri
Once you've signed up, click on the orange "+New Project" button to start your first data project. This creates a workspace where you can organize your data and conversations.
What You'll See
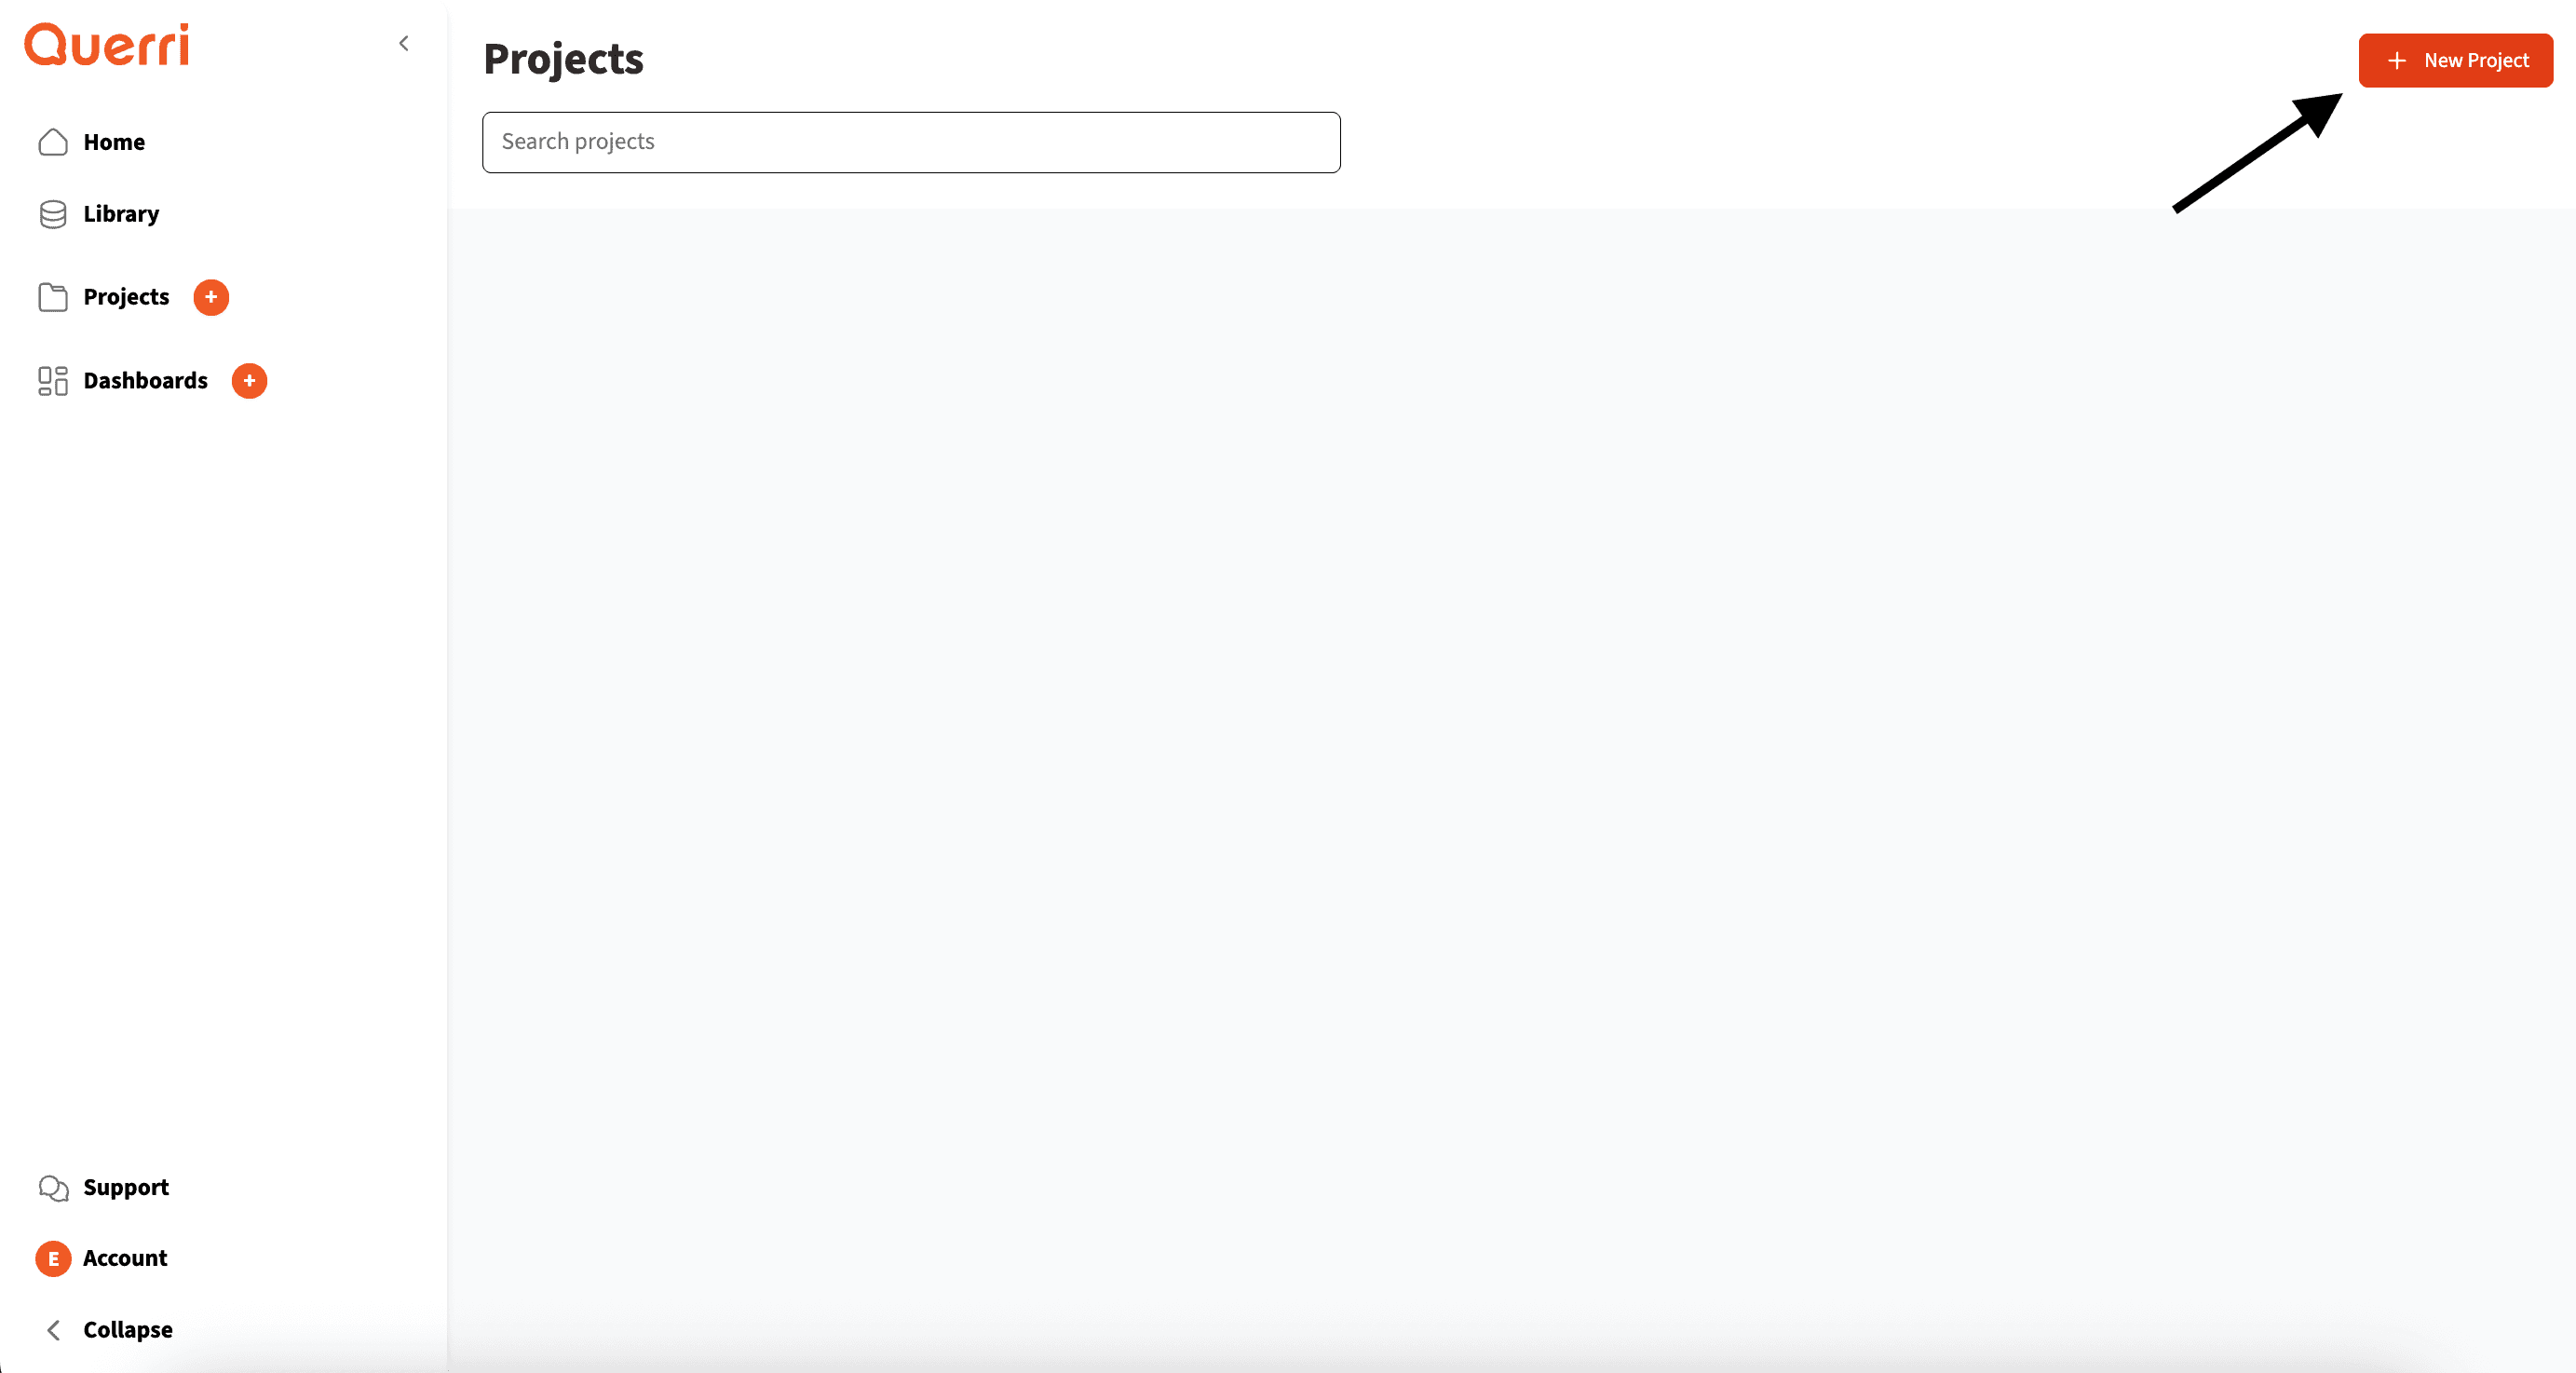

Projects Dashboard
Pro Tip: Give your project a descriptive name that reflects what data you'll be working with. This helps with organization as you create more projects.
Step 2: Connect Your Data
Upload files or connect to your data sources
Start with your own data (Recommended)! Click the orange + button to connect your data.
What You'll See
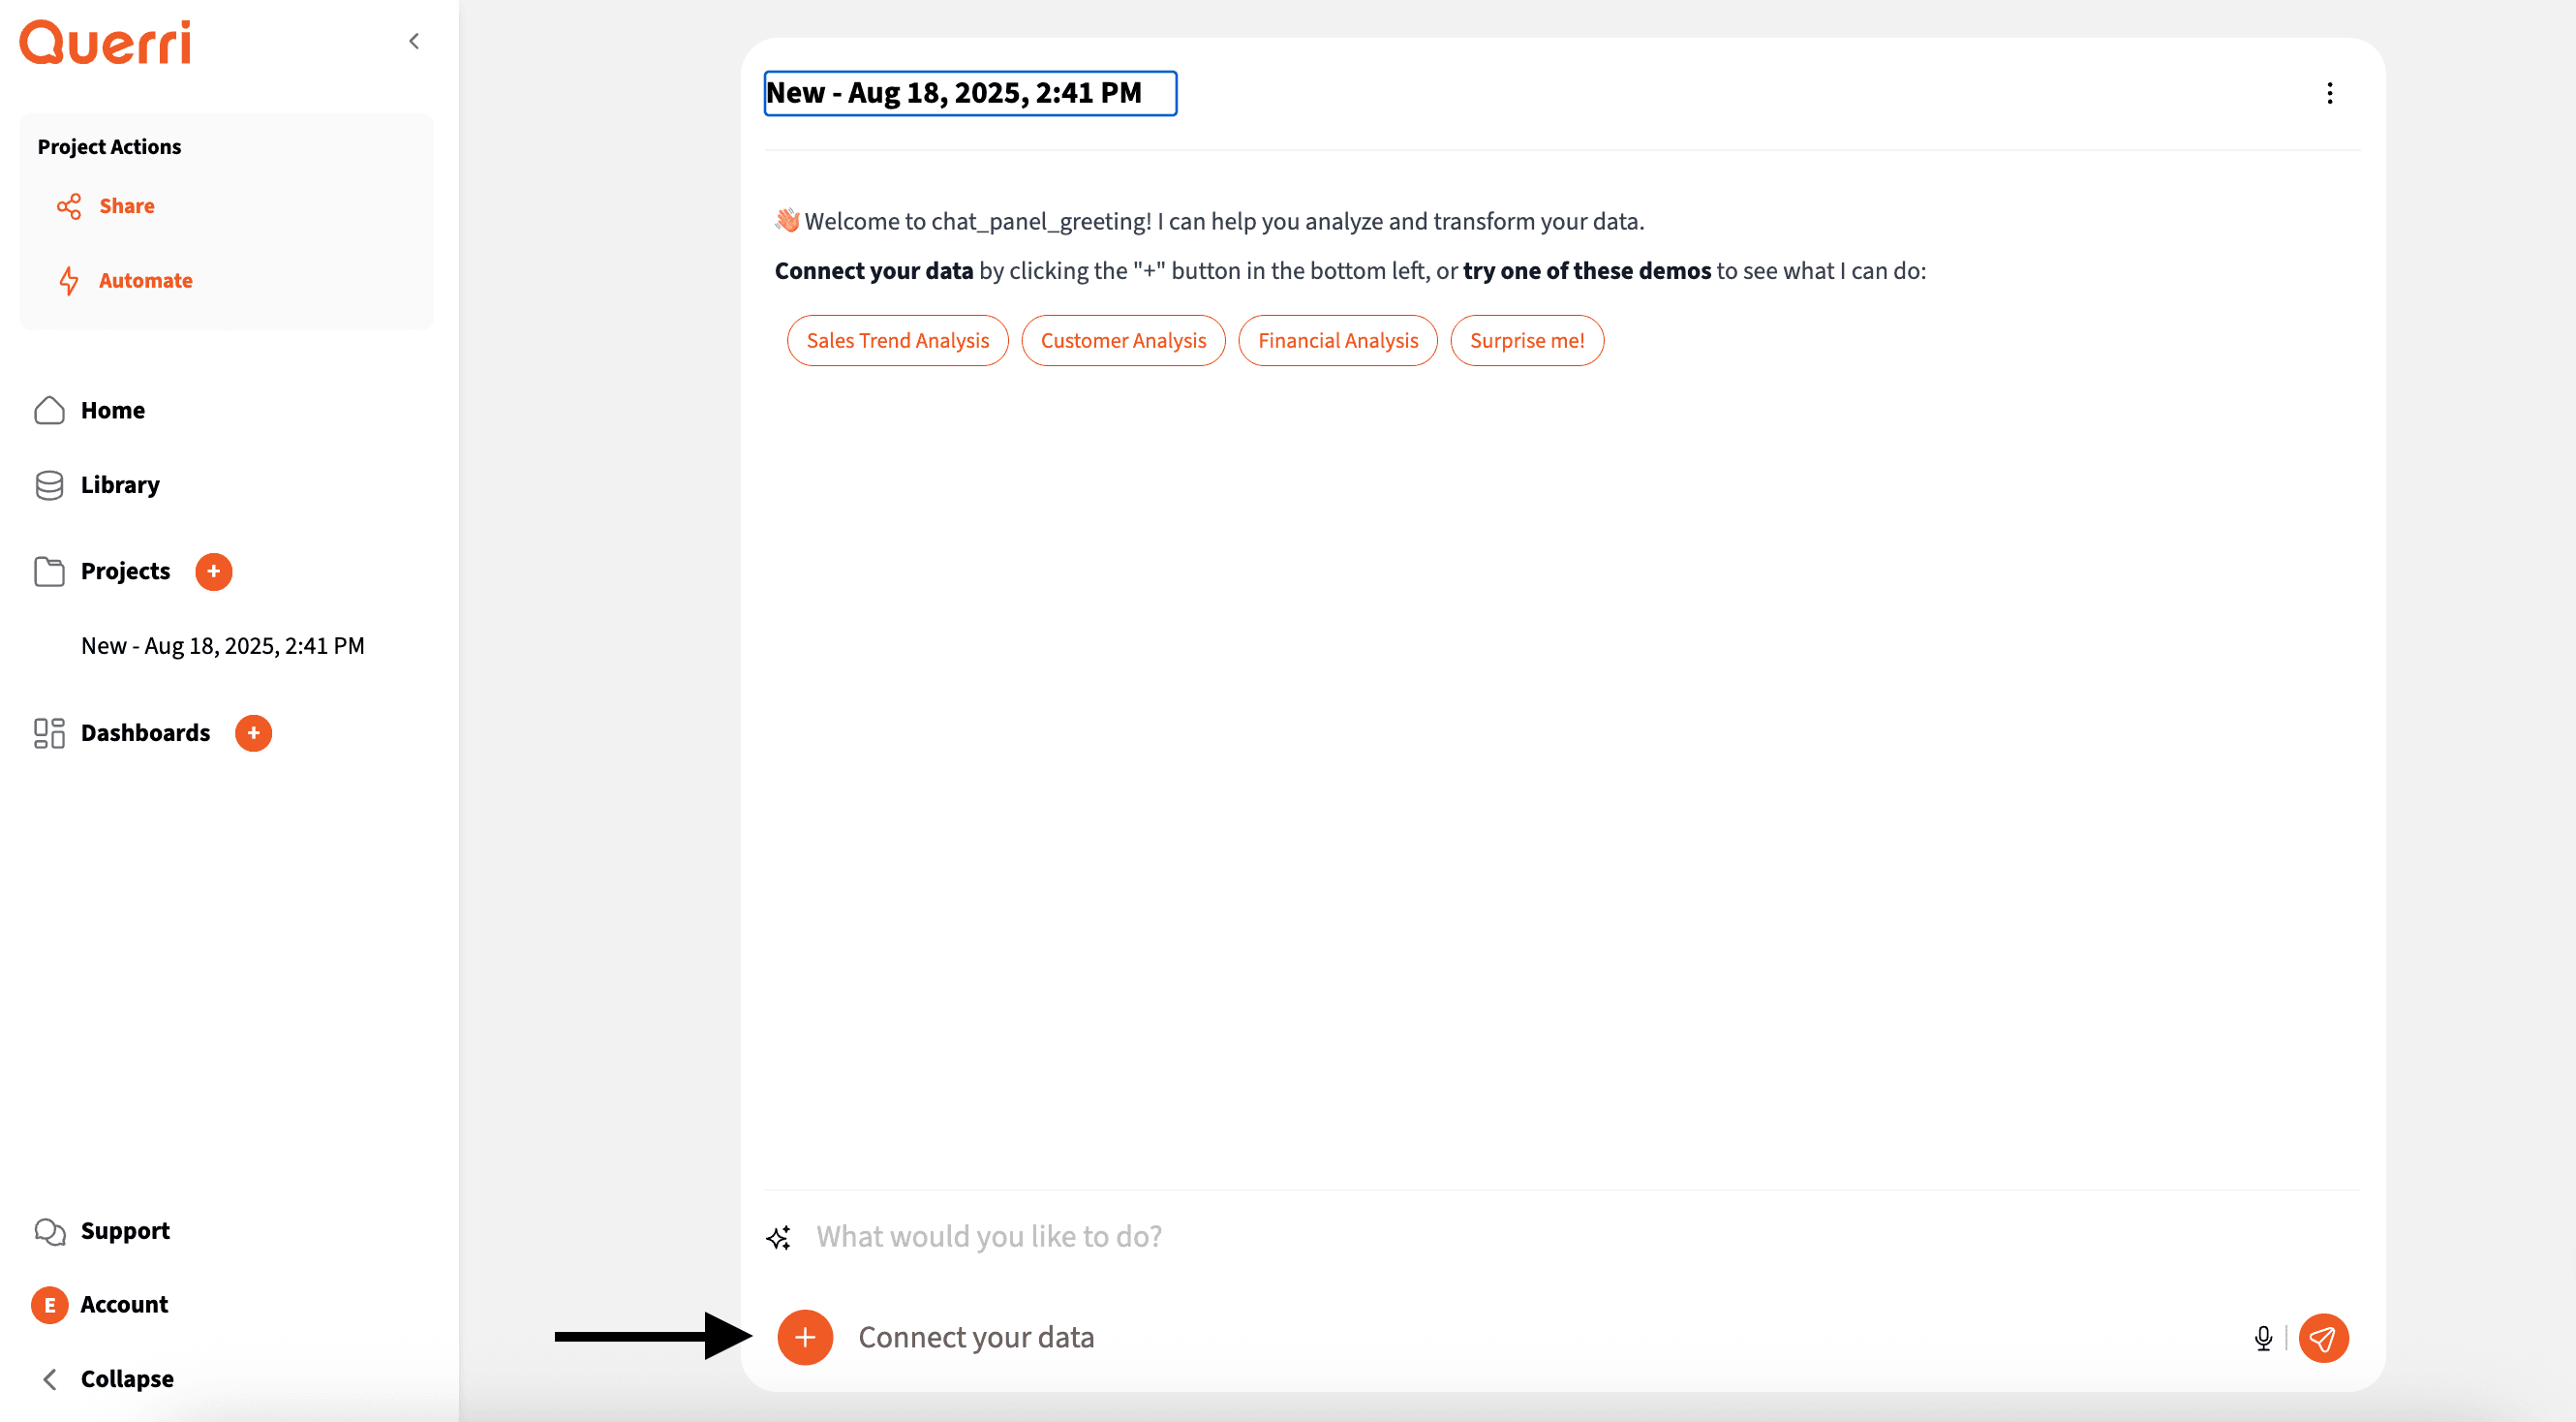

Main Interface - Click the orange + button
You can either drag and drop a CSV, ExcelJSON, or parquet file into your library or connect directly to your data sources, such as Dropbox, Google Drive, and more.
What You'll See
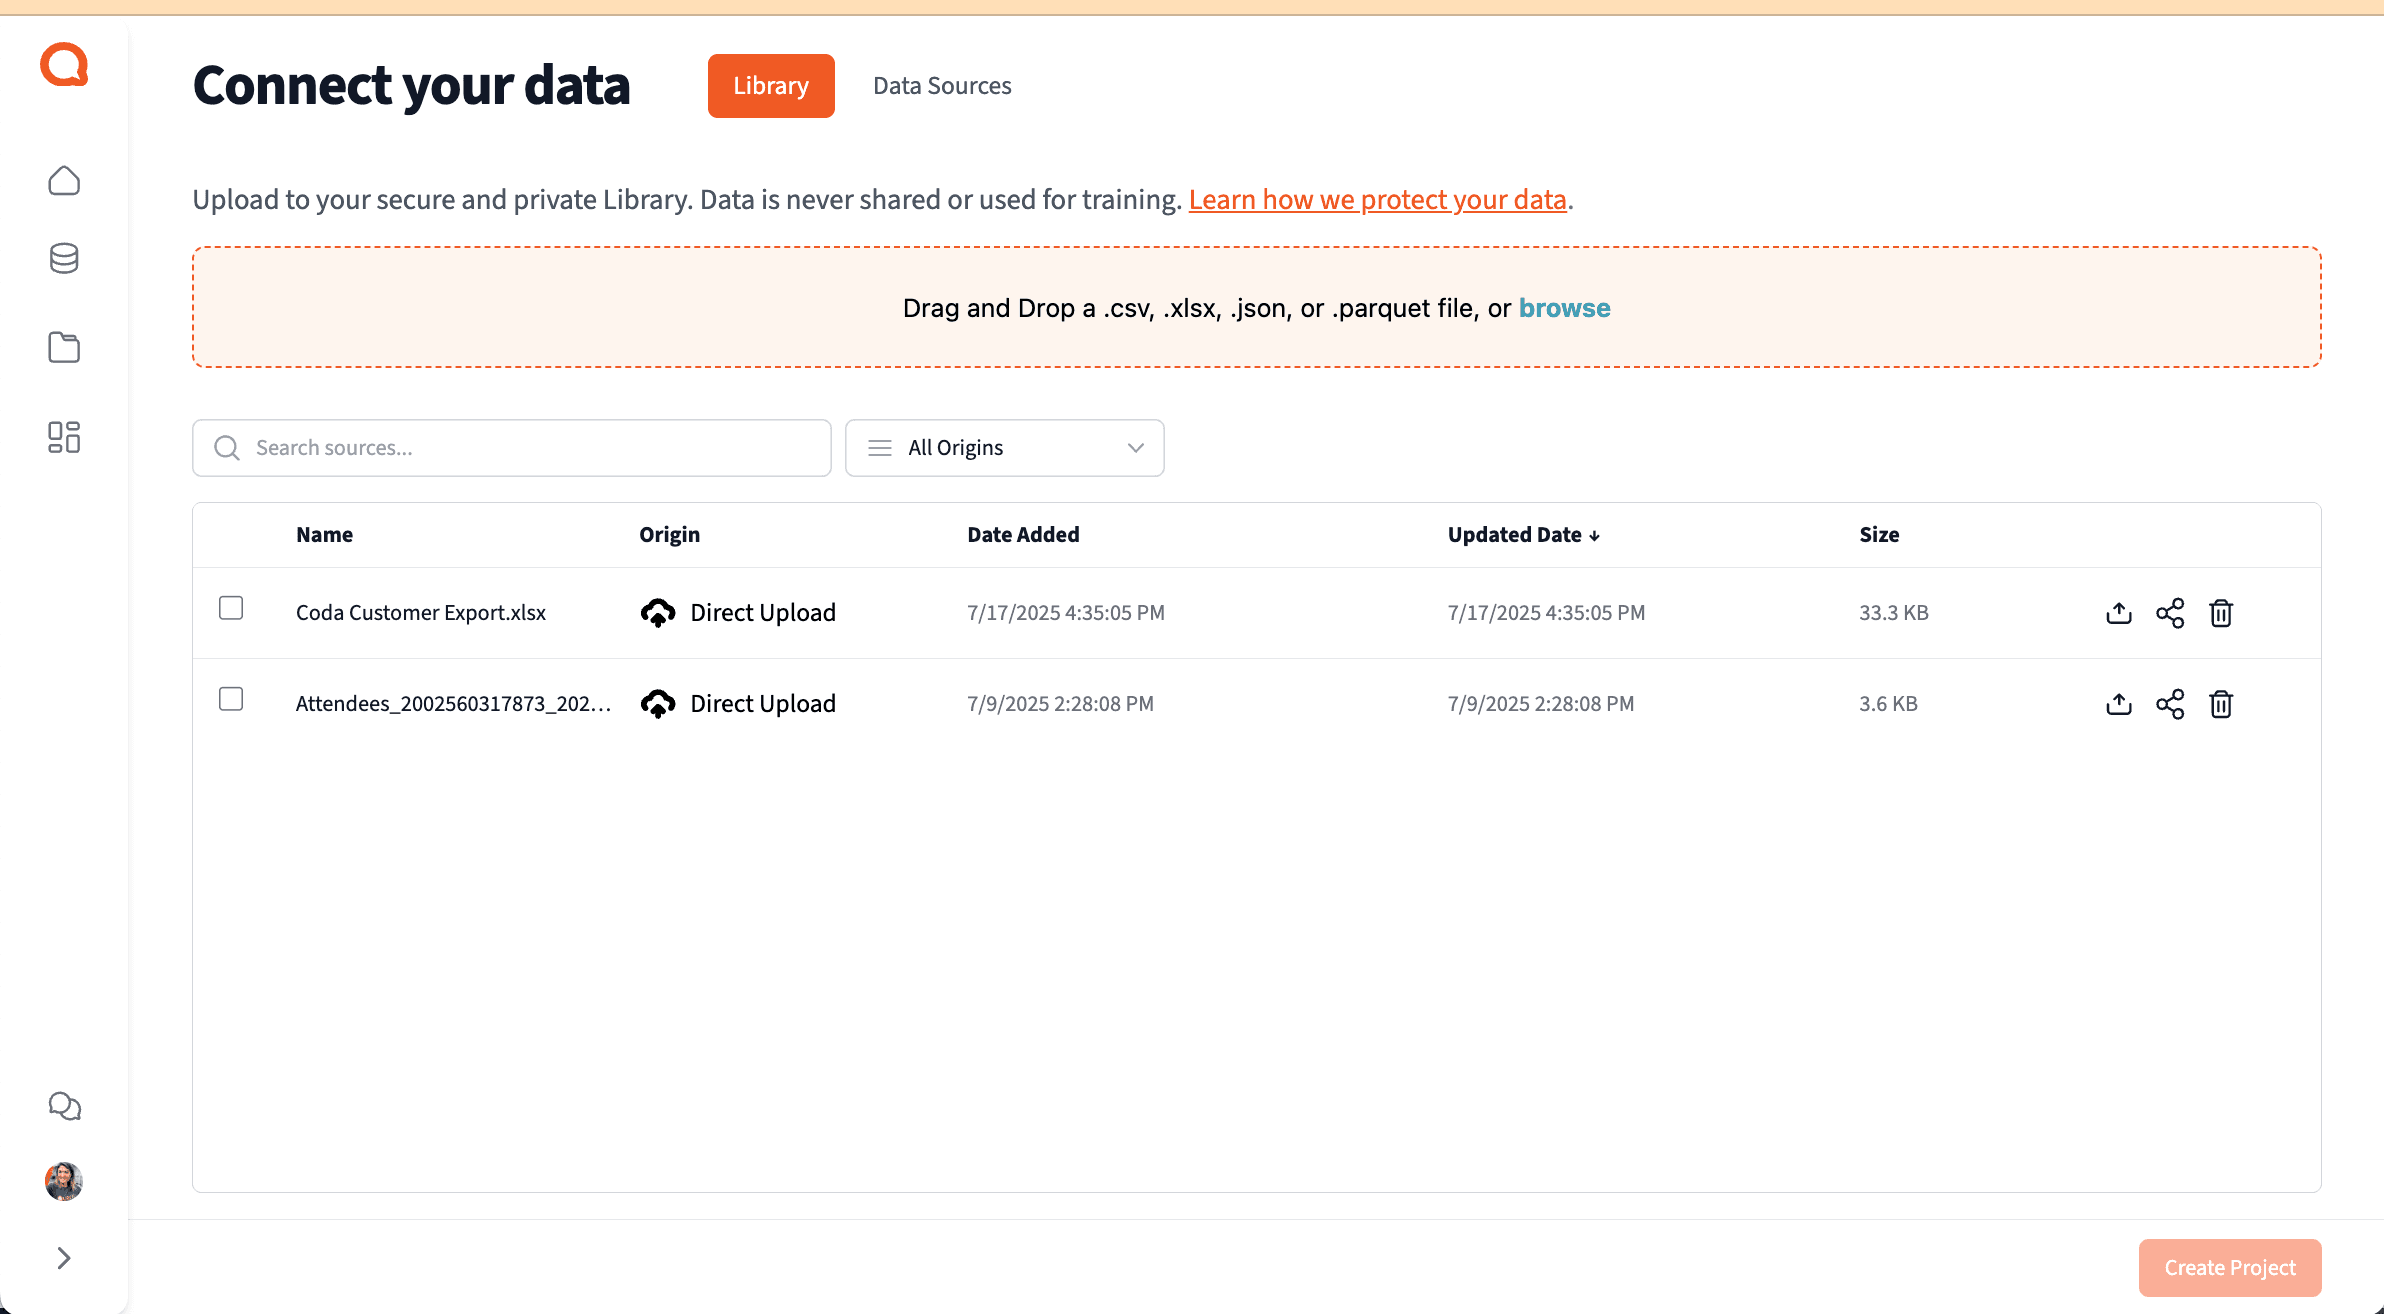

File Upload Modal
What You'll See
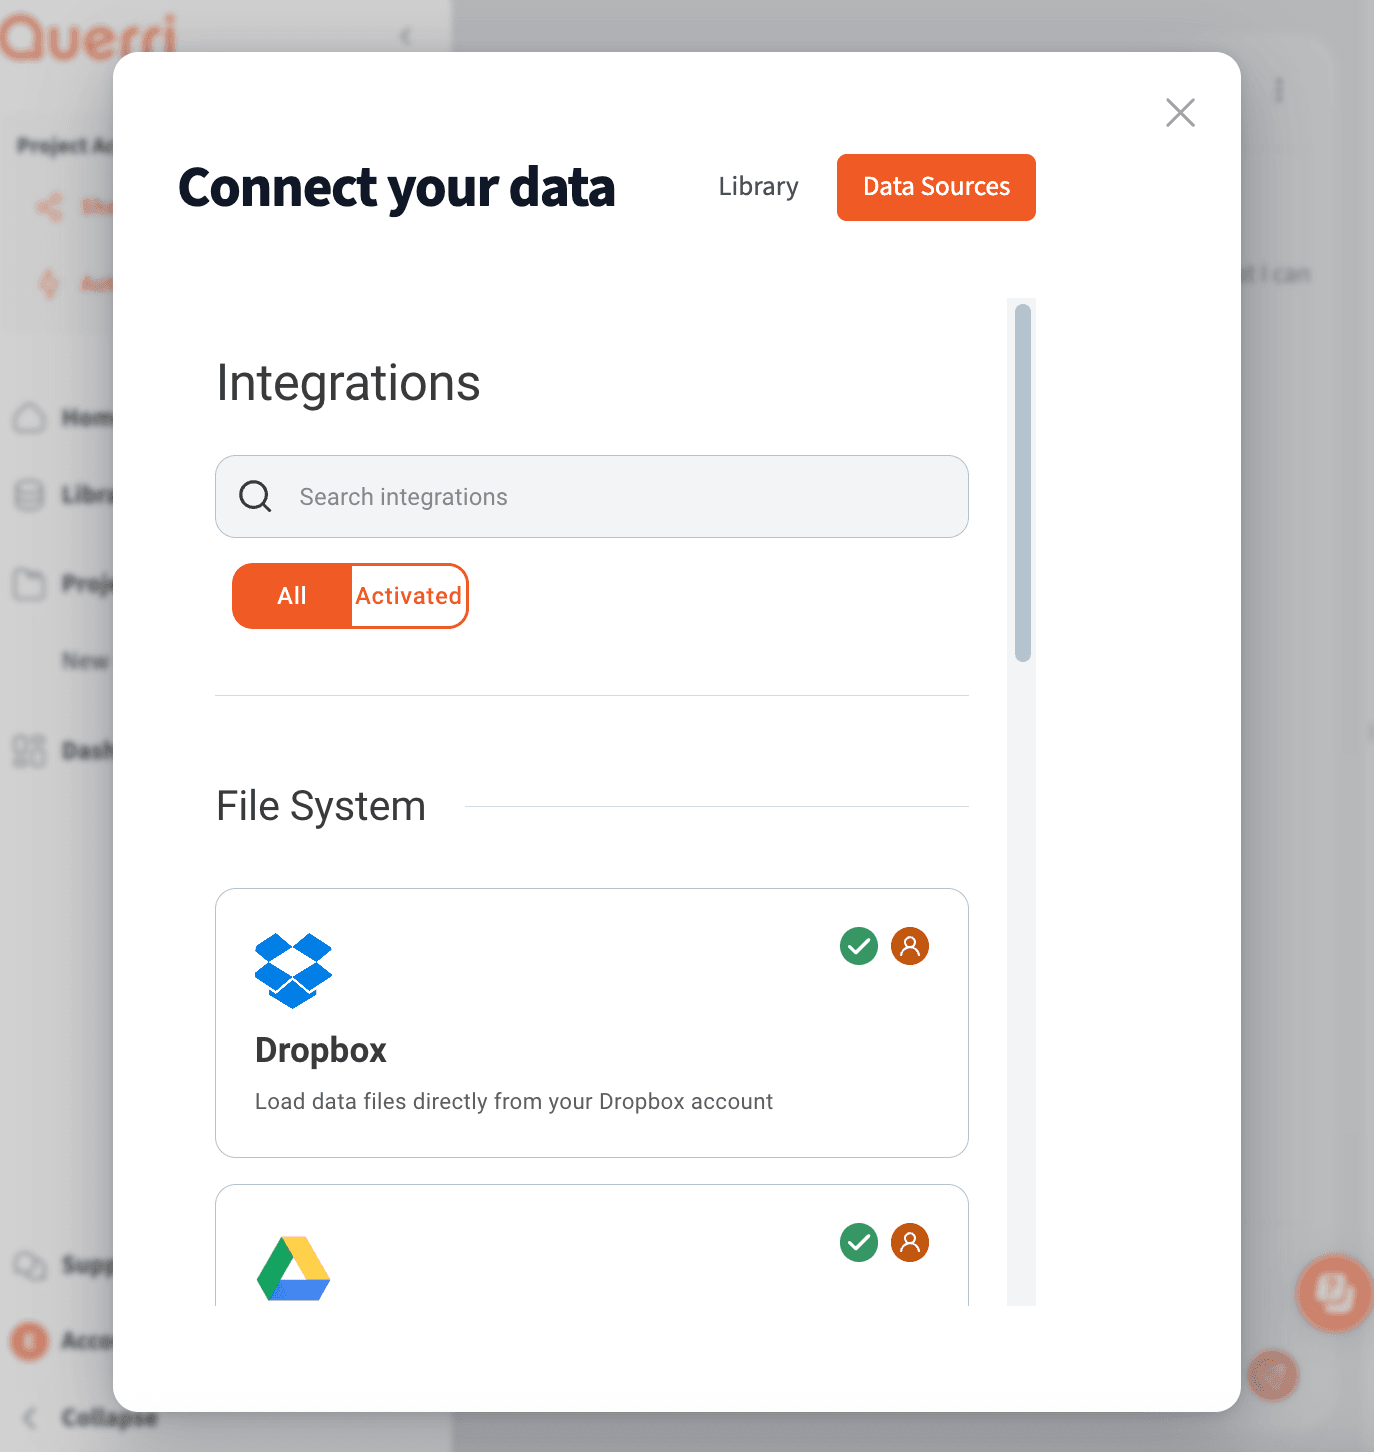

Data Sources Modal
Pro Tip: Your data is never shared or used for training. We use enterprise-grade security to protect your information.
Step 3: Start Exploring
Ask questions in natural language
Once your data is connected, you can start asking questions in plain English. Querri understands natural language and will help you explore your data, find insights, and create visualizations.
What You'll See
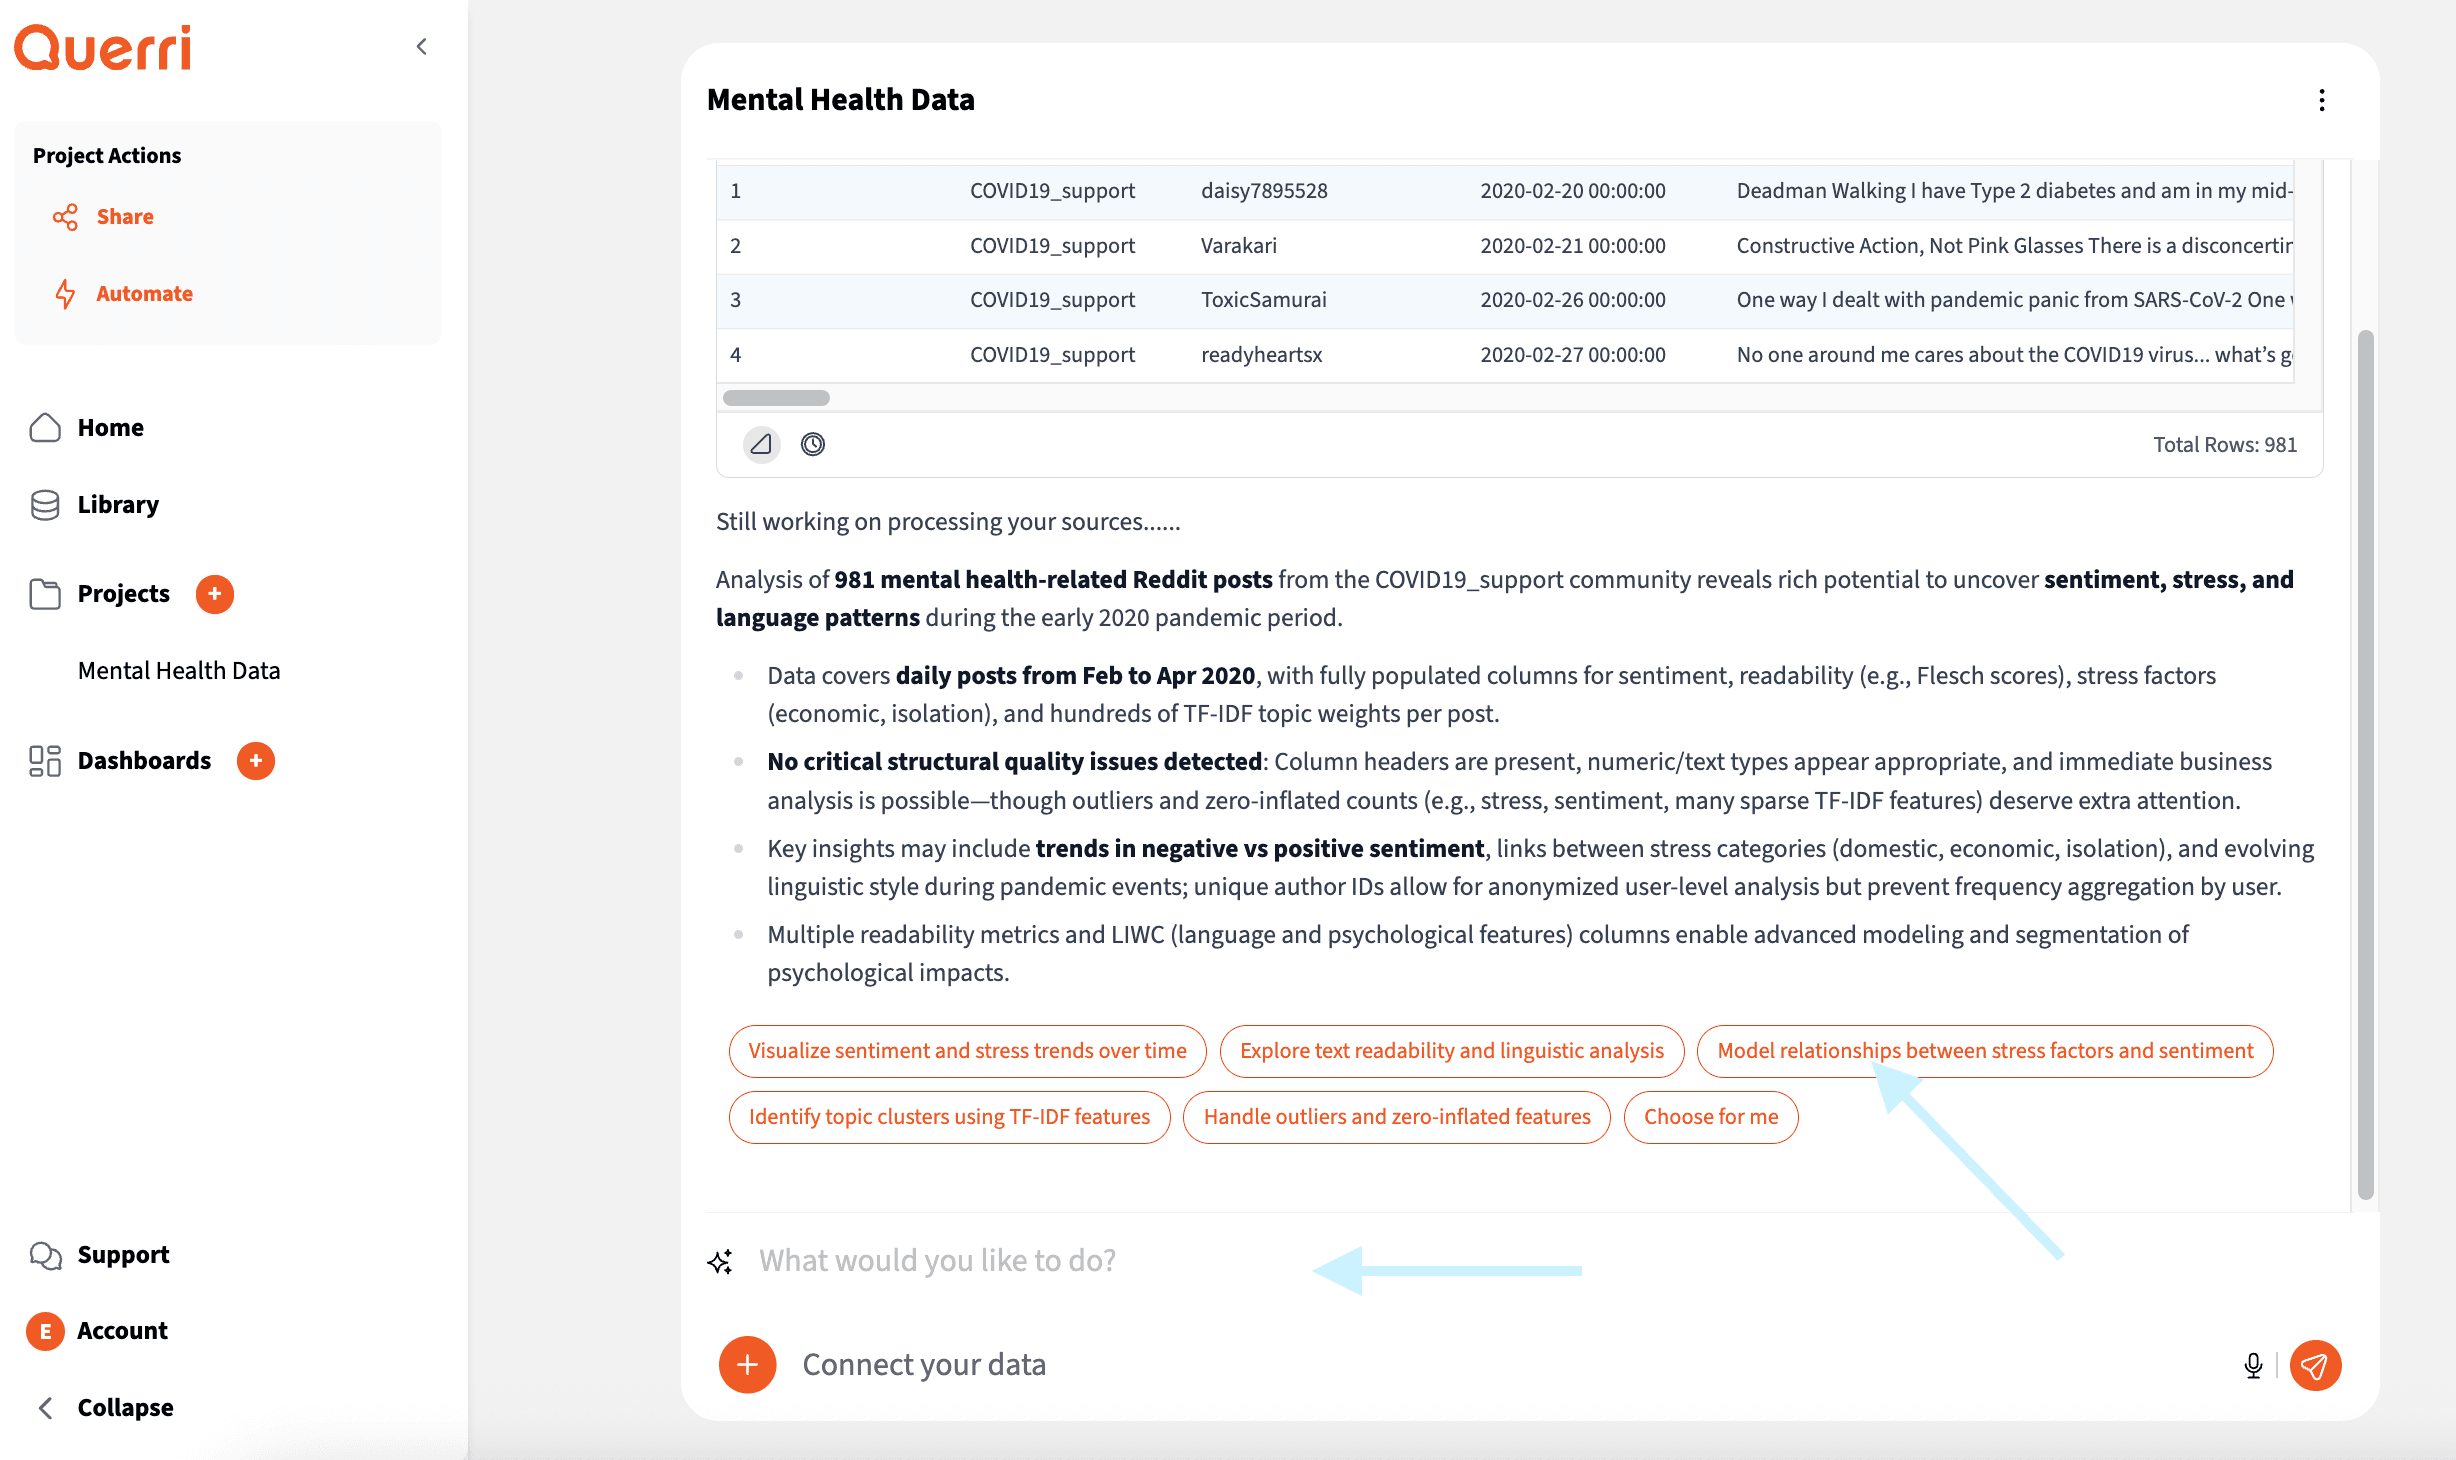

Chat Interface - Type or Click Suggestions
Type Your Own Question
Simply type your question in the chat box, just like you're talking to a friend! Ask anything from "What are my top selling products?" to "Show me sales trends for the last quarter." Querri understands natural language, so you don't need to learn any special commands.
Click AI Suggestions
Not sure what to ask? Querri's AI analyzes your data and suggests relevant questions you might want to explore. These suggestions are personalized based on your specific data, making it easy to discover insights you might not have thought of!
Pro Tip: Be specific in your questions. Instead of "show me sales," try "show me total sales by product category for Q1 2024." The more specific you are, the better Querri can help you.
Step 4: Transform & Analyze
Clean and analyze your data with AI assistance
As you analyze your data, Querri may report that your files need to be joined together, cleaned up, or formatted in some way. Don't worry - this is completely expected! Querri's AI is here to help guide you through these common data preparation tasks.
Whether you need to combine multiple datasets, remove duplicate entries, fix formatting issues, or pivot your data for better analysis, Querri's AI can suggest the right transformations and walk you through each step. Think of it as having a helpful data expert by your side!
What You'll See
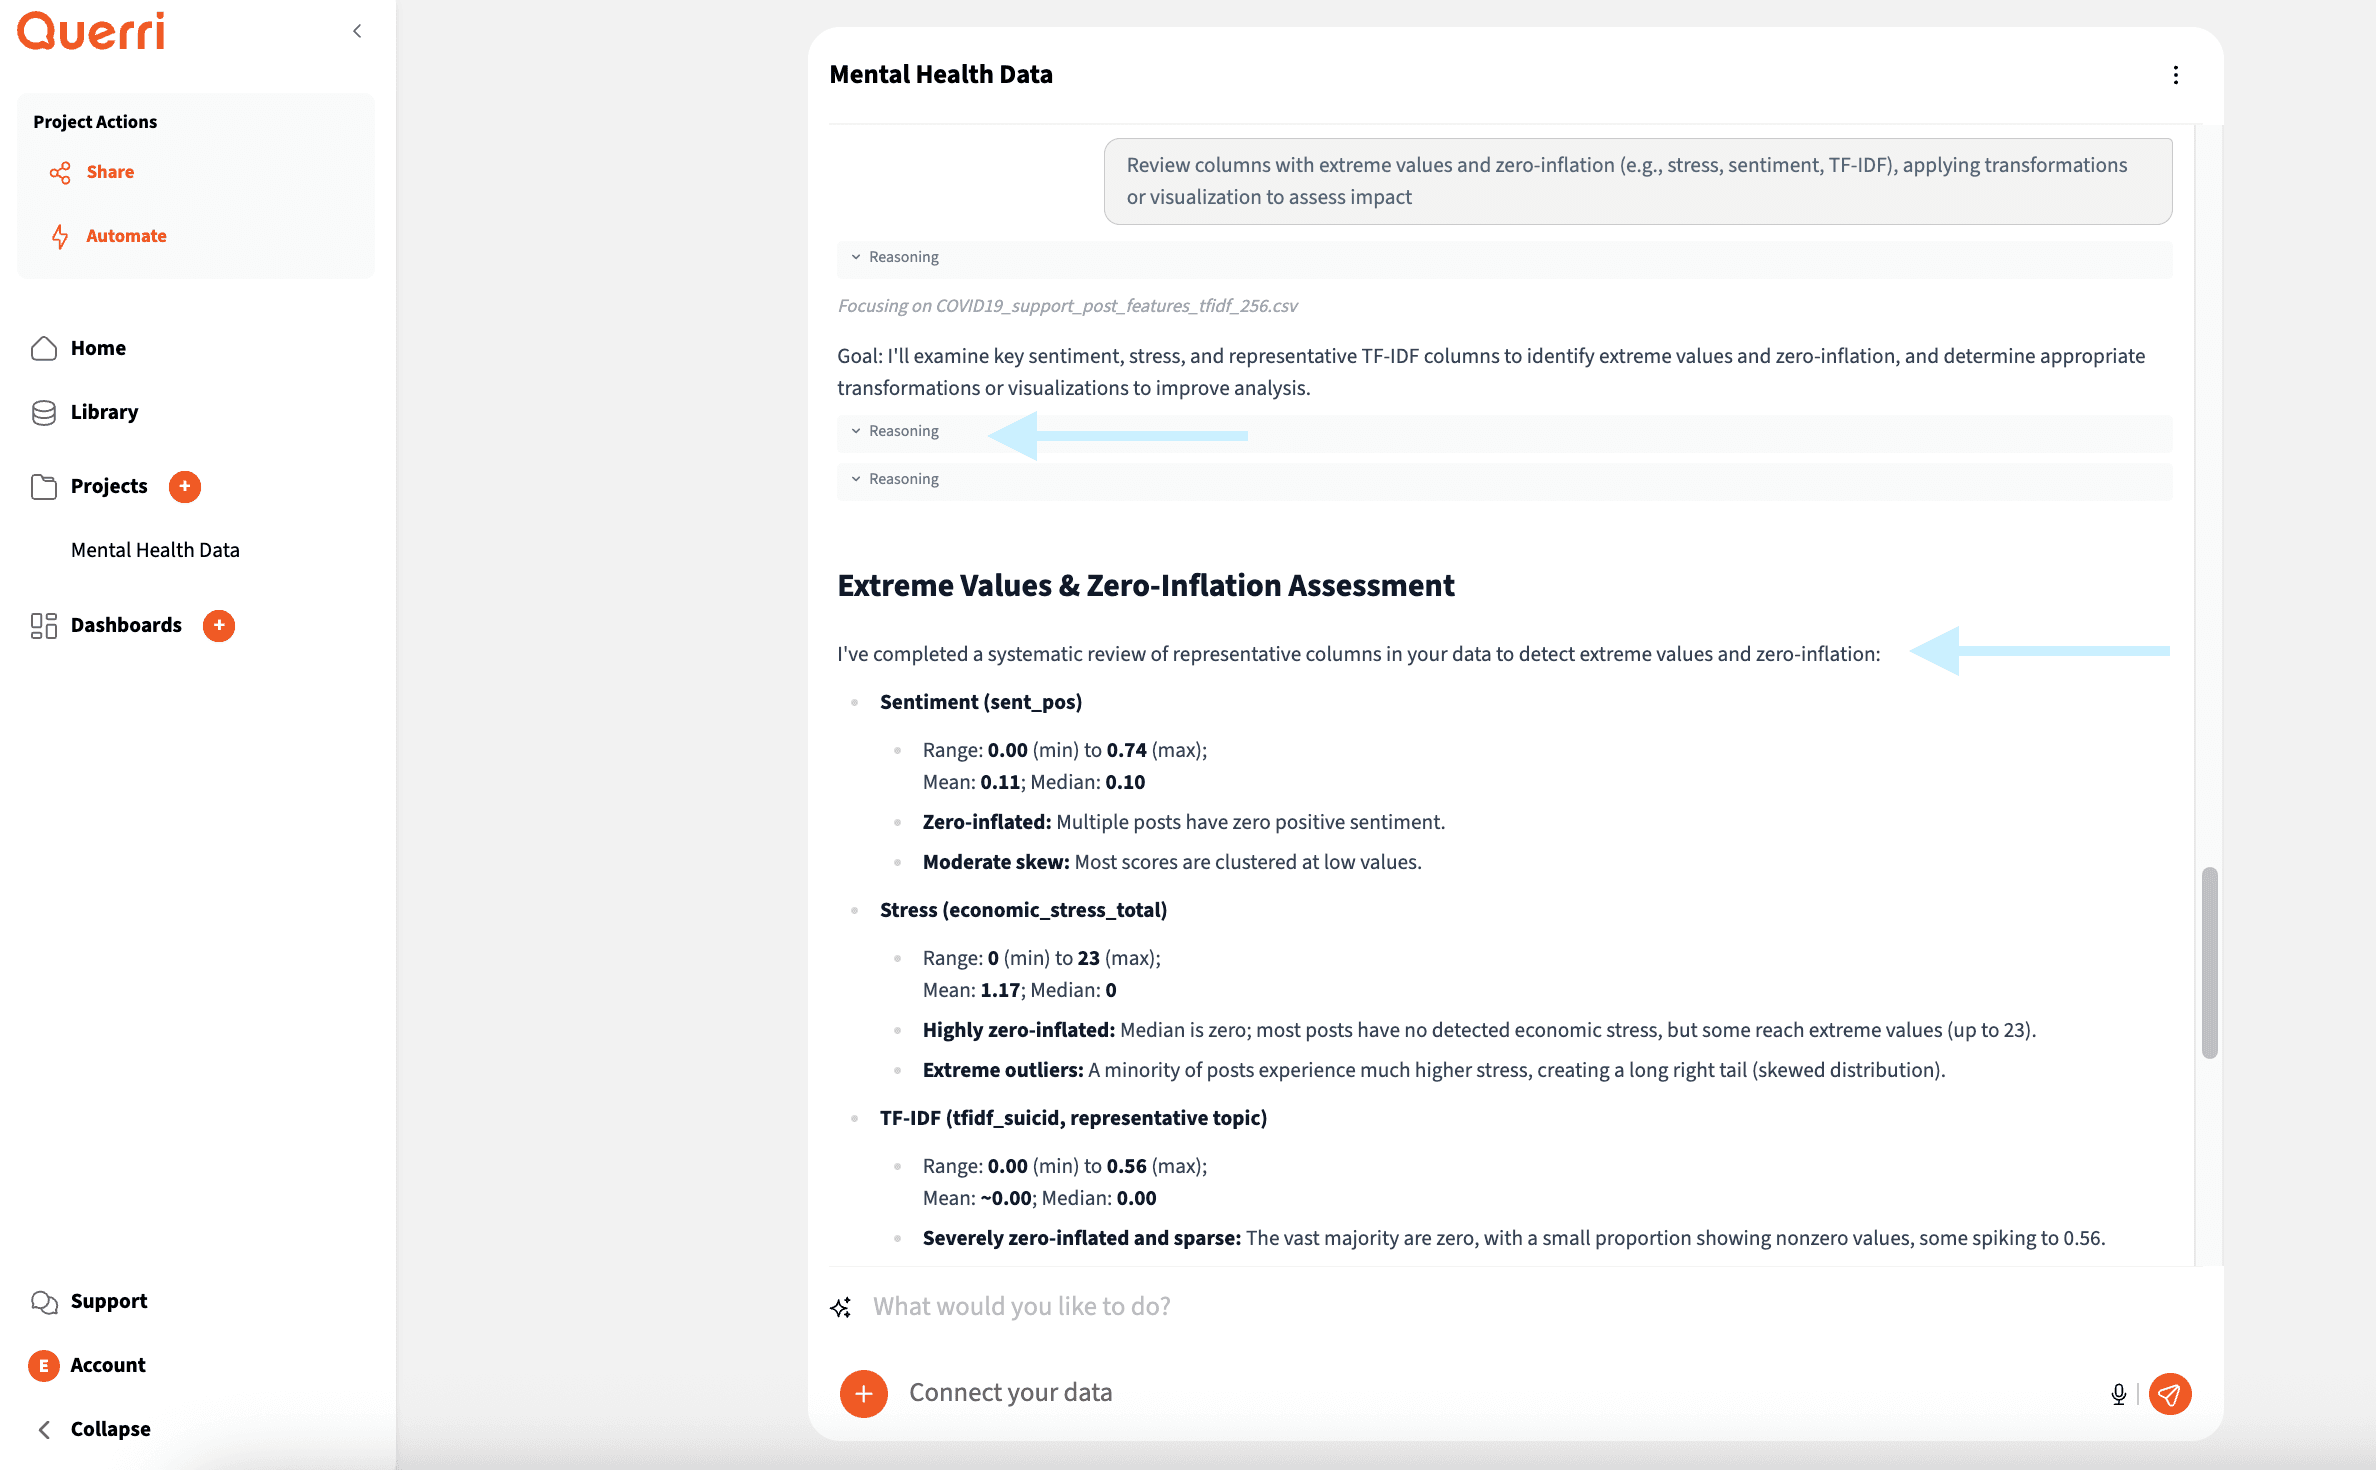

Click on Reasoning to See Transformation Steps
Want to understand how Querri processes your data? You can click on the reasoning behind any analysis to see the cleaning and transformation steps that were applied. This transparency helps you understand exactly how your data was processed and builds confidence in your results.
What You'll See


Click on Reasoning to See Transformation Steps
Pro Tip: Querri's AI not only suggests data quality improvements but also clearly explains its reasoning, providing transparent and trustworthy insights.
Step 5: Visualize & Export
Create charts and export your results
Ready to see your data come to life? Querri creates beautiful charts and graphs automatically when you ask it to visualize your data. Simply say something like "Show me a chart of sales by month" or "Create a graph of customer satisfaction scores" and Querri will generate the perfect visualization for you.
You can also ask for specific types of visualizations - whether you want bar charts, line graphs, pie charts, or scatter plots. Querri's AI understands what works best for your data and suggests the most effective way to present your insights.
What You'll See
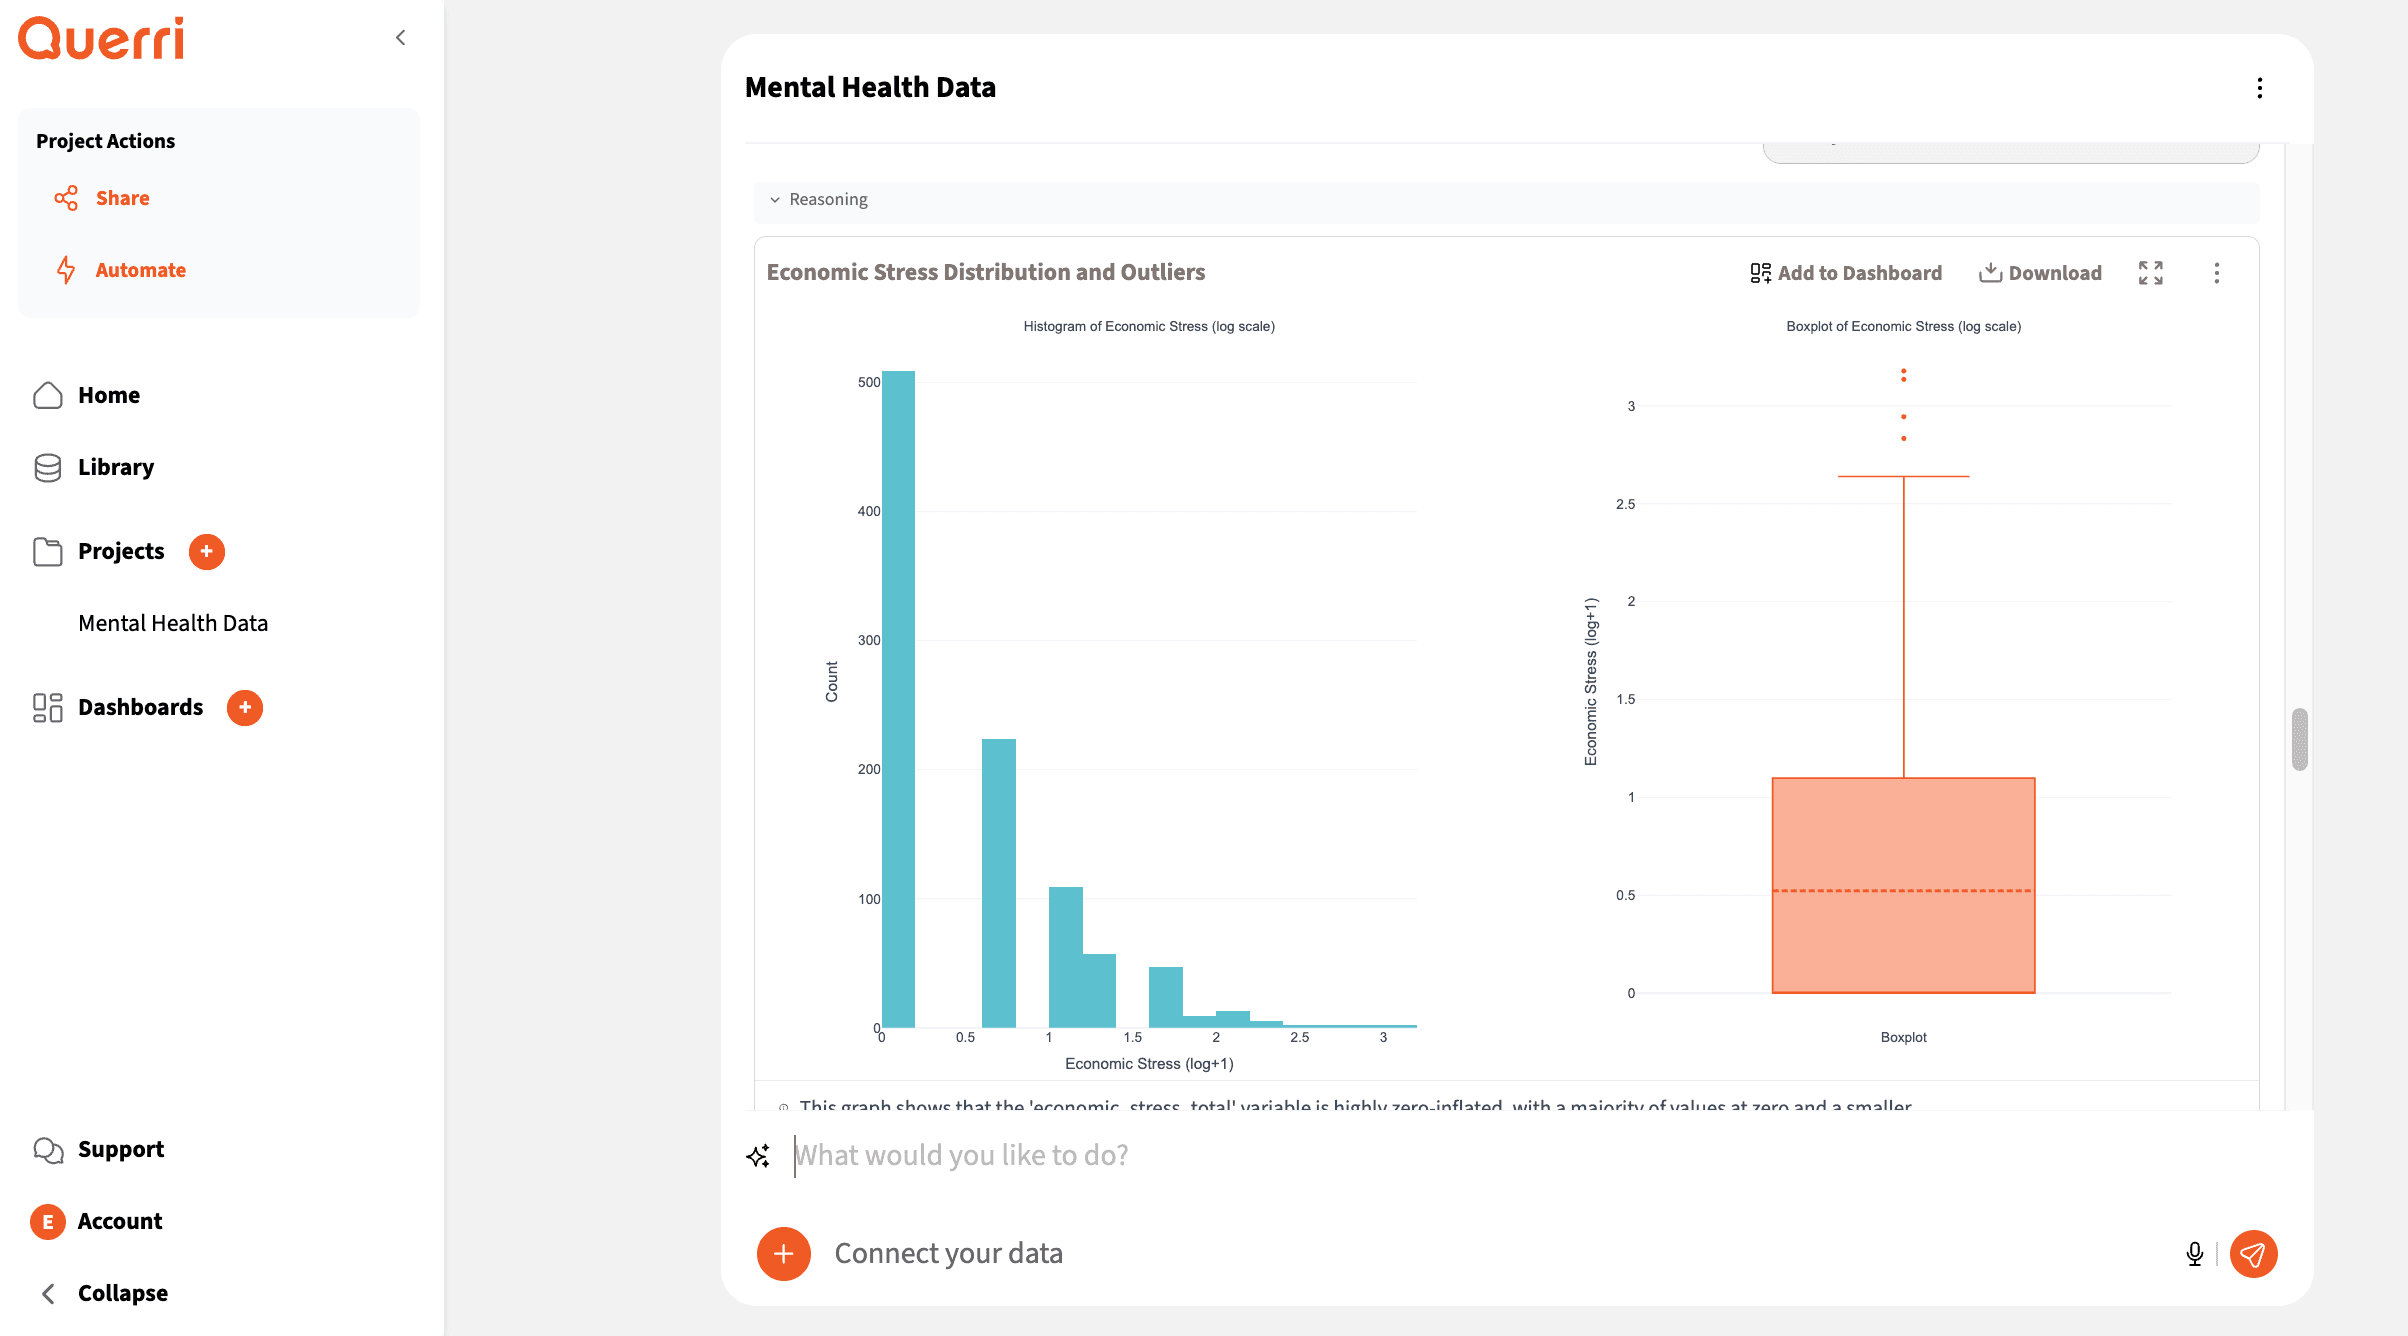

Automatic Data Visualizations
When you're ready, share your work with ease - export charts as images, download cleaned data files, or share entire projects with your team.
Make sure the team member with whom you would like to share has been added to Querri by your admin. Alternatively, you can generate a publicly shareable link that can be shared with anyone, even with those outside your organization.
What You'll See
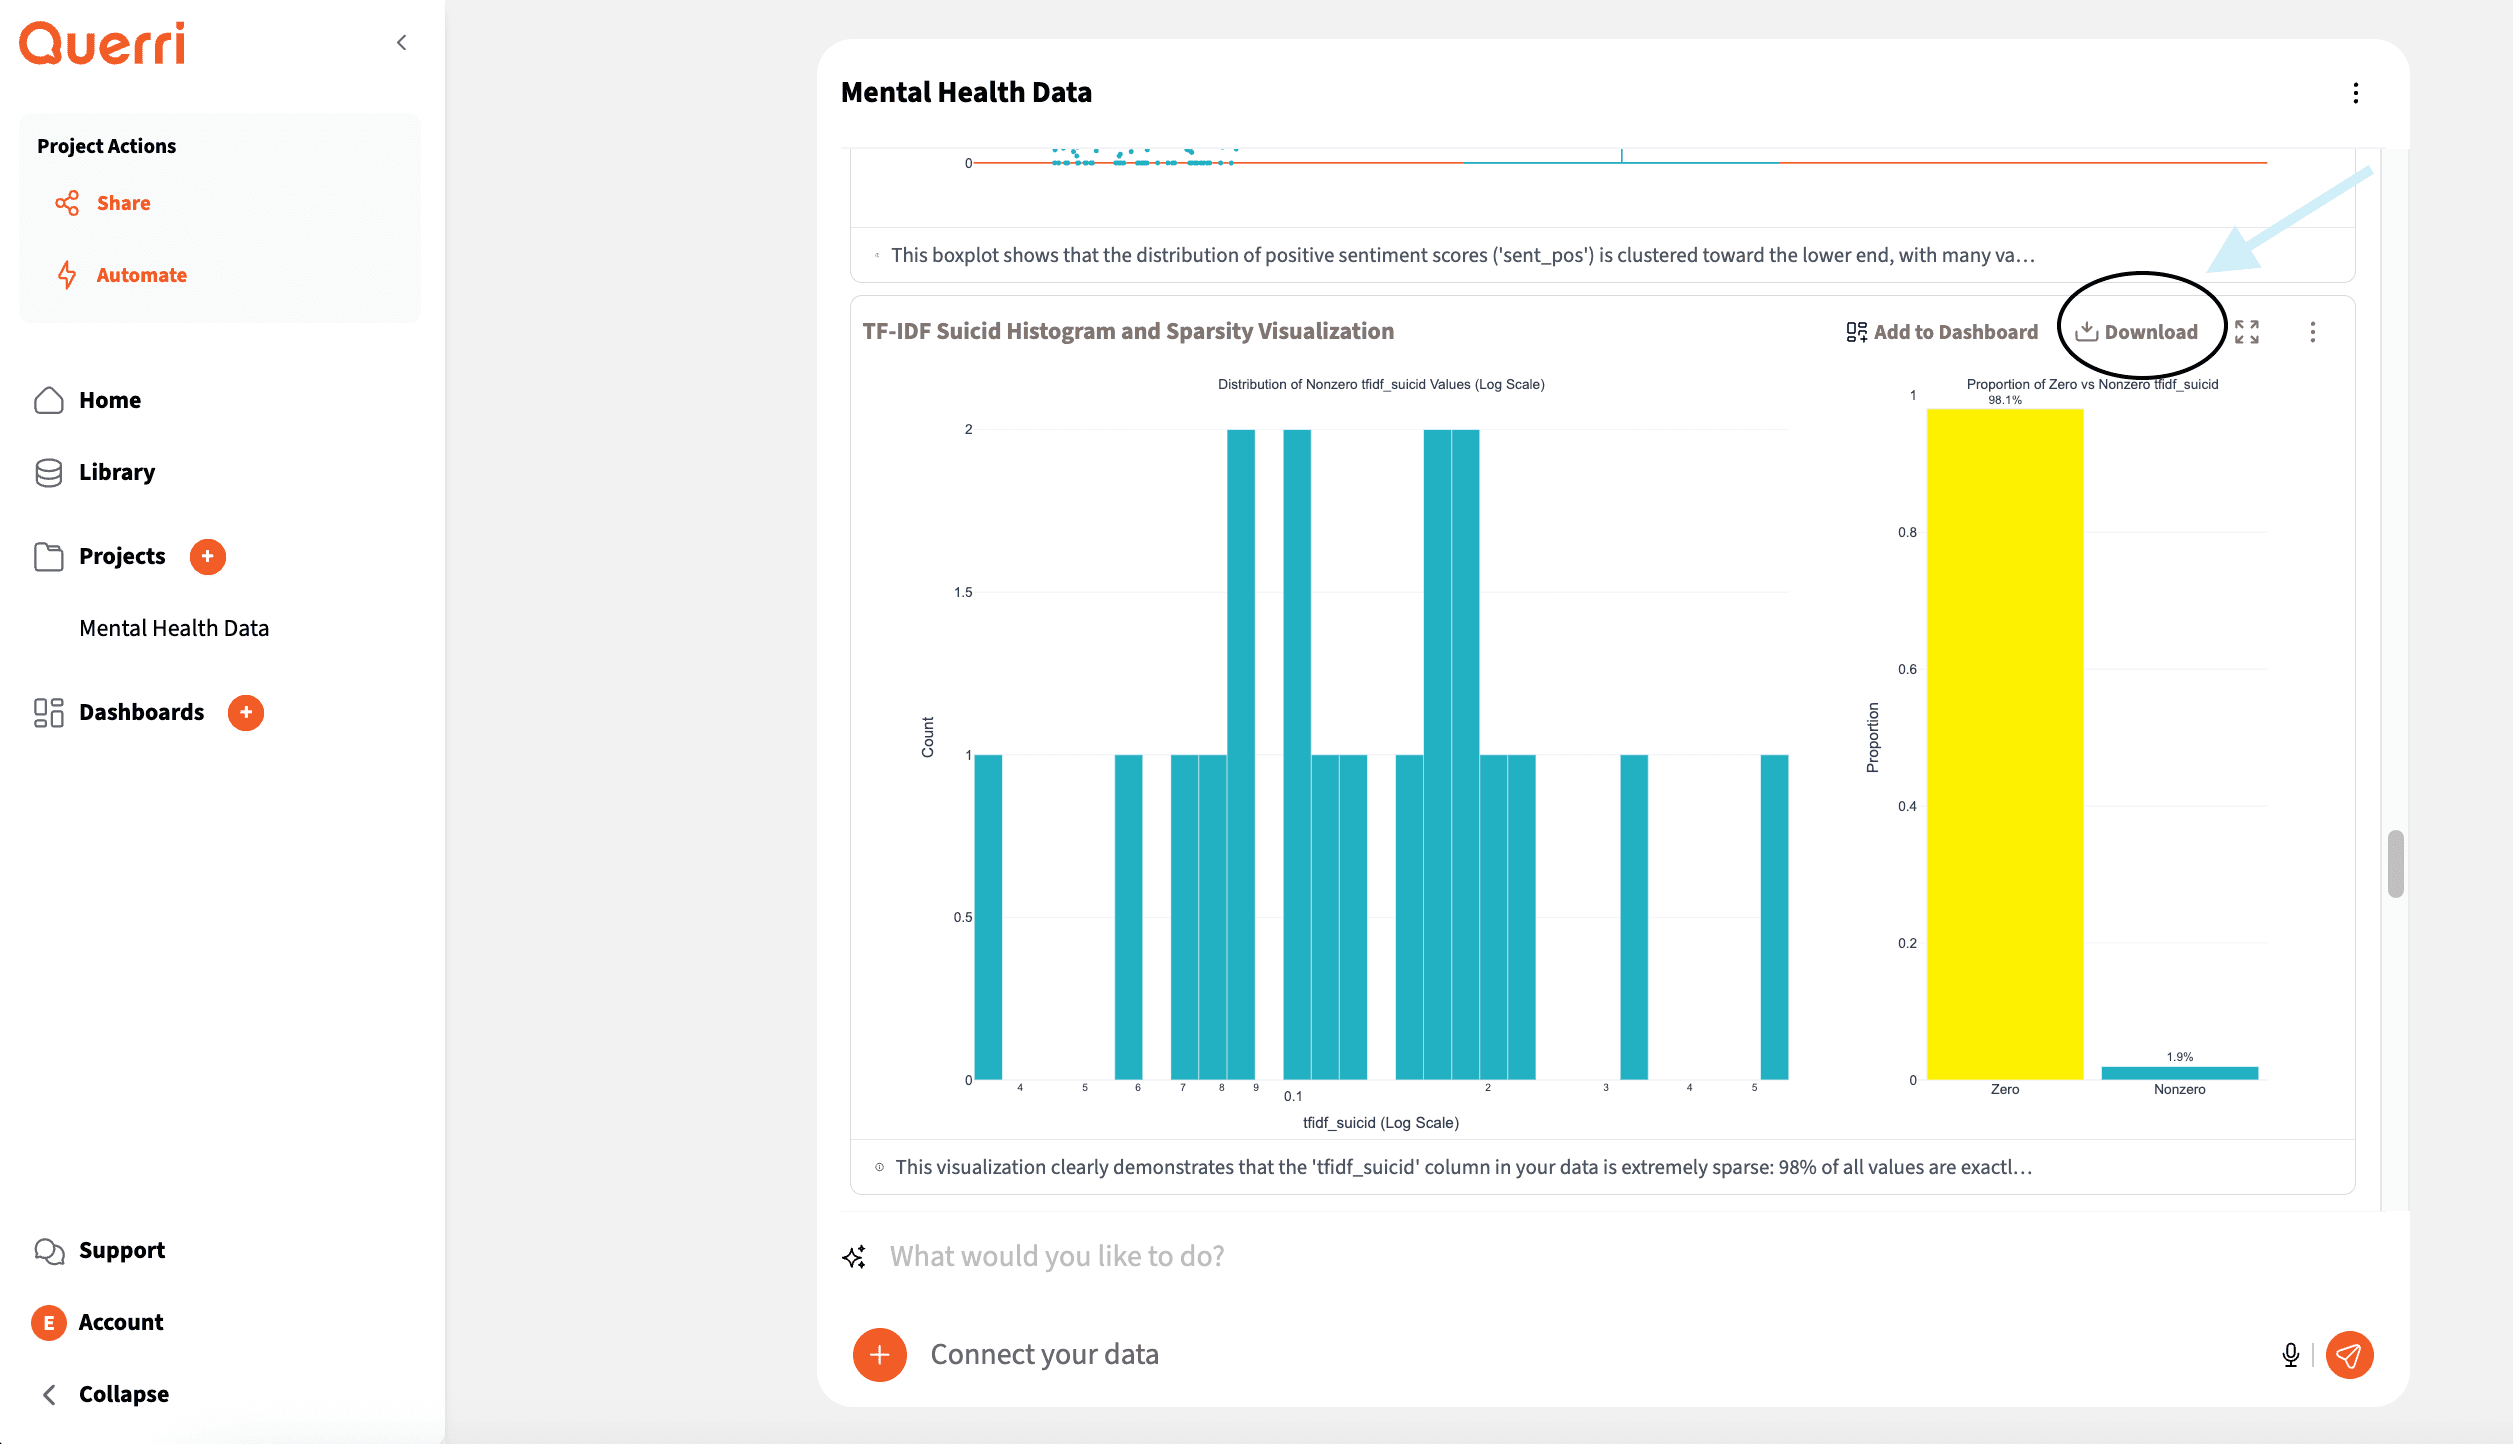

Download Charts & Images
What You'll See
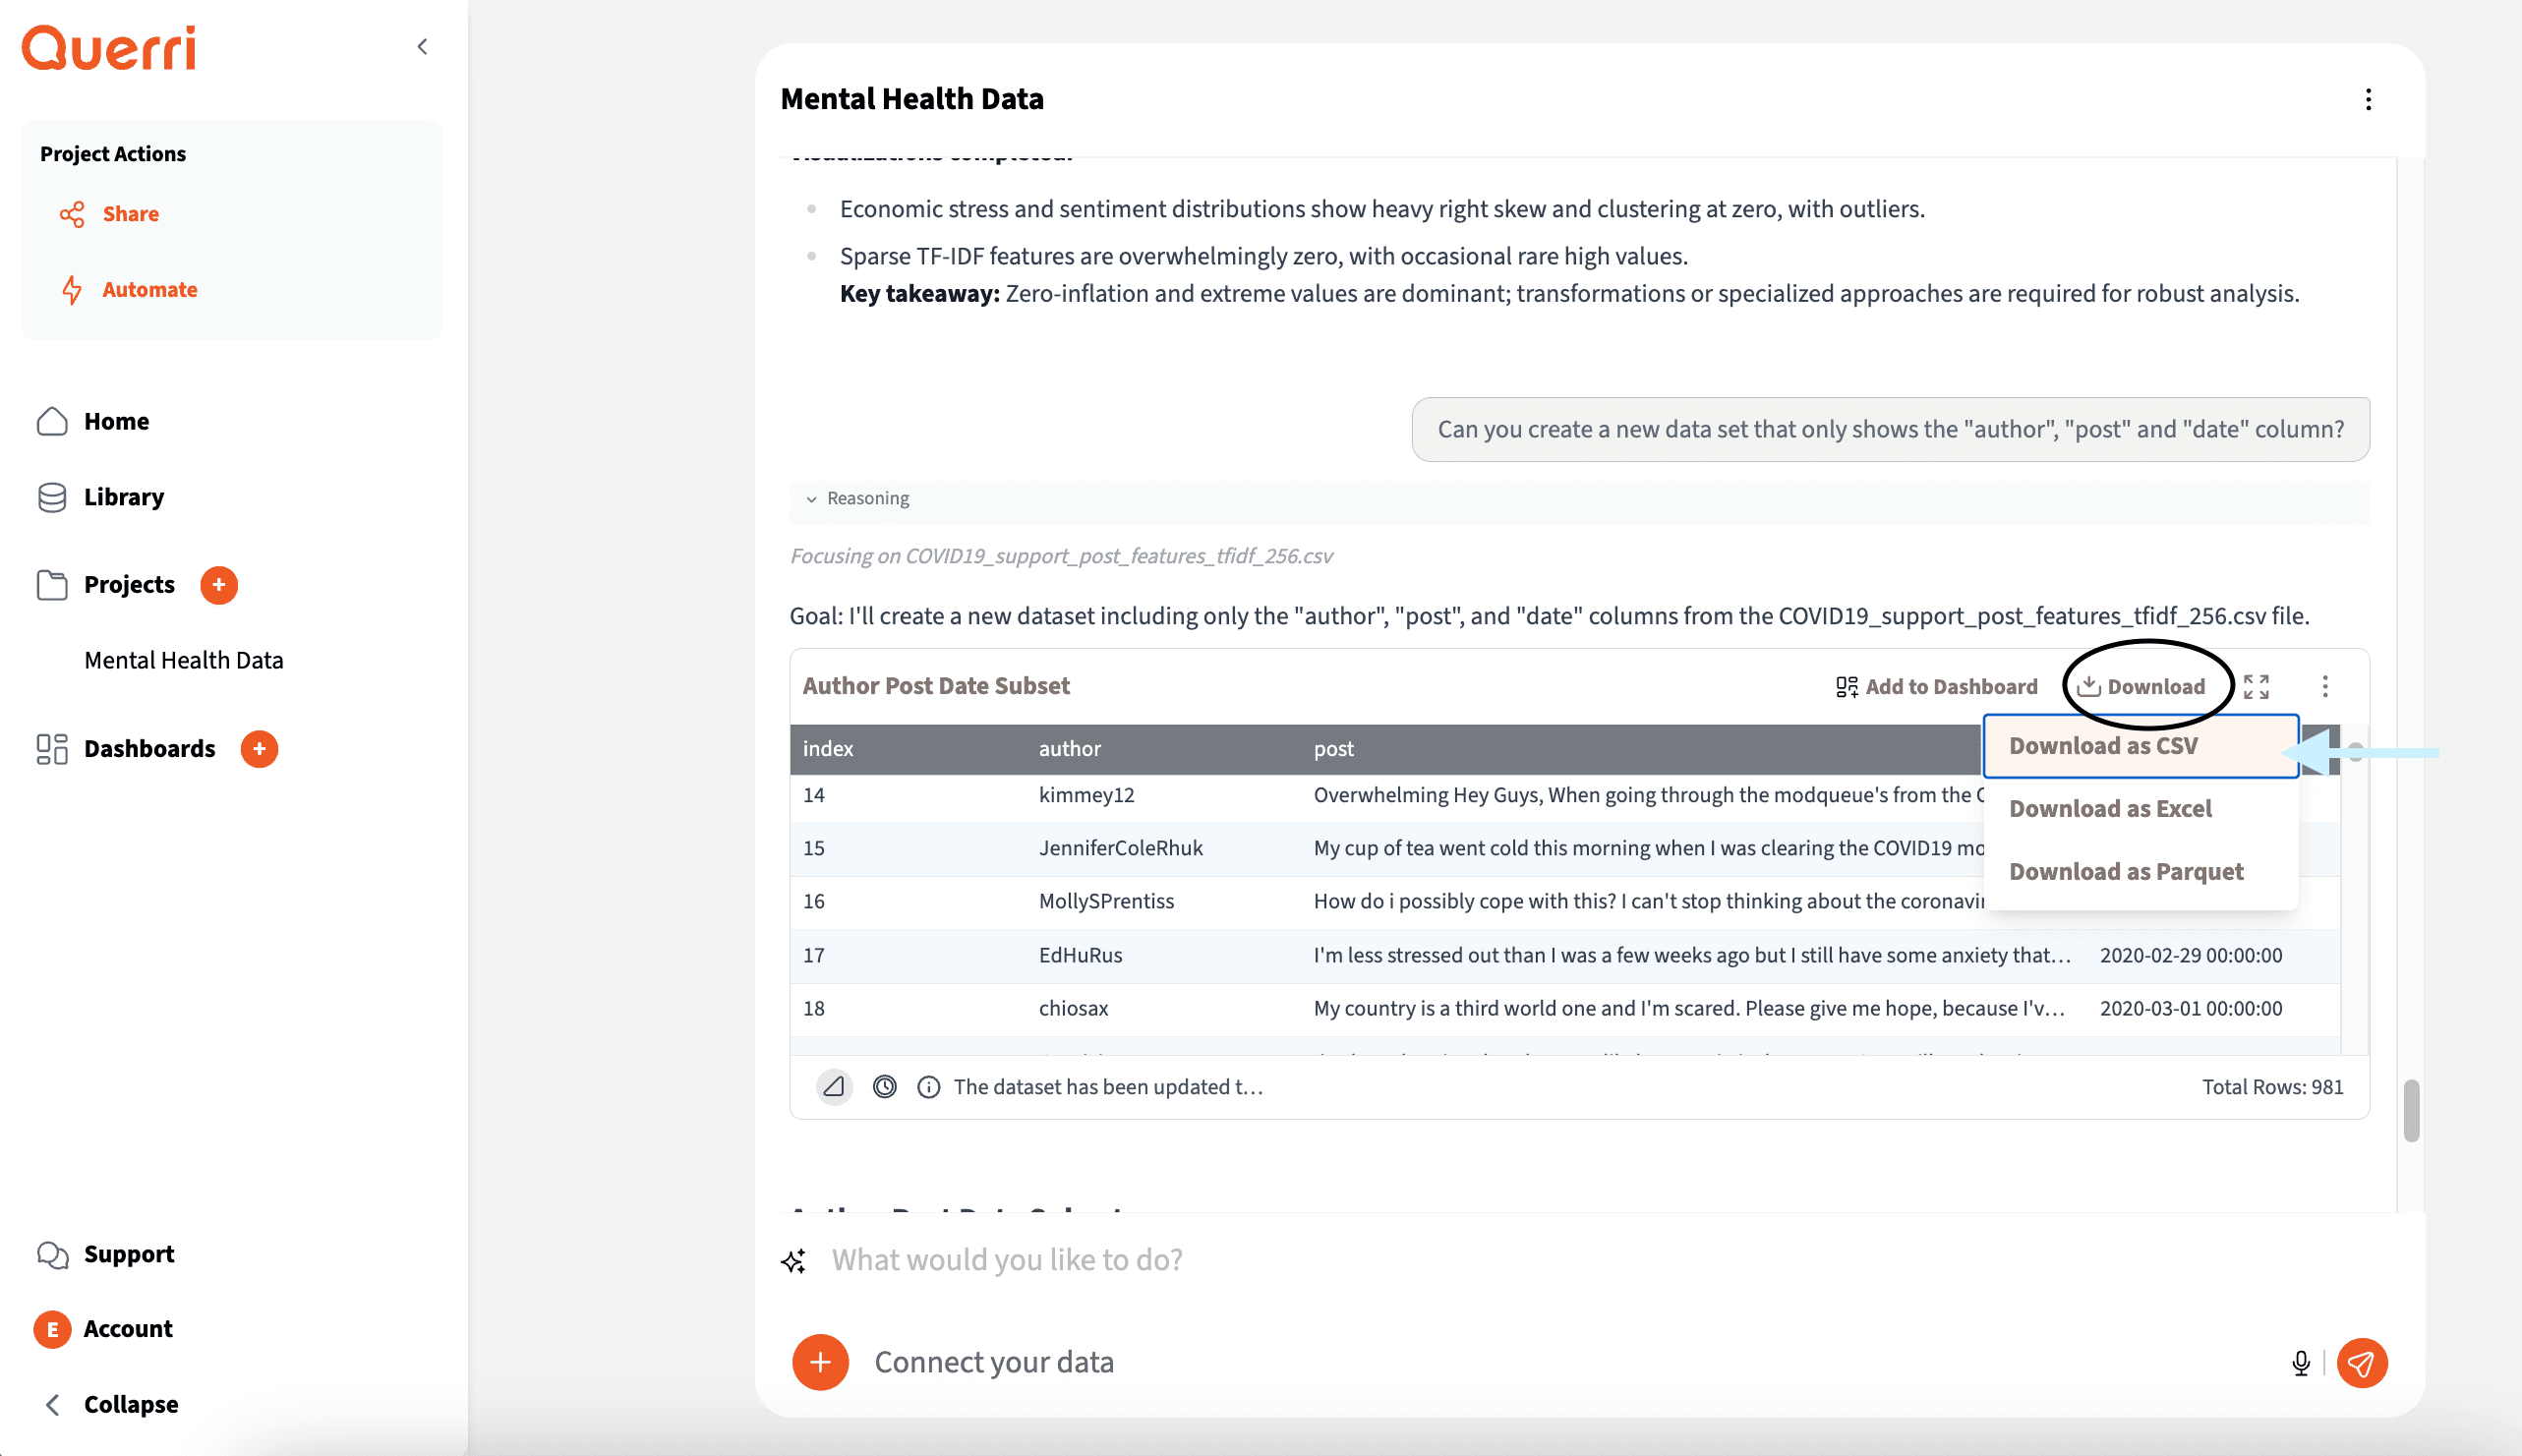

Export Data as CSV, Excel, or Parquet
What You'll See
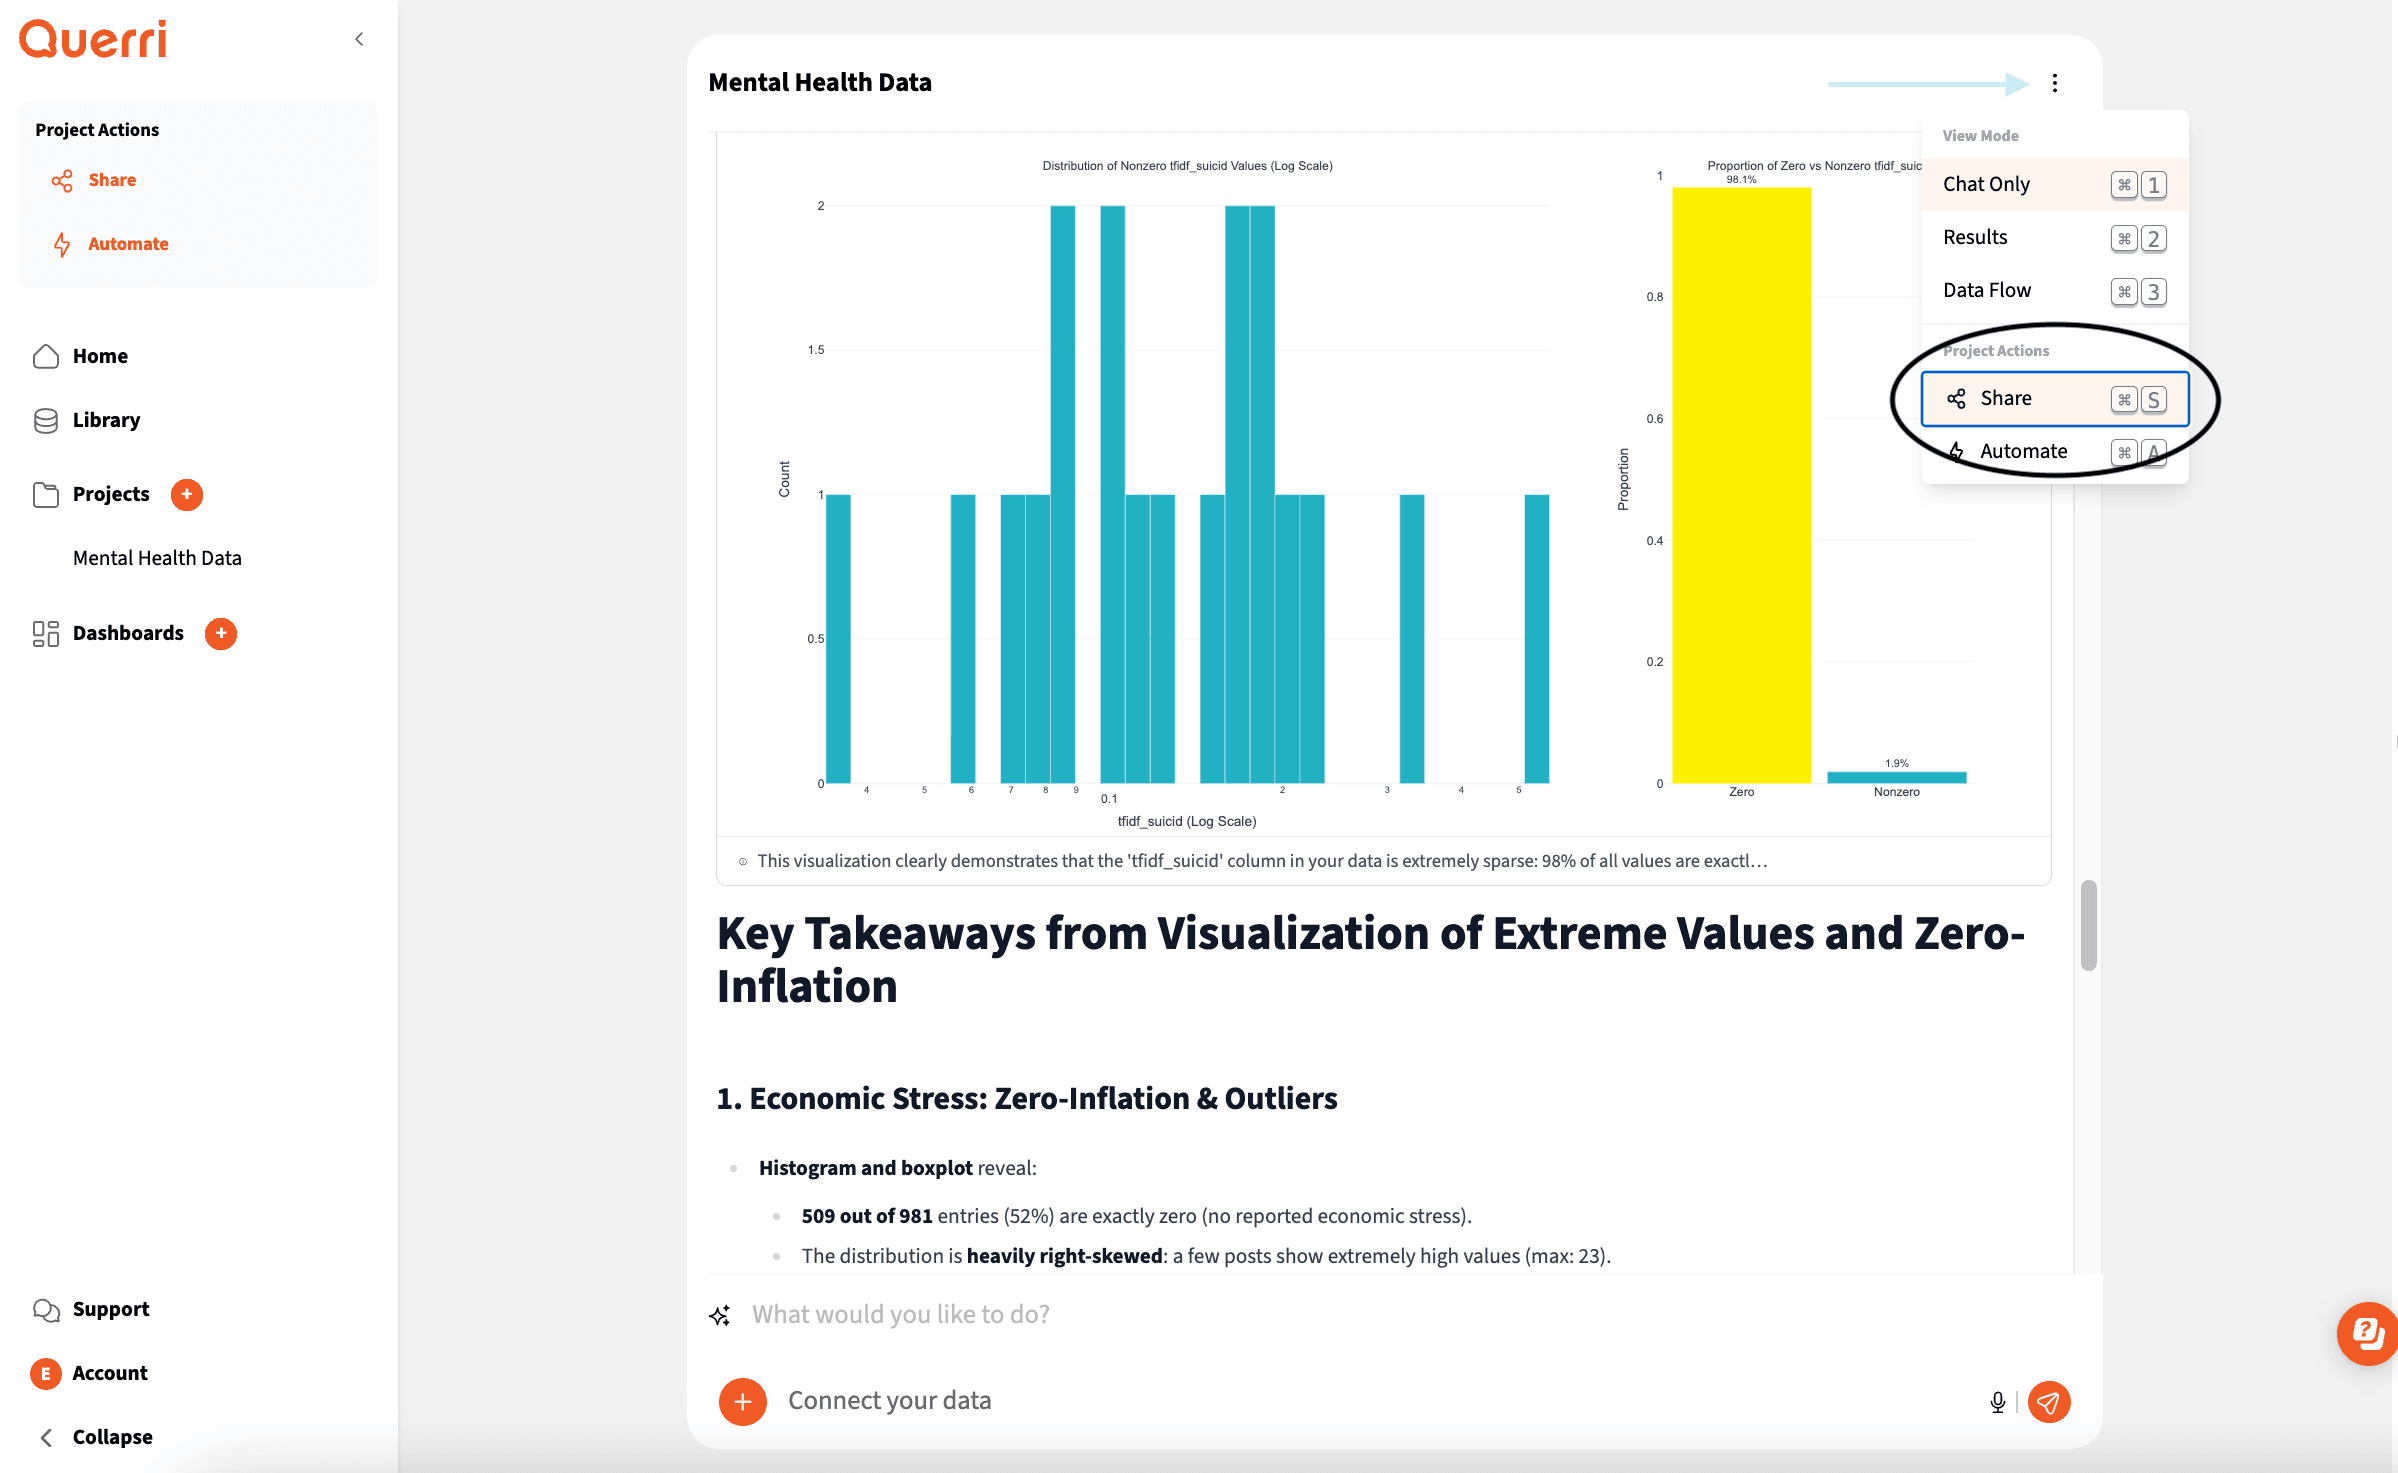

Share Your Project
Export Options
Download your charts as high-quality images for presentations and reports. Export your cleaned data as CSV, Excel, or Parquet files for use in other tools. Share your entire project with team members so they can see your analysis and continue the work.
No credit card required • 14-day free trial
Pro Tip: You're all set! You now know the basics of using Querri. Start exploring your data and discover insights that can transform your business decisions.