Solutions Built for Your Team
Every team has unique data challenges. Querri's agentic data platform adapts to your specific needs, terminology, and workflows to deliver insights that drive revenue and growth.

Revenue Operations
One definition of pipeline, bookings and conversion across the CRM, marketing, billing and the books, so sales, finance and the board read the same numbers.
Customer Success
Usage, renewals, tickets and revenue joined on the customer, so your team sees who needs attention and shares one retention number with finance.

Finance & Accounting
Actuals, budget, billing and the CRM read together, with one definition of revenue, margin and variance and every number traced to the ledger.
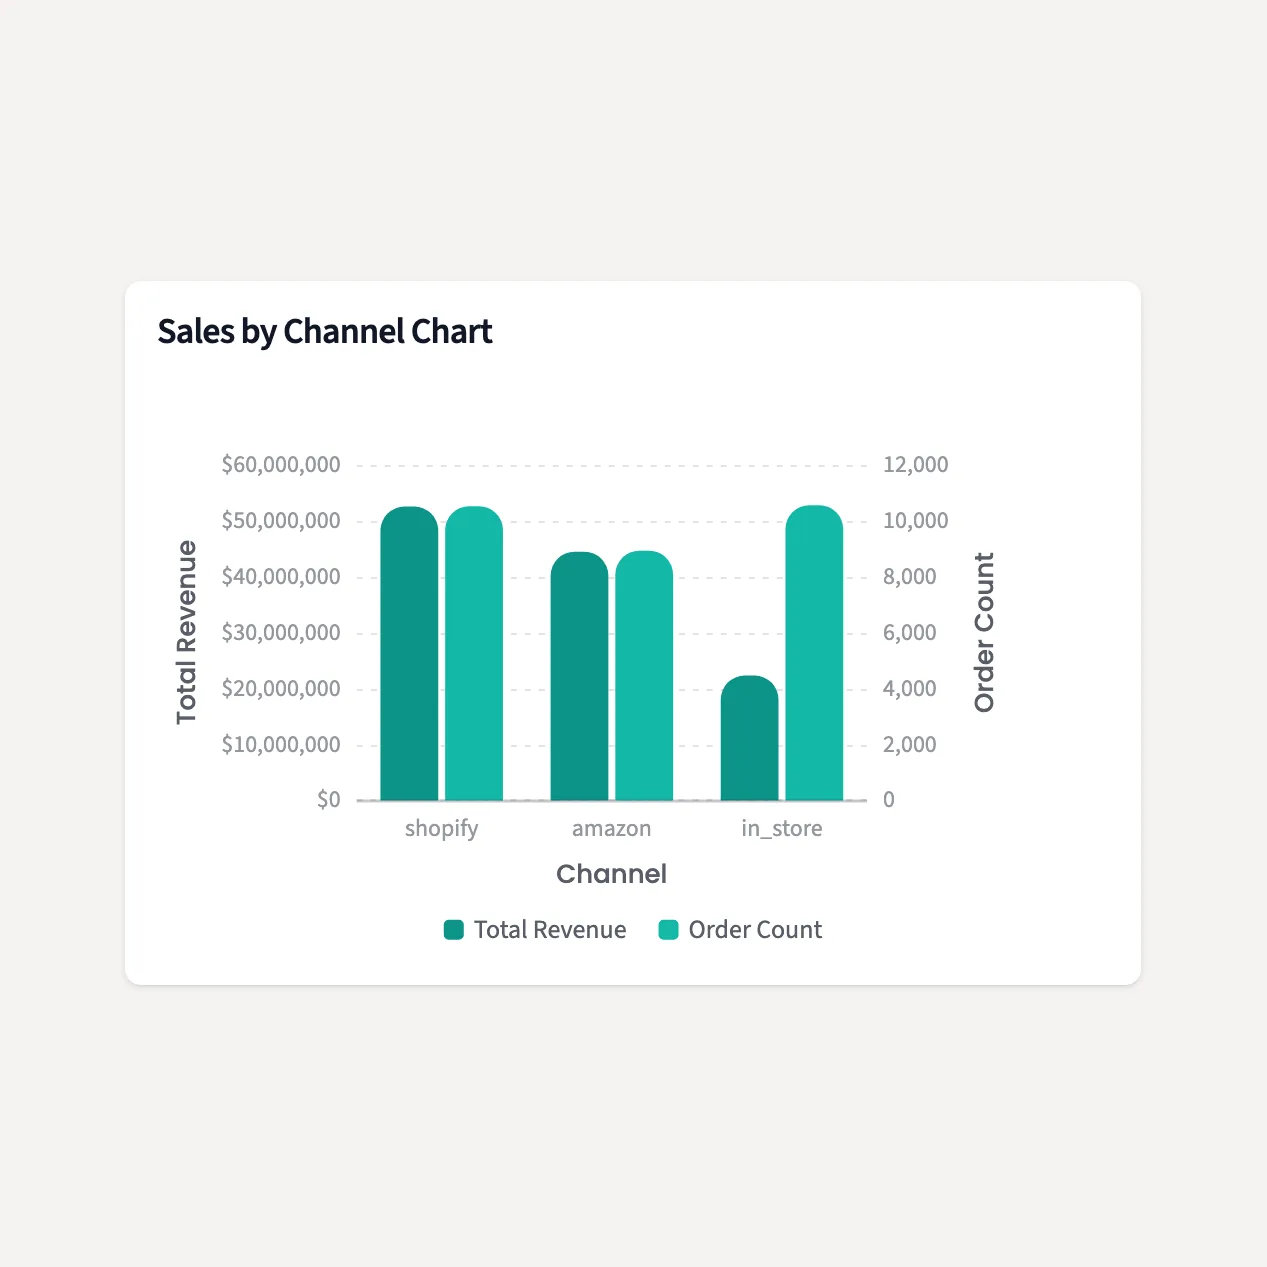
eCommerce & Multichannel Brands
Shopify, Amazon, wholesale and retail in one place: margin by SKU and channel after fees and ad spend, sell-through, stock cover and the numbers your accountant closes on.
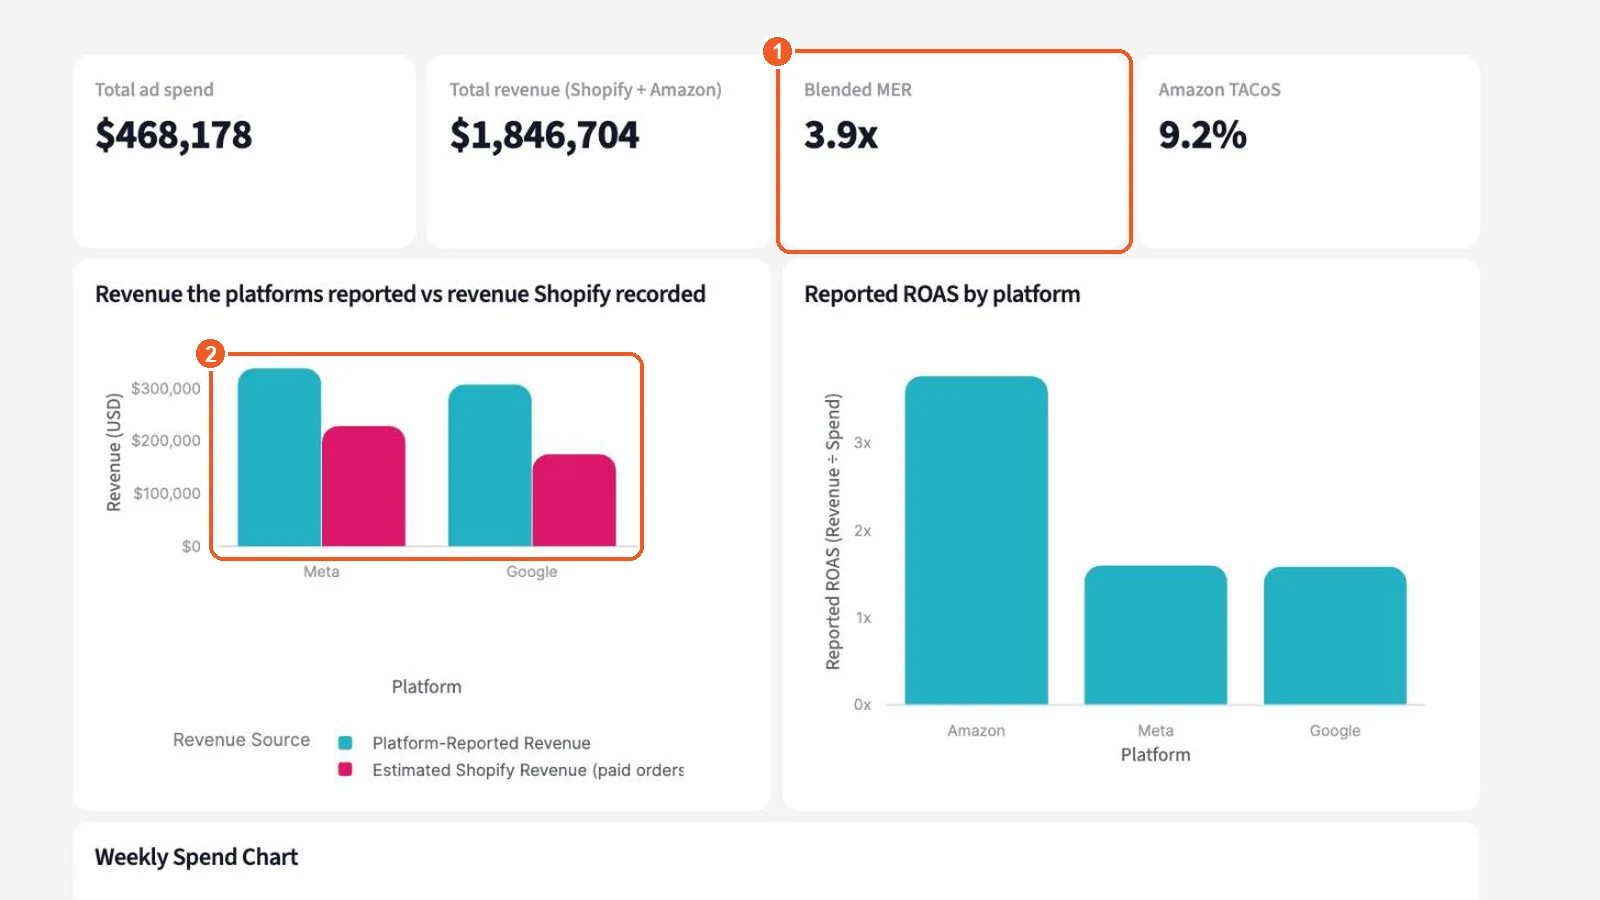
Advertising for Brands & Agencies
Ad platforms like Meta, Google and Amazon Ads beside your store and marketplace sales: blended ROAS, MER and TACoS worked out from what you actually sold, for brands and the agencies that run their ads.

Consultants & Agencies
Deliver data-driven insights to clients 50% faster and differentiate your services with AI-powered analytics and automated reporting.

Nonprofits
Connect outcomes to funding with powerful impact reporting that helps nonprofits demonstrate results and secure more grants.

Manufacturing
Optimize production schedules, predict maintenance needs, and improve quality control with up-to-date manufacturing analytics.

Logistics & Supply Chain
Streamline operations, optimize routes, and forecast demand with intelligent logistics analytics that cut costs by 30% and improve delivery times.
In the app
The same Querri behind every team
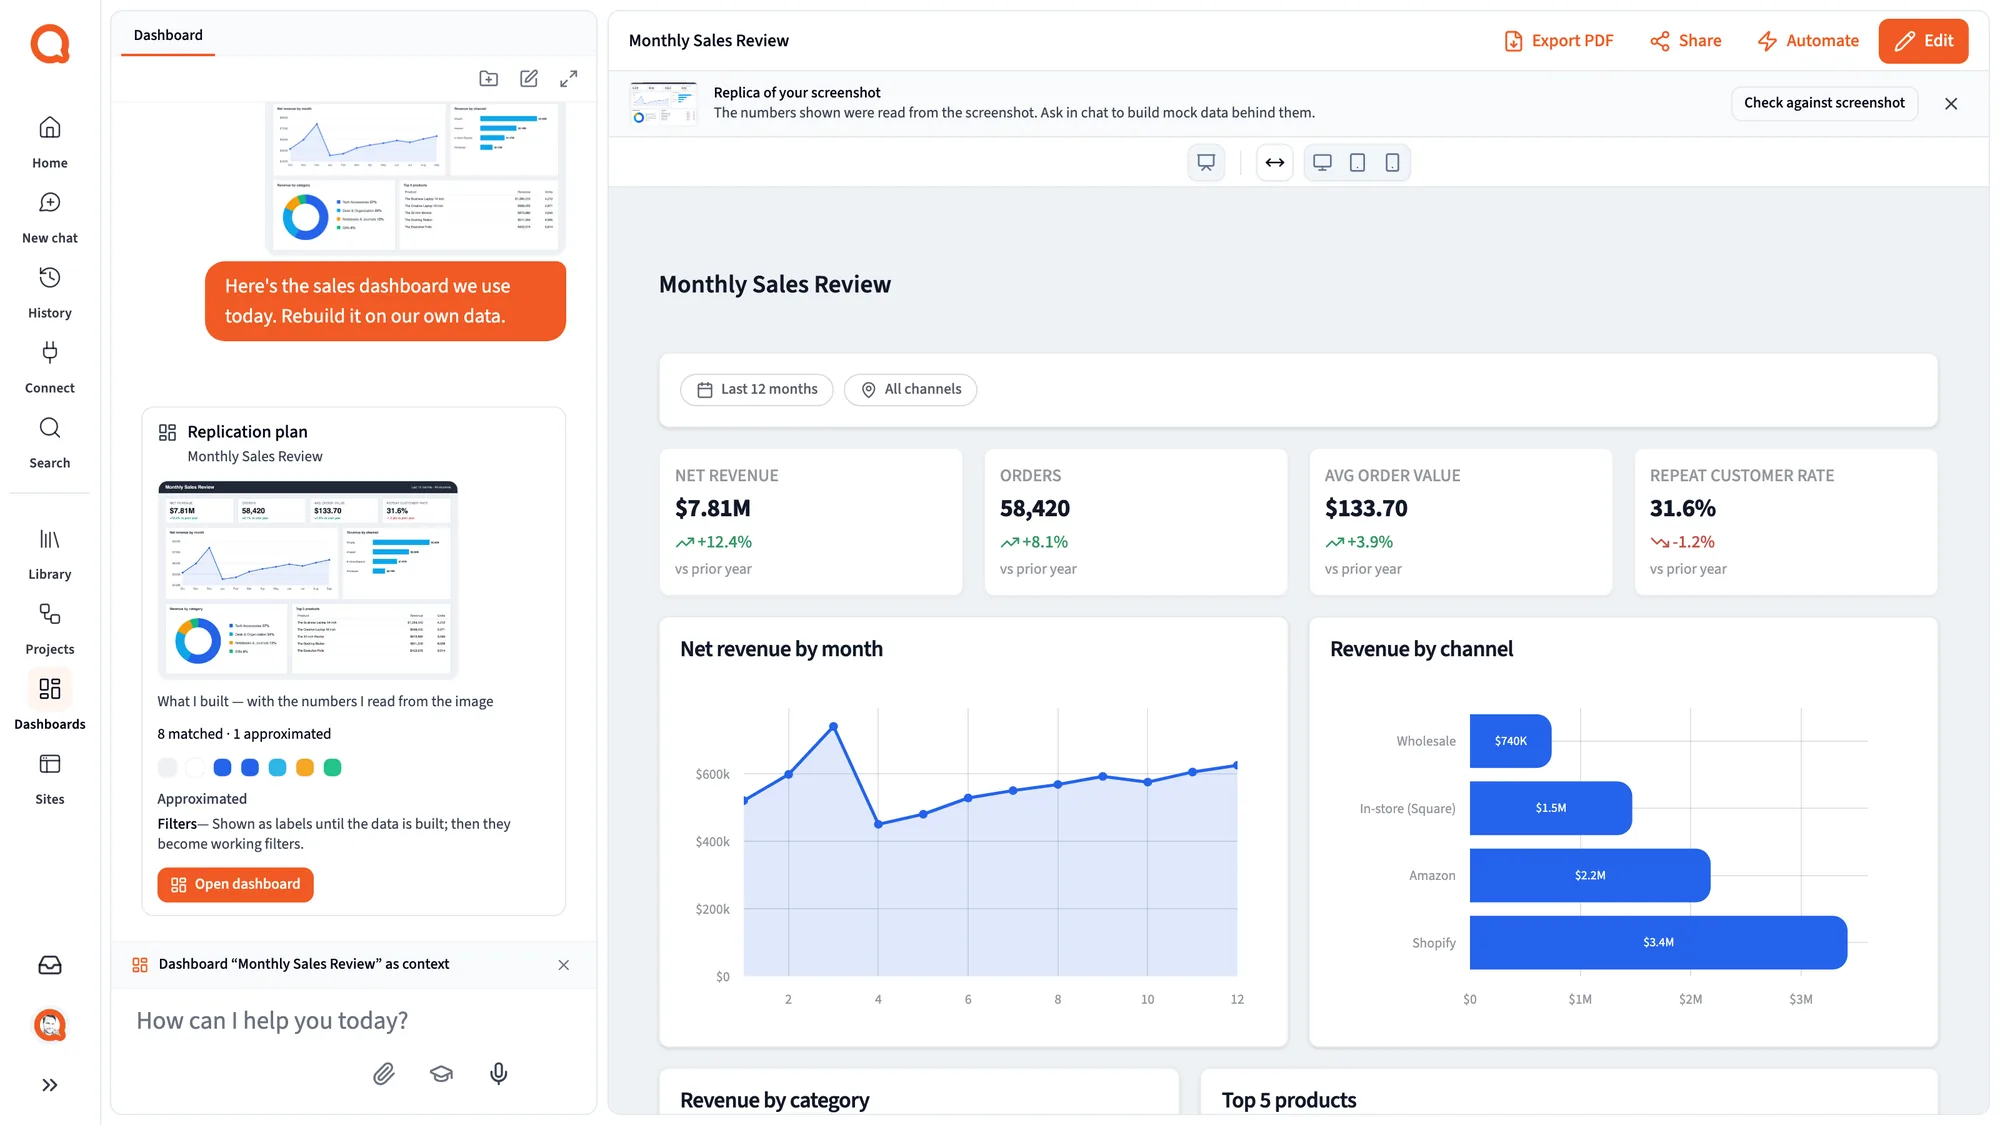
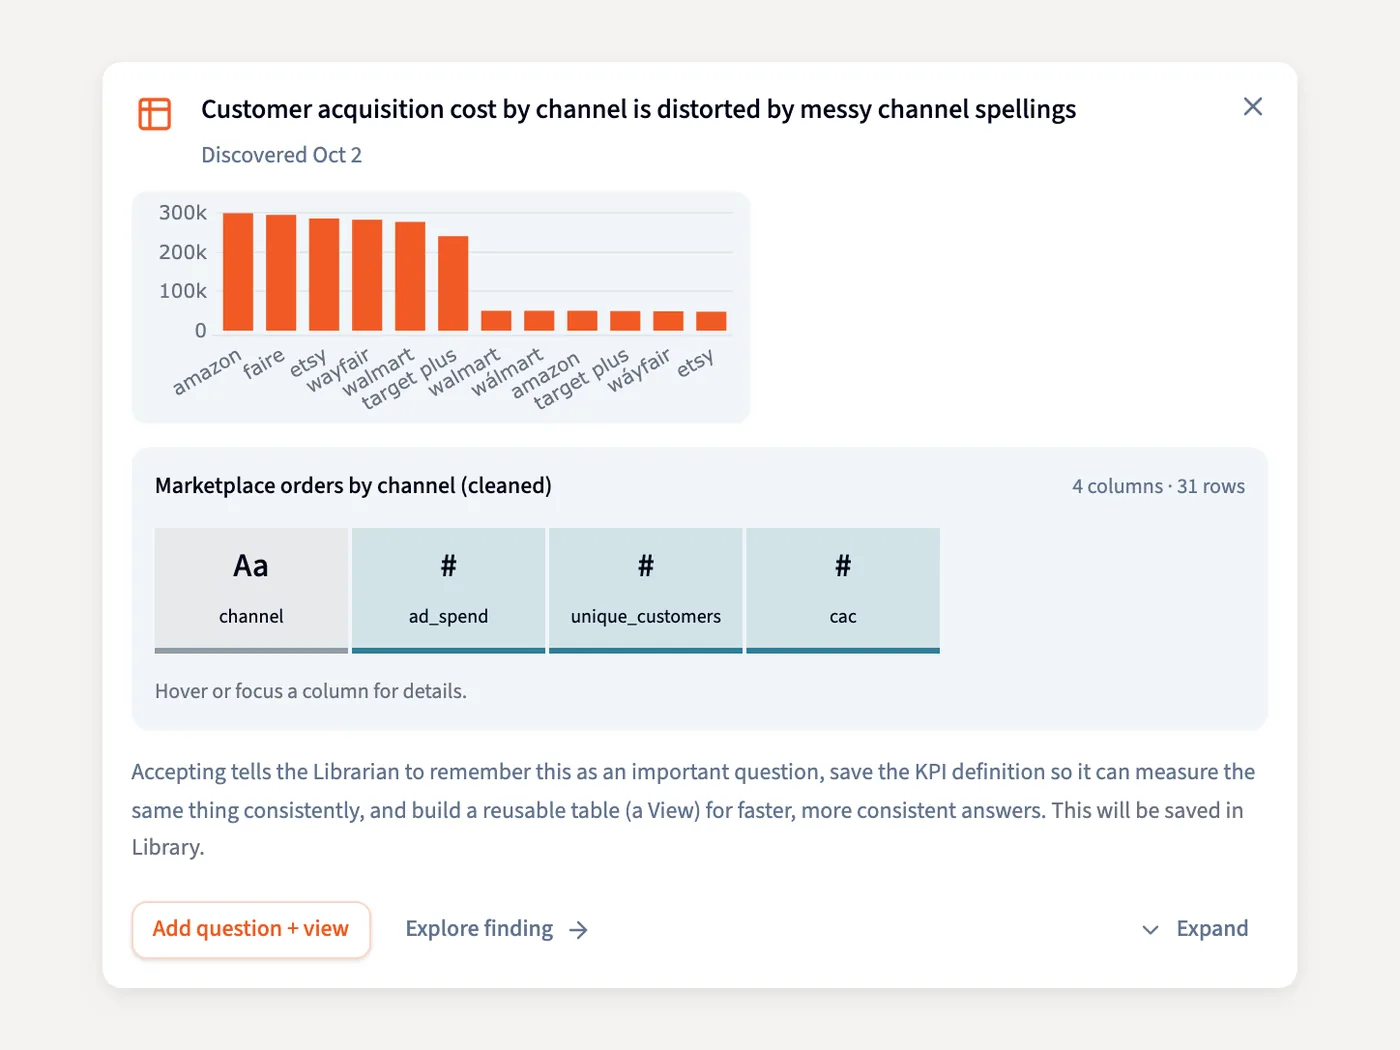
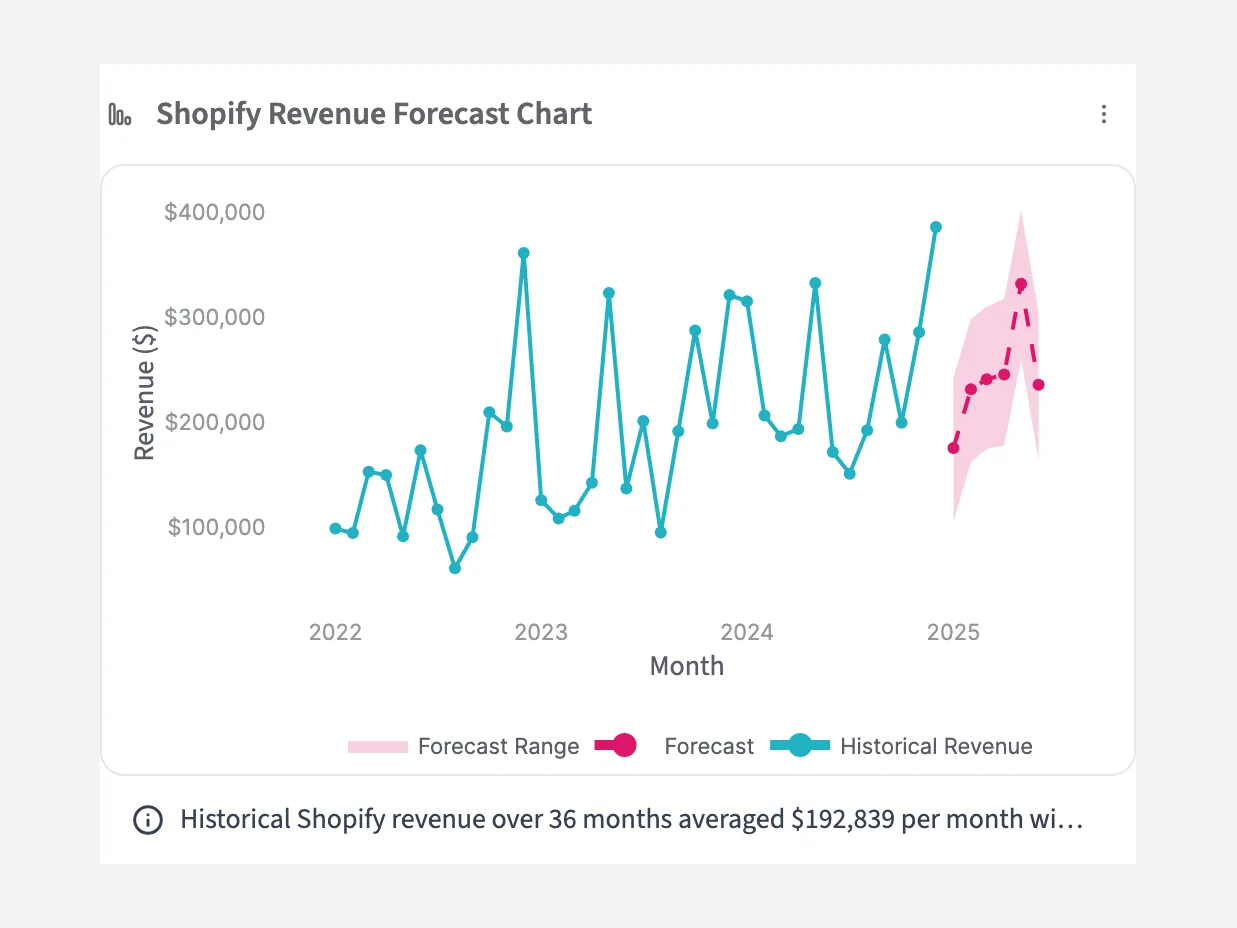
These are screenshots of Querri with a demo company's data: a dashboard rebuilt from a screenshot, a data problem caught before it skews a number, and a forecast with its range.