Querri for Demand Forecasting Cut costs, reduce surprises and stay ahead in logistics
Demand planning breaks down when sales history, stock levels and shipments sit in different systems and the forecast lives in one person's spreadsheet. Connect those systems or upload the exports, and Querri forecasts demand from your own history with a range around each prediction. Schedule it, and the forecast updates as new orders come in.
See a Logistics Project in Querri
This walkthrough comes from the Shippers Tendering Less playbook. It compares each shipper's load volume with its usual pace to catch a drop in demand early. A forecast uses the same connected data and the same kind of steps.
What Makes Logistics Forecasting So Hard?
Demand in logistics moves with seasons, promotions, supply disruptions and shifts in customer behavior. A spreadsheet forecast usually rests on last month's export and a simple trend line, so it misses those shifts until they have already cost money.
The inputs are also scattered. Orders are in the store or the ERP, stock levels are in the warehouse system, and lead times are in someone's inbox. Pulling them together takes long enough that the forecast is out of date when it is finished.
The result is too much stock of slow-moving items, stockouts on the products customers want, and carrying costs you could have avoided.


Forecasting with Querri Makes It Easier to Act Early
Connect your sales, inventory and shipping systems, or upload the files, and ask a question like "What's my expected demand next month by SKU and region?"
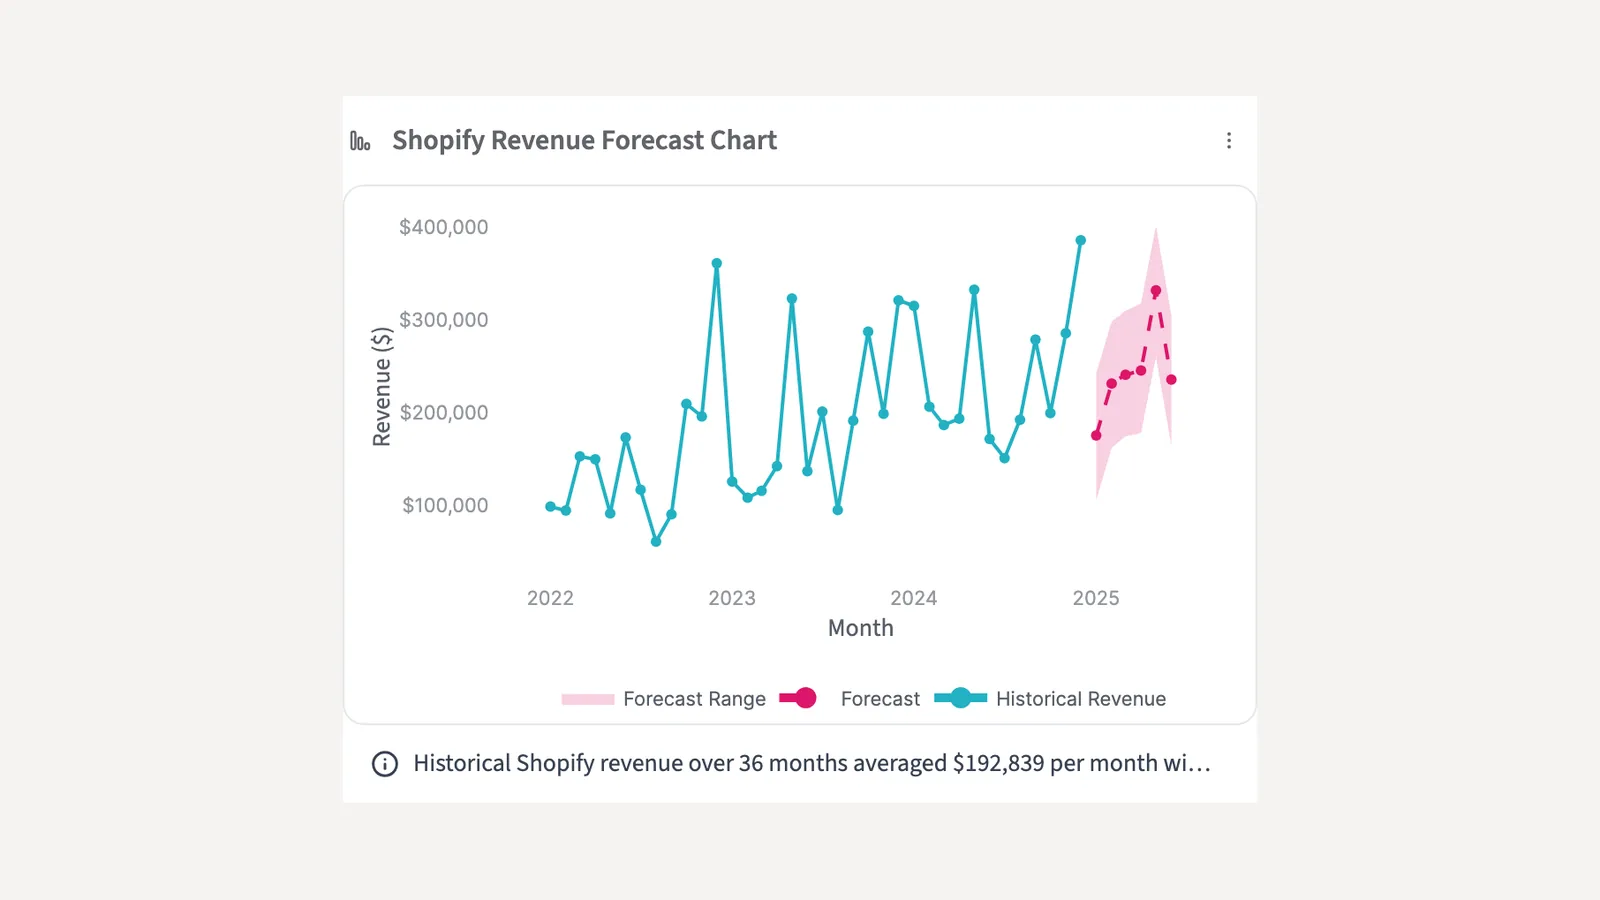
Querri builds the forecast from your own history. It picks a forecasting method that suits your data, and returns a table and chart with a low and high estimate around each prediction. You can forecast each product, region or warehouse separately in one request, and Querri tells you when a group doesn't have enough history to forecast.
The forecast is saved as steps in a project. Run it again next week and the same steps replay on the latest orders, so you spot a spike or a slowdown while there is still time to act.
Business Outcomes of Better Forecasting
Demand predictions with a low and high estimate
Fewer stockouts and lost sales
Less cash tied up in slow-moving stock
Forecasts by product, region or warehouse in one request
A forecast that updates itself as new orders arrive
Earlier warning of spikes and slowdowns
How-To in Five Simple Steps
1 Connect Your Data Sources
Connect your store, ERP, warehouse or shipping system from 125+ connectors, such as Shopify, NetSuite or ShipStation, or upload sales history and inventory files. The forecast needs a date and the number you want to predict. Querri checks each table as it arrives, so gaps and duplicates in the history show up before they skew a forecast.
2 Define Your Forecasting Scope
Decide what to forecast, how to group it and how far ahead: by product, region, warehouse or customer segment, in weeks or months.
3 Ask Forecasting Questions
Use prompts like: "Forecast weekly orders by product type for the next 12 weeks" "Which regions are forecast to grow the most next quarter?" "Compare forecast demand with current stock for our top 10 SKUs" "Which SKUs are at risk of a stockout before the holidays?"
4 Review the Forecast and Its Range
Read the predictions, the low and high estimates and the plain-language explanation. Open any step to see the method and the code behind it.
5 Act, Then Keep It Running
Adjust inventory, purchasing or staffing. Then schedule the project so the forecast reruns on fresh data, and add the chart to a dashboard your team checks. Record what counts as demand, such as ordered or shipped units, under Facts and Rules so every planner's forecast uses the same definition.

Best Practices
Bring In More Than Sales History
Join sales with promotions, stock levels and lead times. A forecast that knows about the promotion calendar explains a spike that sales history alone can't.
Forecast at the Right Level of Detail
Start with categories or regions, then go down to single products. Too much detail adds noise, and too little hides the patterns you need.
Account for Lead Times
Factor in supplier lead times and production cycles when you turn a forecast into purchase orders.
Check the Forecast Against What Happened
Each month, compare last month's forecast with actual demand. Because the project replays the same steps, the comparison is like for like.
Let Querri Watch Between Reviews
Nightly Insights works through your data overnight and flags what changed, such as one warehouse sliding inside a healthy total.
FAQs
How far into the future can Querri forecast demand?
What if I don't have much historical data?
Can Querri handle seasonal products or irregular demand patterns?
How does Querri handle new products with no sales history?
Can I get forecasts for specific customer segments or regions?
How accurate are Querri's demand forecasts?
Do I have to upload files each time?
Can I send the forecast to my team automatically?

Step-by-Step Playbooks for This Job
Each playbook walks through one real report: the data to connect, the prompts to use and a recording of the result.
Which Shippers Are Tendering Fewer Loads Than Usual?
Join your Tai load export to HubSpot and your tender allocations in Querri to see which shippers sent fewer loads than usual, who is behind their quarterly allocation, and who nobody has called.
Read playbookRevOpsWhich SKUs Are Out of Stock or Aging, by Channel?
Join Shopify inventory and Amazon's FBA ledger in Querri to see in-stock rate by channel, what to send to Amazon, and stock that has aged.
Read playbookRevOpsWhich Lanes Should Our Sales Effort Go To?
Join your Tai load export to HubSpot in Querri to rank lanes by loads and net revenue per load, find markets that take in more loads than they send, and profile the shippers behind your best lanes.
Read playbookFrom One Forecast to a Planning Routine
A forecast you run once is out of date within weeks. These pieces keep it current without anyone rebuilding it, and give every planner the same numbers.
Connect orders and inventory
Connect your store, ERP and warehouse systems so the forecast always starts from current numbers.
Browse connectorsReplay it on fresh data
The forecast is saved as steps. Each run replays the same code on new orders, so results stay comparable.
How projects workWake up to what changed
Every night Querri works through your data and puts what moved in your Inbox by morning.
Nightly InsightsSend the weekly forecast
Email planners and warehouse managers their own version of the forecast on schedule.
Automated reports