Querri Dashboards:
Data at the Speed of Your Business
Gone are the days of static, complicated dashboards built only for technical teams. With AI data analytics at its core, Querri makes it easy for anyone to create, explore, and automate dynamic dashboards—helping teams move from data to decisions faster.
See Querri Dashboards in Action
Watch how easy it is to create beautiful, interactive dashboards using AI for data analysis—no code, no complexity.
Key Dashboard Features
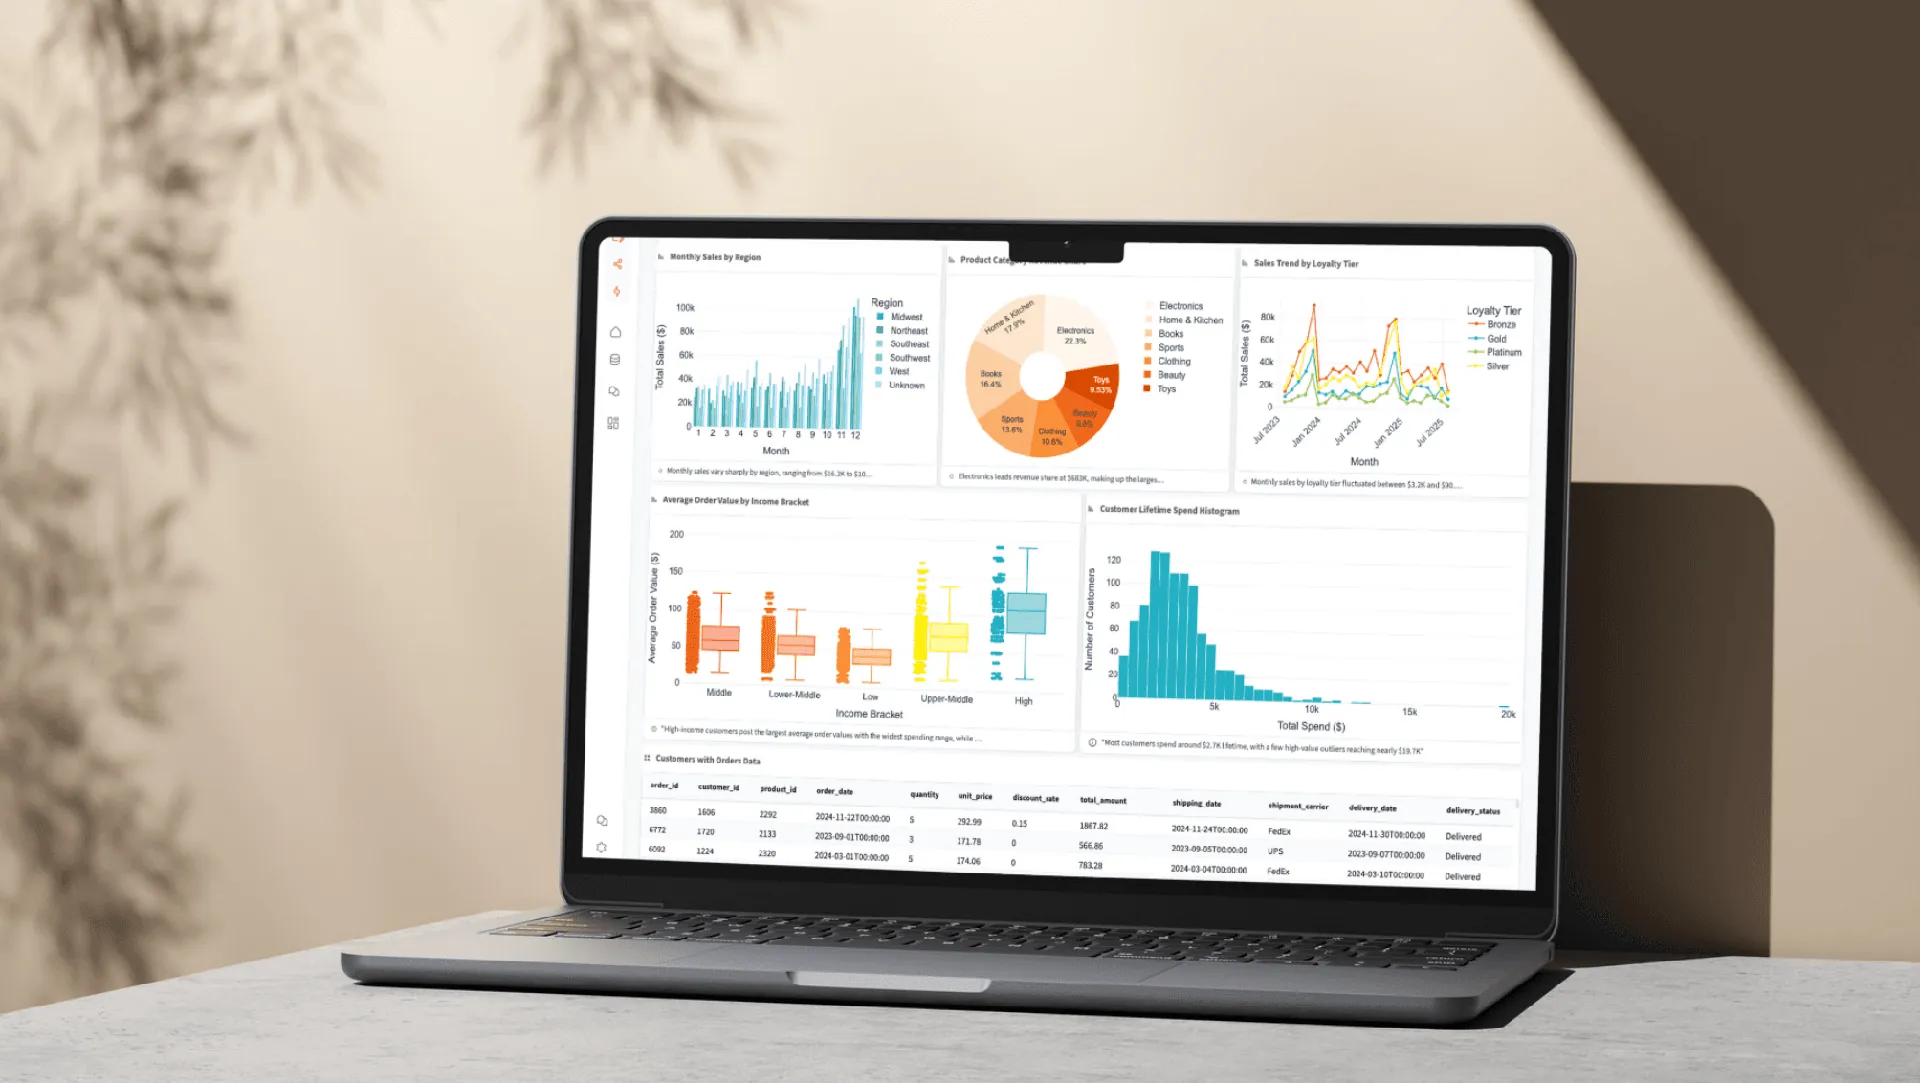
Build Dashboards in Minutes
The Dashboard Builder is now a complete, production-grade layout engine. Create interactive charts, data tables, rich text, images, and more simply by chatting with your data — then arrange everything with drag-and-drop ease. Querri acts as your AI Data Analyst, turning questions into polished, client-ready visual answers.
No coding or technical expertise required
7 widget types
charts, tables, rich text, images, Excel exports, and more
Drag-and-drop layout with responsive preview for desktop, tablet, and mobile
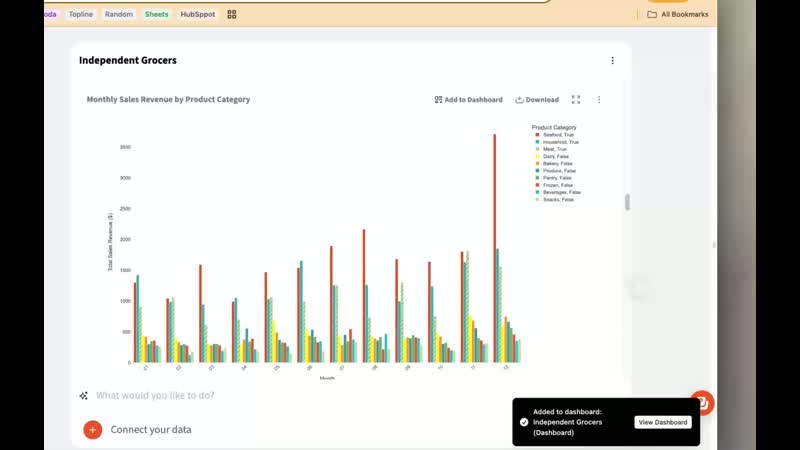
No More Dead-End Dashboards
Traditional dashboards show what happened. Querri dashboards help you understand why. As a Conversational BI tool, Querri keeps dashboards connected to live data so you can explore deeper, ask follow-up questions, and uncover insights instantly.
Wondering why sales spiked in a specific region? Click into the dashboard, ask a question in plain English, and let the AI do the analysis.
Go from viewing a trend to understanding the 'why' instantly
No need to request new reports from a data team
Keep your insights as dynamic as your business
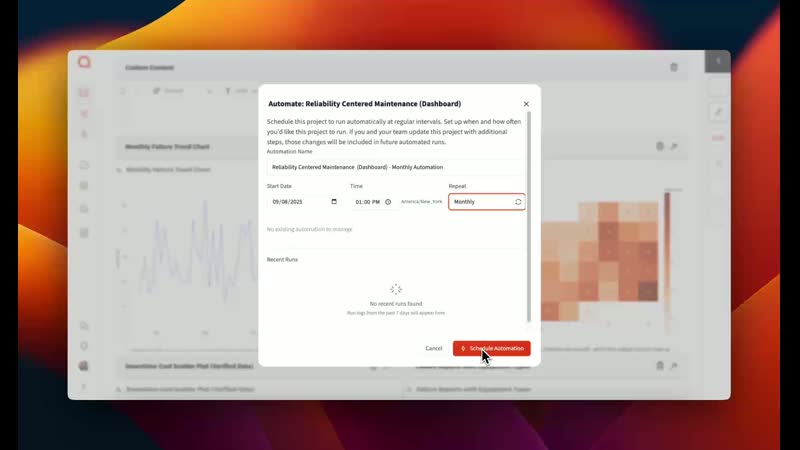
Automate for Real-Time Decisions
Set dashboards to refresh automatically at your chosen intervals so you and your team are always working with the latest numbers.
Choose daily, weekly, monthly, or custom update schedules
Make decisions based on the newest insights
Stay ahead in fast-moving markets with always-on AI data analytics
Share and Empower Your Team
Share your dashboards exactly how you want — with your team, your clients, or the world. Generate a public link anyone can view without a Querri login, add password protection for sensitive content, or embed individual widgets directly into your own tools and portals. For internal collaboration, role-based permissions keep the right people in control.
Public share links and password-protected access — no Querri login required
Embed individual charts, tables, or widgets into your own tools and portals
Role-based permissions for internal team collaboration and security

New to Dashboards?
Watch our dashboard series and learn more about the how and why.

How-To in Querri
Learn the fundamentals of building dashboards with Querri's intuitive interface
Automate Dashboards
Learn how to set up automated dashboard updates for real-time insights
From New Project to Dashboard
See how to go from a new project to a fully functional dashboard in minutes
Charts & Graphs
Explore different visualization types and when to use each one
Start visualizing your data now
Dashboard FAQs
Explore common questions about Querri's dashboard.
How Do I Build A Dashboard In Querri?
Just chat with your data in plain language to create charts, graphs, and pivoted spreadsheets. Once you have the visuals you want, simply drag and drop them into your dashboard. No coding or prior experience is needed — most people can create their first dashboard in minutes.
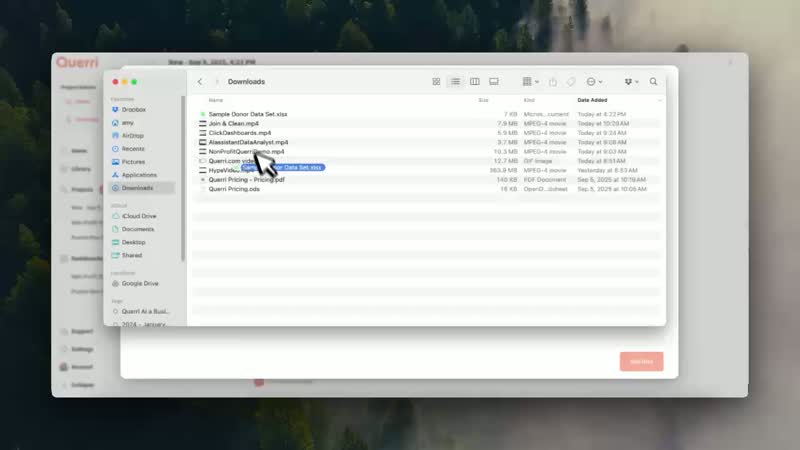
Can I Clean And Transform My Data Before Adding It To A Dashboard?
Yes. Querri automatically cleans, transforms, and pivots your data as part of your natural-language requests. You can also combine datasets, remove duplicates, and standardize values before turning them into dashboard-ready visuals.
Are Querri Dashboards Static Like In Other Tools?
No — Querri dashboards are fully dynamic and directly connected to your live data. You can click on a chart to explore deeper, ask follow-up questions, and uncover the "why" behind a trend without leaving the dashboard.
Can I Automate My Dashboards To Update?
Absolutely. You can set your dashboards to refresh automatically at intervals you choose — hourly, daily, weekly, or custom — so you're always working with the most current information.
How Do I Share A Dashboard With My Team?
Querri gives you three ways to share. Generate a public link that anyone can view without a Querri login — ideal for clients or external stakeholders. Add password protection for an extra layer of access control. Or embed individual charts, tables, or widgets directly into your own tools, portals, or intranets using per-widget embed codes. For internal teams, assign role-based permissions so the right people can view, explore, or edit based on their responsibilities.
Can Multiple People Work On The Same Dashboard?
Yes. With the right permissions, team members can collaborate, add new visuals, and refine dashboards together in real time.
What Kinds Of Charts And Visuals Can I Add?
Querri's Dashboard Builder includes seven widget types: interactive Plotly-powered charts (bar, line, pie, scatter, and more) with zoom, pan, and hover tooltips; virtualized data tables with sorting and pagination; a rich text editor for narrative and commentary; static images and SVG chart exports; Excel widgets for read-only spreadsheet data; spacers; and section headers to organize your layout. All generated from simple natural-language prompts and arranged with drag-and-drop ease.
Do I Need Technical Skills Or Data Experience To Use Querri Dashboards?
Not at all. Querri was designed so anyone can build and use dashboards without coding, formulas, or data modeling experience. If you can ask a question in plain language, you can build a dashboard.
Can I Track Trends Over Time?
Yes. You can create repeatable visualizations, automate updates, and return to them to monitor changes, spot patterns, and guide decisions.
How Fast Can I Get My First Dashboard Live?
Most users create and share their first dashboard in less than 10 minutes. Querri's AI handles the heavy lifting so you can focus on asking questions and using insights.