How to automate weekly marketing performance reports
Build a stakeholder-ready weekly marketing report in minutes: narrative insights, cross-channel data, and anomaly detection, using Querri's conversational AI.
Open QuerriWhat you'll need
Querri (Free trial) to connect data, run analysis, and generate narrative reports
Marketing data exports — CSV or Excel files from Google Ads, Meta, GA4, LinkedIn, or any ad platform
OR direct connectors — HubSpot, Google Drive, BigQuery (optional, for automated pipelines)
Need help?
If you have any questions, you can request a demo or email our team.
Before we begin
The average marketing report takes 2.5 hours when done manually: pulling data from GA4, Meta, Google Ads, and CRMs, formatting it into slides, and writing the insights. Most of that time is spent on "what happened" rather than the strategic analysis that actually earns your fee.
With this guide, you'll build a complete weekly marketing report workflow in Querri that automates the data collection, cross-channel unification, anomaly detection, and narrative generation, so you can focus on the "so what" and "what's next."
How it works:
- • Connect or upload your marketing data from any platform (Google Ads, Meta, GA4, HubSpot, etc.)
- • Ask Querri to unify, clean, and standardize across sources, even when naming conventions don't match
- • Run a single prompt to generate a narrative report with WoW/MoM comparisons and anomaly flags
- • Review, add your strategic layer, and export to Excel, dashboard, or Google Sheets
- • Save as an automated project that runs on schedule; next week's report is ready before you ask
Follow the steps
Connect your marketing data sources
Upload CSV or Excel exports from Google Ads, Meta, LinkedIn, and GA4, or pull data from HubSpot, Google Drive, and BigQuery through Querri's direct connectors. Querri handles the rest, so your data is clean and ready for analysis.
Tip: You can connect multiple sources at once. Querri joins and cleans them automatically, even when column names, date formats, or campaign naming conventions don't match across platforms.

Combine and clean across platforms
Ask Querri to unify your data in plain language. For example:
"Standardize campaign names across Google Ads and Meta, then join with GA4 session data by UTM parameters."
Querri profiles your data, detects mismatches, and standardizes everything automatically. No SQL required.
Run your weekly report prompt
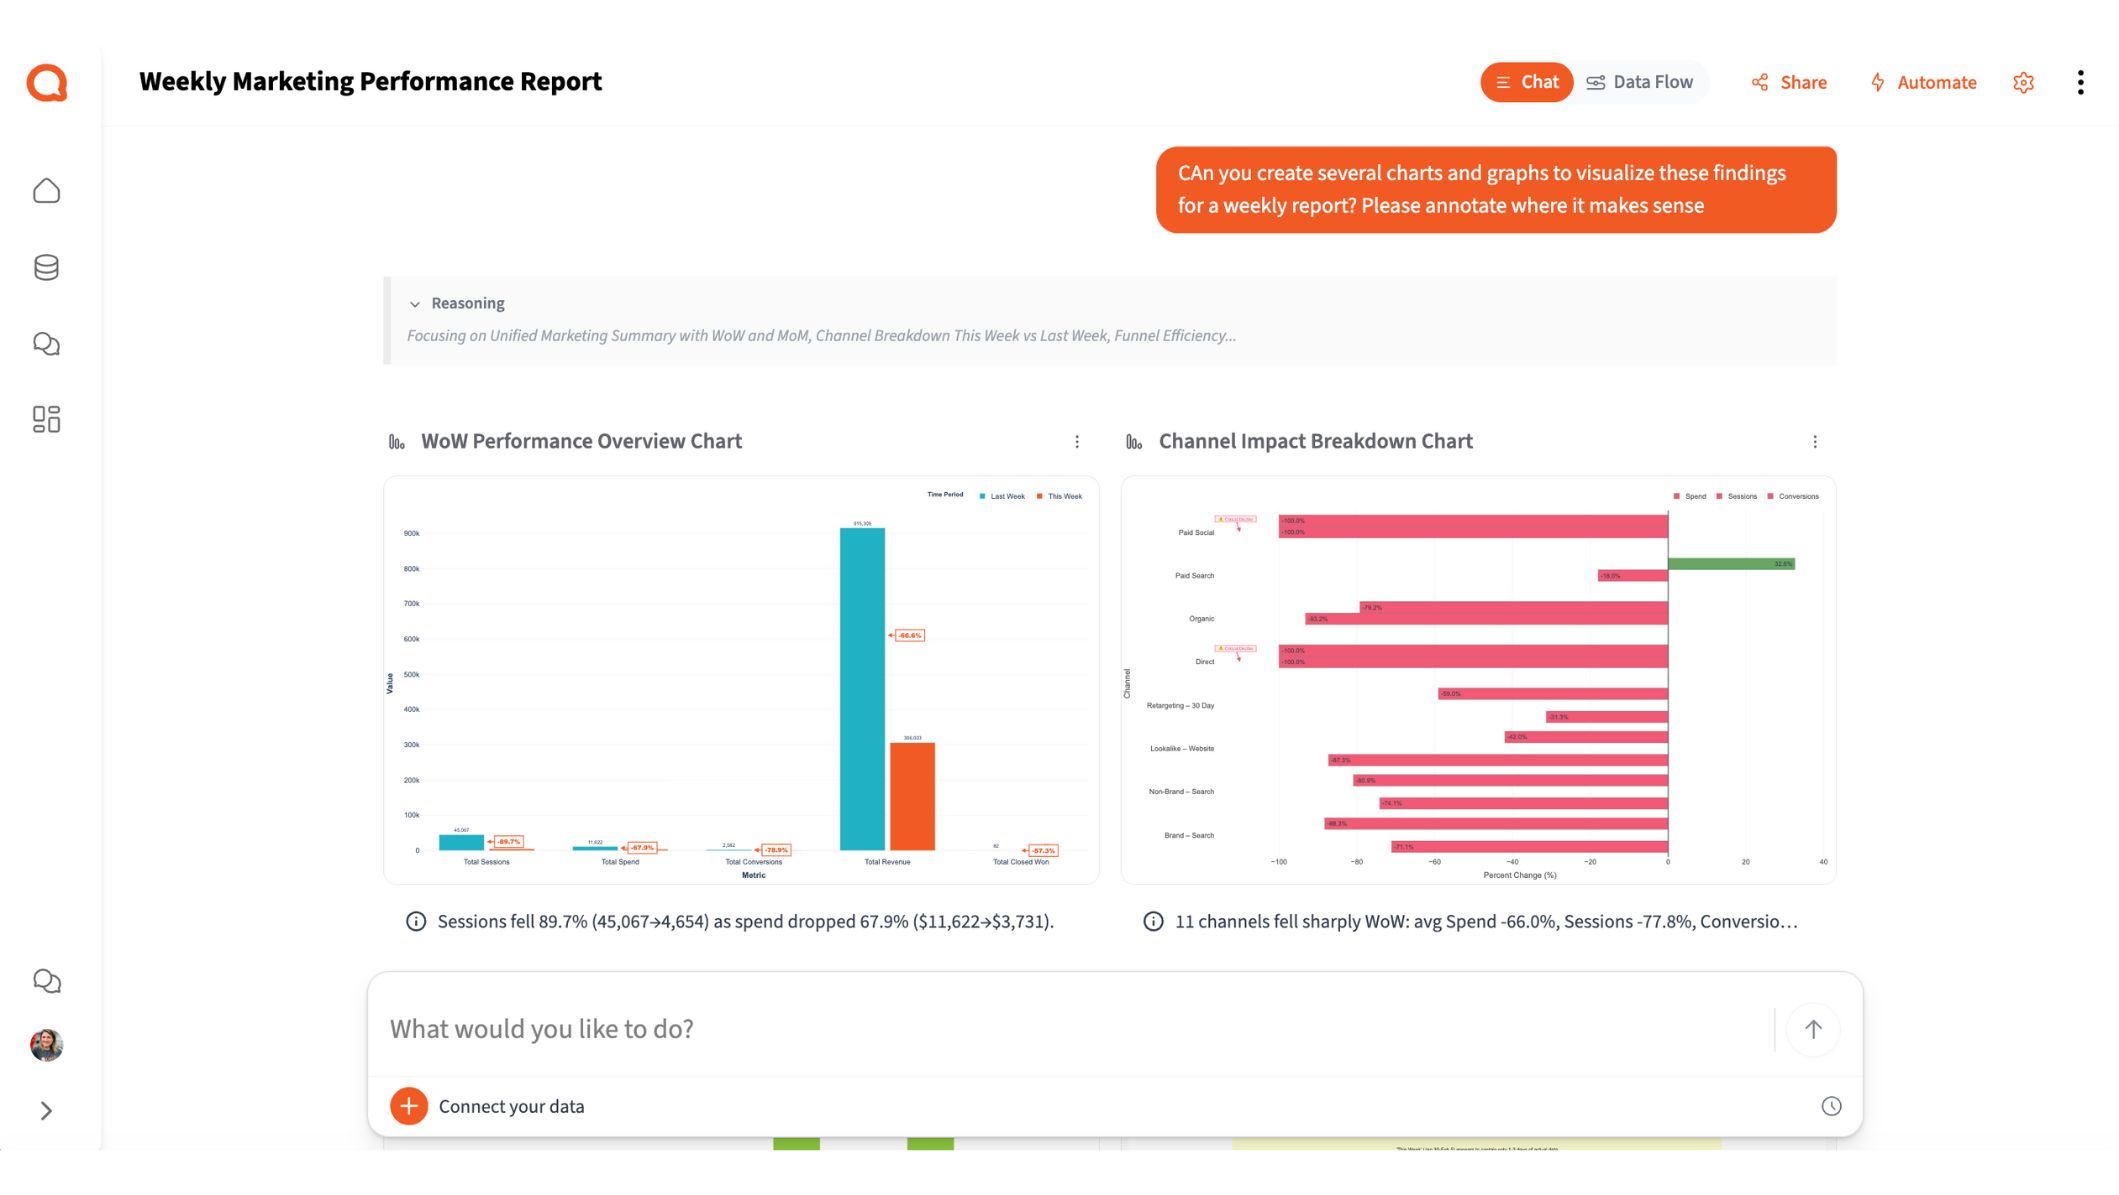
This is where the magic happens. Ask Querri to generate a full narrative report:
"Generate this week's marketing performance report. Include spend, conversions, CPA, and ROAS by channel. Flag anything that changed more than 15% WoW and explain why."
Querri pulls the numbers, spots the anomalies, and writes the narrative: the part that usually takes the longest. You get a stakeholder-ready report, not just a wall of charts.
Review and add your strategic layer
Querri handles the "what happened." You add the "so what": your recommendations, next steps, and strategic context that only a human marketer can provide.
This is where you earn your fee. Ask follow-up questions in plain language to drill deeper:
- • "Why did CPL spike on Meta last Tuesday?"
- • "Break down Google Ads performance by campaign type"
- • "Compare this week's ROAS to the monthly average"
Save and automate for next week
Turn your report into a reusable automated project. Querri chains the data cleanup, transformations, and analysis into a repeatable pipeline that runs on schedule.
What you can create or export:
- AI-generated presentations with 25 professional slide templates and interactive charts
- Charts as PNG or SVG (SVG is editable in PowerPoint)
- Multi-tab Excel files with formatted tables and figures
- Google Sheets via scheduled Google Drive export
- Saved to Querri's Library for use in other projects
Tips for better weekly reports
Separate the "What" from the "So What"
Let Querri handle data collection, trend spotting, and anomaly flagging. Reserve your time for strategic recommendations and action plans; that's where you earn your fee.
Use consistent UTMs and naming
Clean campaign naming across platforms makes cross-channel analysis dramatically easier. If your naming is already messy, ask Querri to standardize it before running reports.
Include context, not just numbers
A great report explains why leads dropped 10% or how you plan to fix it. Prompt Querri to include explanations alongside the data.
Build a reusable template
Create one strong prompt that covers your standard KPIs and save it. Each week, just update the data and run. Over time, refine based on what stakeholders actually ask about.
Give stakeholders 80% of what they need
Don't over-engineer reports. Deliver the core metrics and narrative your audience cares about, then leave room for ad-hoc questions and deeper dives when they come up.
Frequently asked questions
How is this different from Looker Studio, Power BI, or Supermetrics?
Can Querri generate reports for multiple clients?
Can Querri build a cross-channel marketing report from multiple platforms?
Does it replace my reporting entirely?
Can I customize what metrics and KPIs are included?
How long does it actually take to generate a report?
What formats can I export the report in?
What if I need to answer follow-up questions about the report?
Other popular resources
Examples
Browse all use cases
Explore how other teams use Querri for data analysis.
Blog
How agentic AI works
Learn how Querri's AI agents transform your data analysis.
Demo
Request a walkthrough
See Querri in action with your own data.
Pricing
Compare plans
Find the right plan for individuals, teams, or enterprise.