Your BI Platform Was Never Built for Business Questions
Your BI platform isn't a business tool. It's an engineering tool with a business-facing interface. There's a difference. And your analysts are living in it every day. Here's why the five KPI categories change everything.

Most data stacks were designed around tables and schemas — not around the questions your business actually asks. The gap between your data investment and business confidence isn't a data problem. It's an architecture problem.
Every major data platform on the market was built around the vocabulary of infrastructure: tables, schemas, dimensions, measures. The people who designed them were thinking about storage, query performance, and data modeling. Business questions were an afterthought, handled by bolting a presentation layer on top and hoping someone in the middle could translate.
Fewer than half of business leaders say their data strategy fully aligns with their business priorities — a significant decline since 2023. (Salesforce, survey of 500+ business leaders)
75% of executives consider data-driven decision-making essential. Only 27% feel confident in their ability to act on it. (Harvard Business Review)
That gap isn't a data problem. It's an architecture problem. Adding more dashboards won't fix it.
84% of executives say BI and analytics are critical for their digital transformation roadmap, yet only 46% trust the quality of their organization's data. Investment is high. Confidence is low. The analyst is the bottleneck. You hired good people. You just handed them a system that was never designed for the questions they're being asked to answer.
Querri is building the Library around a different premise. It starts with something simple.
The five things every business actually measures
Every meaningful business question maps to one of five things. Not because we invented a framework. Because this is how businesses have been evaluated by boards, investors, and executives for decades.
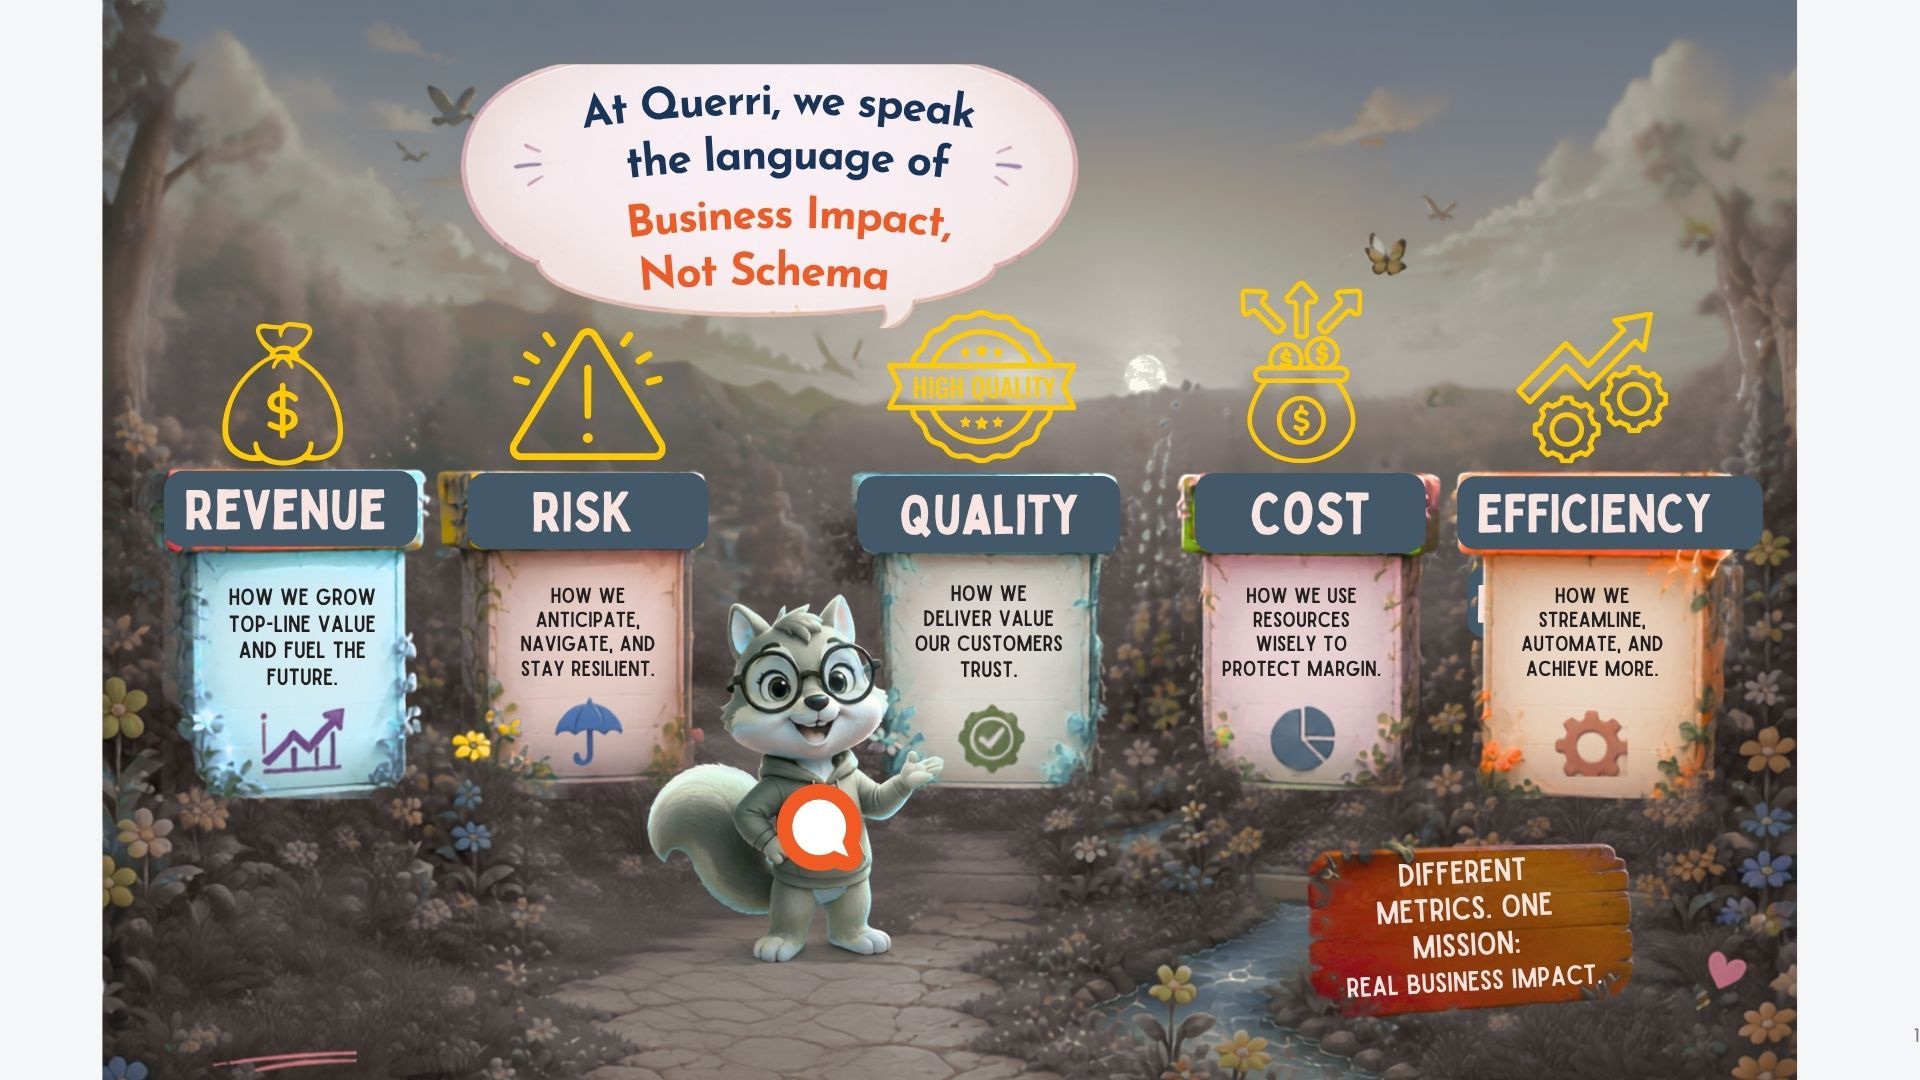
Revenue. Top-line growth, deal velocity, expansion, new logo acquisition. Are we making more money than we were?
Cost. COGS, operating expenses, unit economics, margin. Are we spending the right amount to make that money?
Efficiency. Throughput, cycle time, conversion ratios, utilization. Are we getting the most out of what we have?
Quality. NPS, defect rates, accuracy, customer satisfaction, conformance. Are we delivering what we promised?
Risk. Churn exposure, compliance posture, security, concentration, key-person dependency. What could hurt us that we are not watching closely enough?
These five things are not a form to fill out. They are a mental model. The lens through which every KPI your business tracks should be answerable. And one metric can easily span more than one of them. Churn, for example, lives at the intersection of Risk and Revenue. Your data platform should know that. Today's don't.
You don't know what your data can't answer
Here is the question no current data stack can answer: which parts of your business do you actually have good visibility into, and which ones are you flying blind on?
A warehouse stores tables. A semantic layer defines measures. A BI tool builds dashboards. At no point in that chain does any system understand that "monthly recurring revenue" and "average contract value" are both Revenue questions that should inform the same business decision. What you get instead is what one BI industry analysis described as conflicting reports: marketing calculates ROI one way, finance calculates it another, and executives stop trusting any dashboard at all.
67% of organizations say they don't completely trust their data for decision-making. Not because the data is wrong. Because the system gives them no way to know what it covers, where it comes from, or why two numbers disagree.
Querri's Library ties every KPI to one of the five categories. Sub-KPIs sit underneath, as deep as your business needs. And which categories you have solid answers for, and which ones have gaps, becomes something the system can actually tell you.
That is the part that changes things. Being able to ask "what don't I know?" and get a real answer.
You don't configure it. You just ask.
The first thing most executives say when they hear "five categories" is: "Great, another framework I have to maintain."
You don't.
The five categories are what Querri's AI agent, called the Librarian, will use internally as a guide. Not something you'll need to set up.
You describe a real business question: "I want to understand what's driving customer churn." The Librarian is being designed to identify that it's a Risk and Revenue question, map the relevant KPIs, suggest follow-on questions, and build the structure underneath, all before you've connected a single data source.
Most data governance programs fail for a pretty simple reason: they get treated as a separate project running alongside the actual work, instead of something woven into it. The Librarian will build structure from the questions you're already asking. The Librarian is designed such that Querri will be able to create your KPI framework even before the user has had a chance to finish their onboarding. The vocabulary of your business is in the system, not buried in a wiki that nobody updates.
What every other data platform organizes around
| Platform Category | Organizes Around | Layer |
|---|---|---|
| Warehouses / Lakehouses | Tables, schemas, medallion zones | Storage |
| Semantic layers (dbt, Cube) | Measures, dimensions, models | Translation |
| BI tools (Looker, Tableau) | Reports, dashboards, explores | Presentation |
| AI copilots over warehouses | Same schemas, now in a chat box | Chat |
| Querri Library | Questions and KPIs | Business |
None of the platforms in that list can route a query without first mapping it to a schema. The Library is designed so Querri can route a query without first mapping it to a schema, because the question itself will already be in the system, tied to a KPI and a business category.
Self-service BI adoption grew 31% year-over-year as business teams pushed for more autonomy from IT. But self-service over a schema is still schema. What people actually want isn't easier access to tables. It's answers in the language they already speak.
The question is what should come first
The real issue isn't which categories to use. It's what your data platform treats as its basic unit of organization.
Warehouses put tables first. Semantic layers put measures first. BI tools put reports first. Every AI copilot built on top of a warehouse just moved the schema problem into a chat window.
Querri puts the question first, with KPIs as the anchor that keeps things honest. Every question in the Library will bind to at least one KPI. Every KPI will belong to at least one of the five categories. That's what makes the system usable without a data engineer, auditable without a forensic investigation, and stable when upstream data changes.
If your data platform can't tell you which business questions it's able to answer and which parts of your business it doesn't have visibility into, it's built around the wrong thing.
The five categories are not the breakthrough. Knowing where your gaps are, and being able to do something about it, is.
Querri is building the Library: a business knowledge graph organized around questions and KPIs, not schemas and tables. The Librarian will build it from your data and keep it current.
Pick one business question your team struggles to answer consistently. Bring it to us. We will walk you through how we are designing the Library. Book a session.
Sources
- Salesforce: Trust in Business Data Leaders Survey (2025)
- Precisely + Drexel University LeBow: 2025 Outlook: Data Integrity Trends and Insights — source for 46% and 67% data trust figures
Tags