QUERRI FOR CUSTOMER SUCCESS
Less Spreadsheet Firefighting. More Retained Revenue.
What Customer Success teams use Querri for
Every CS analysis. One platform.
From churn signal detection to QBR prep — every analysis your team runs, in one place.
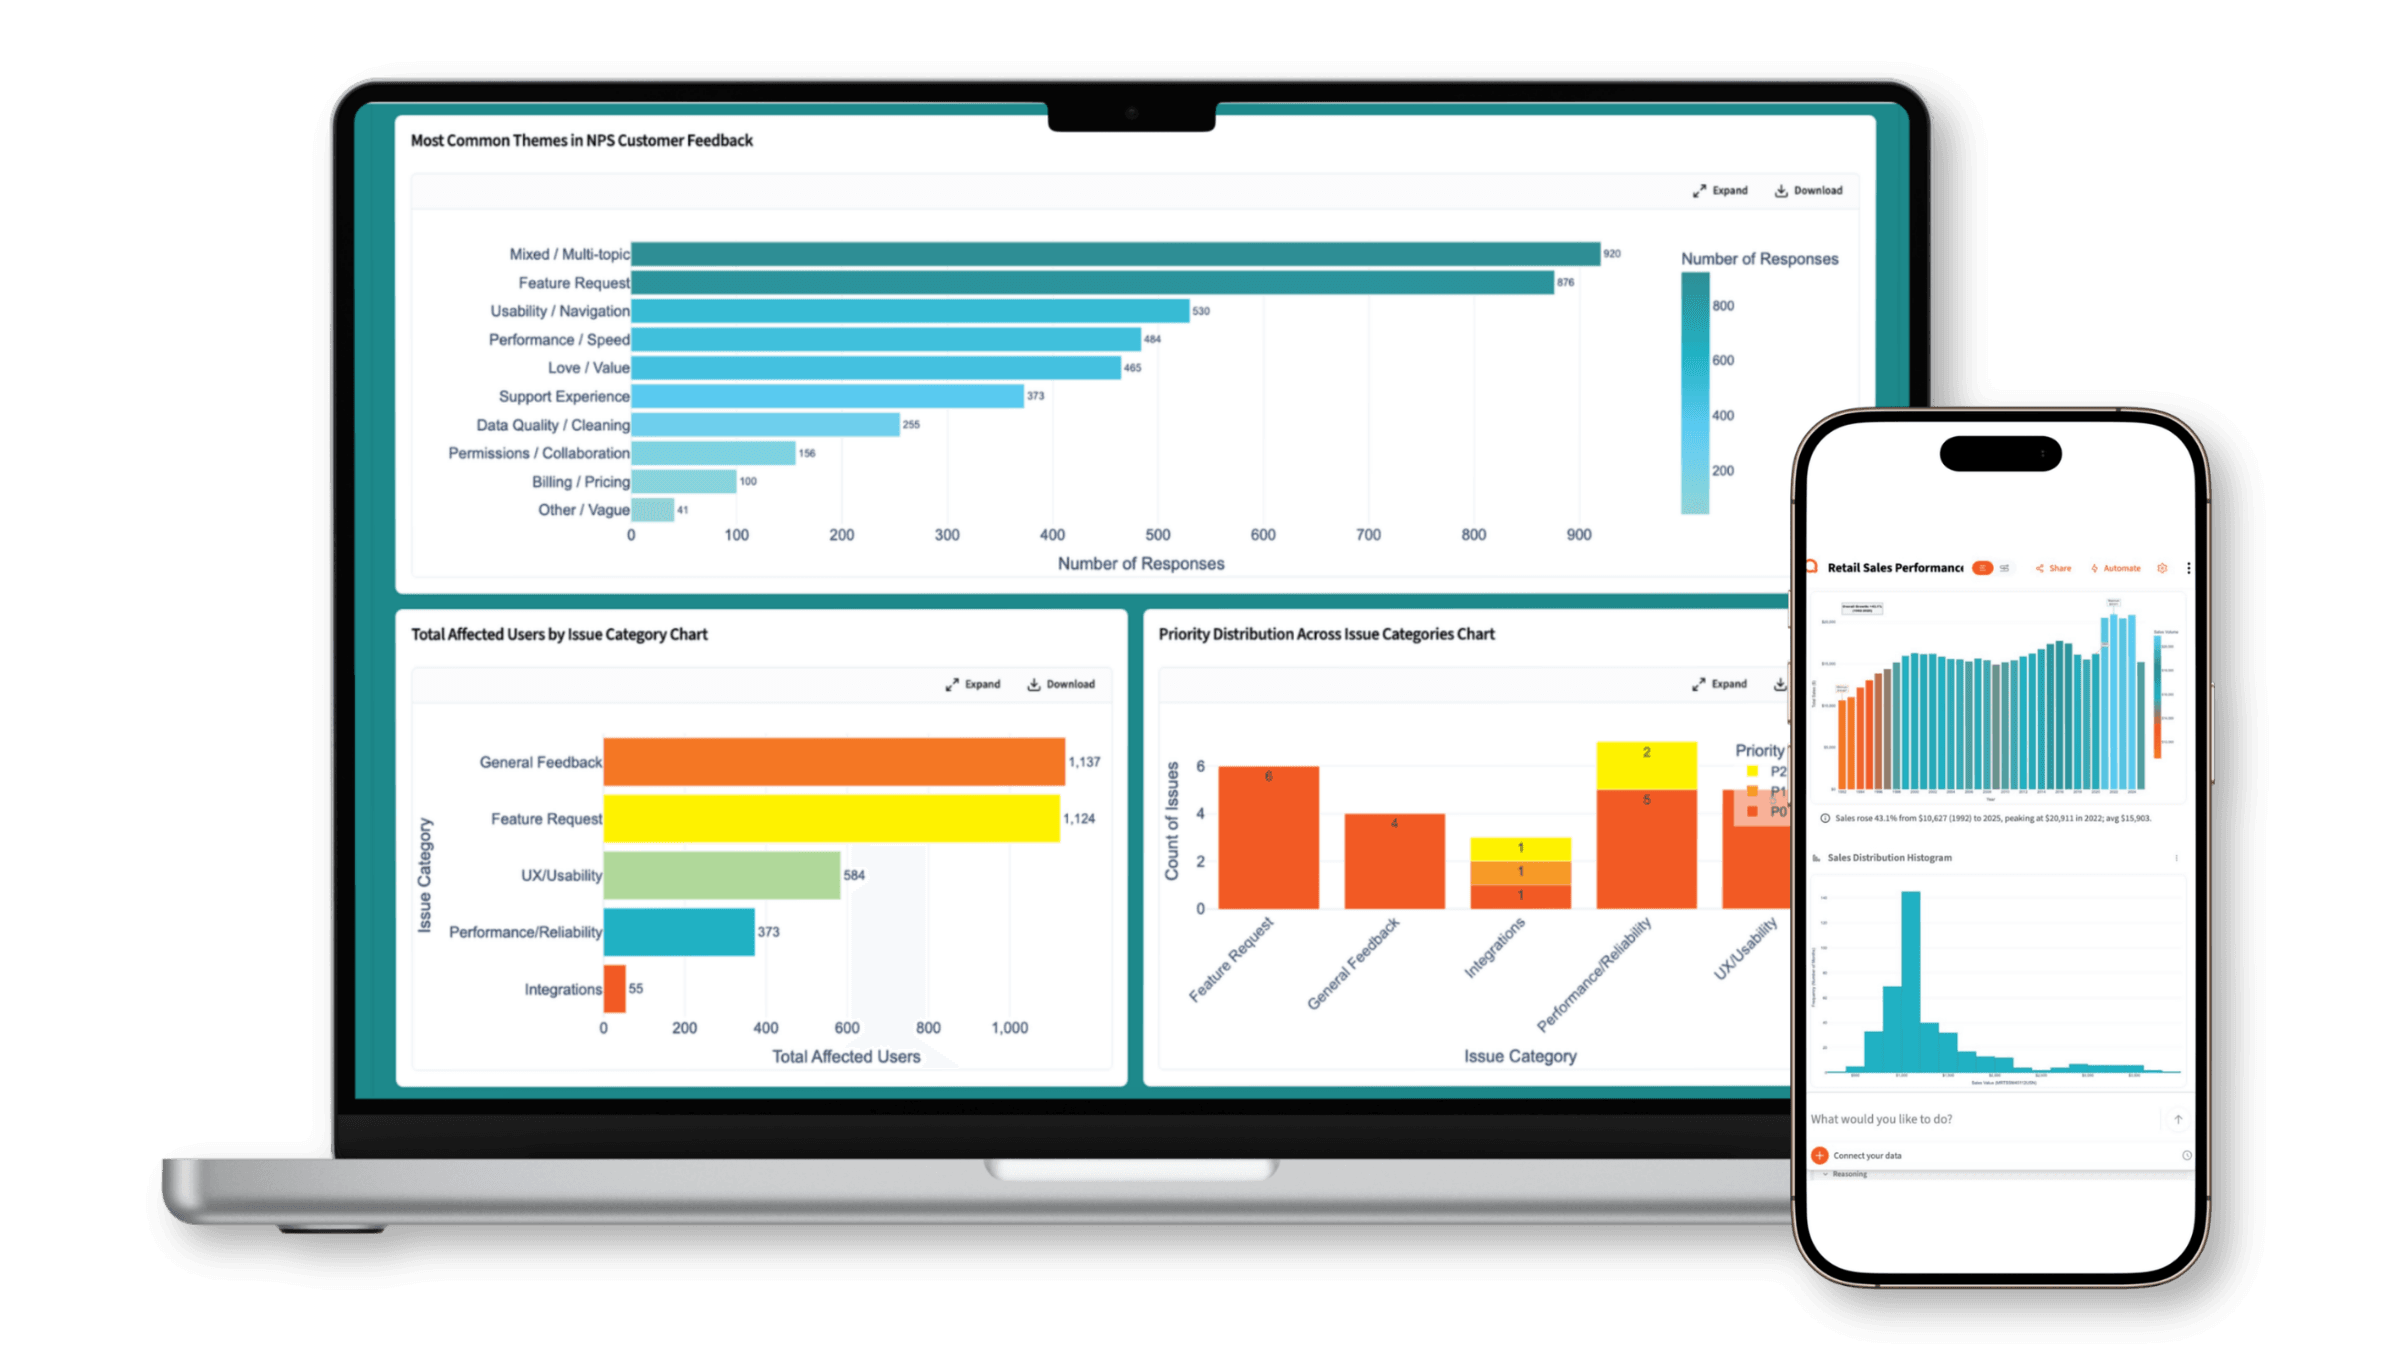
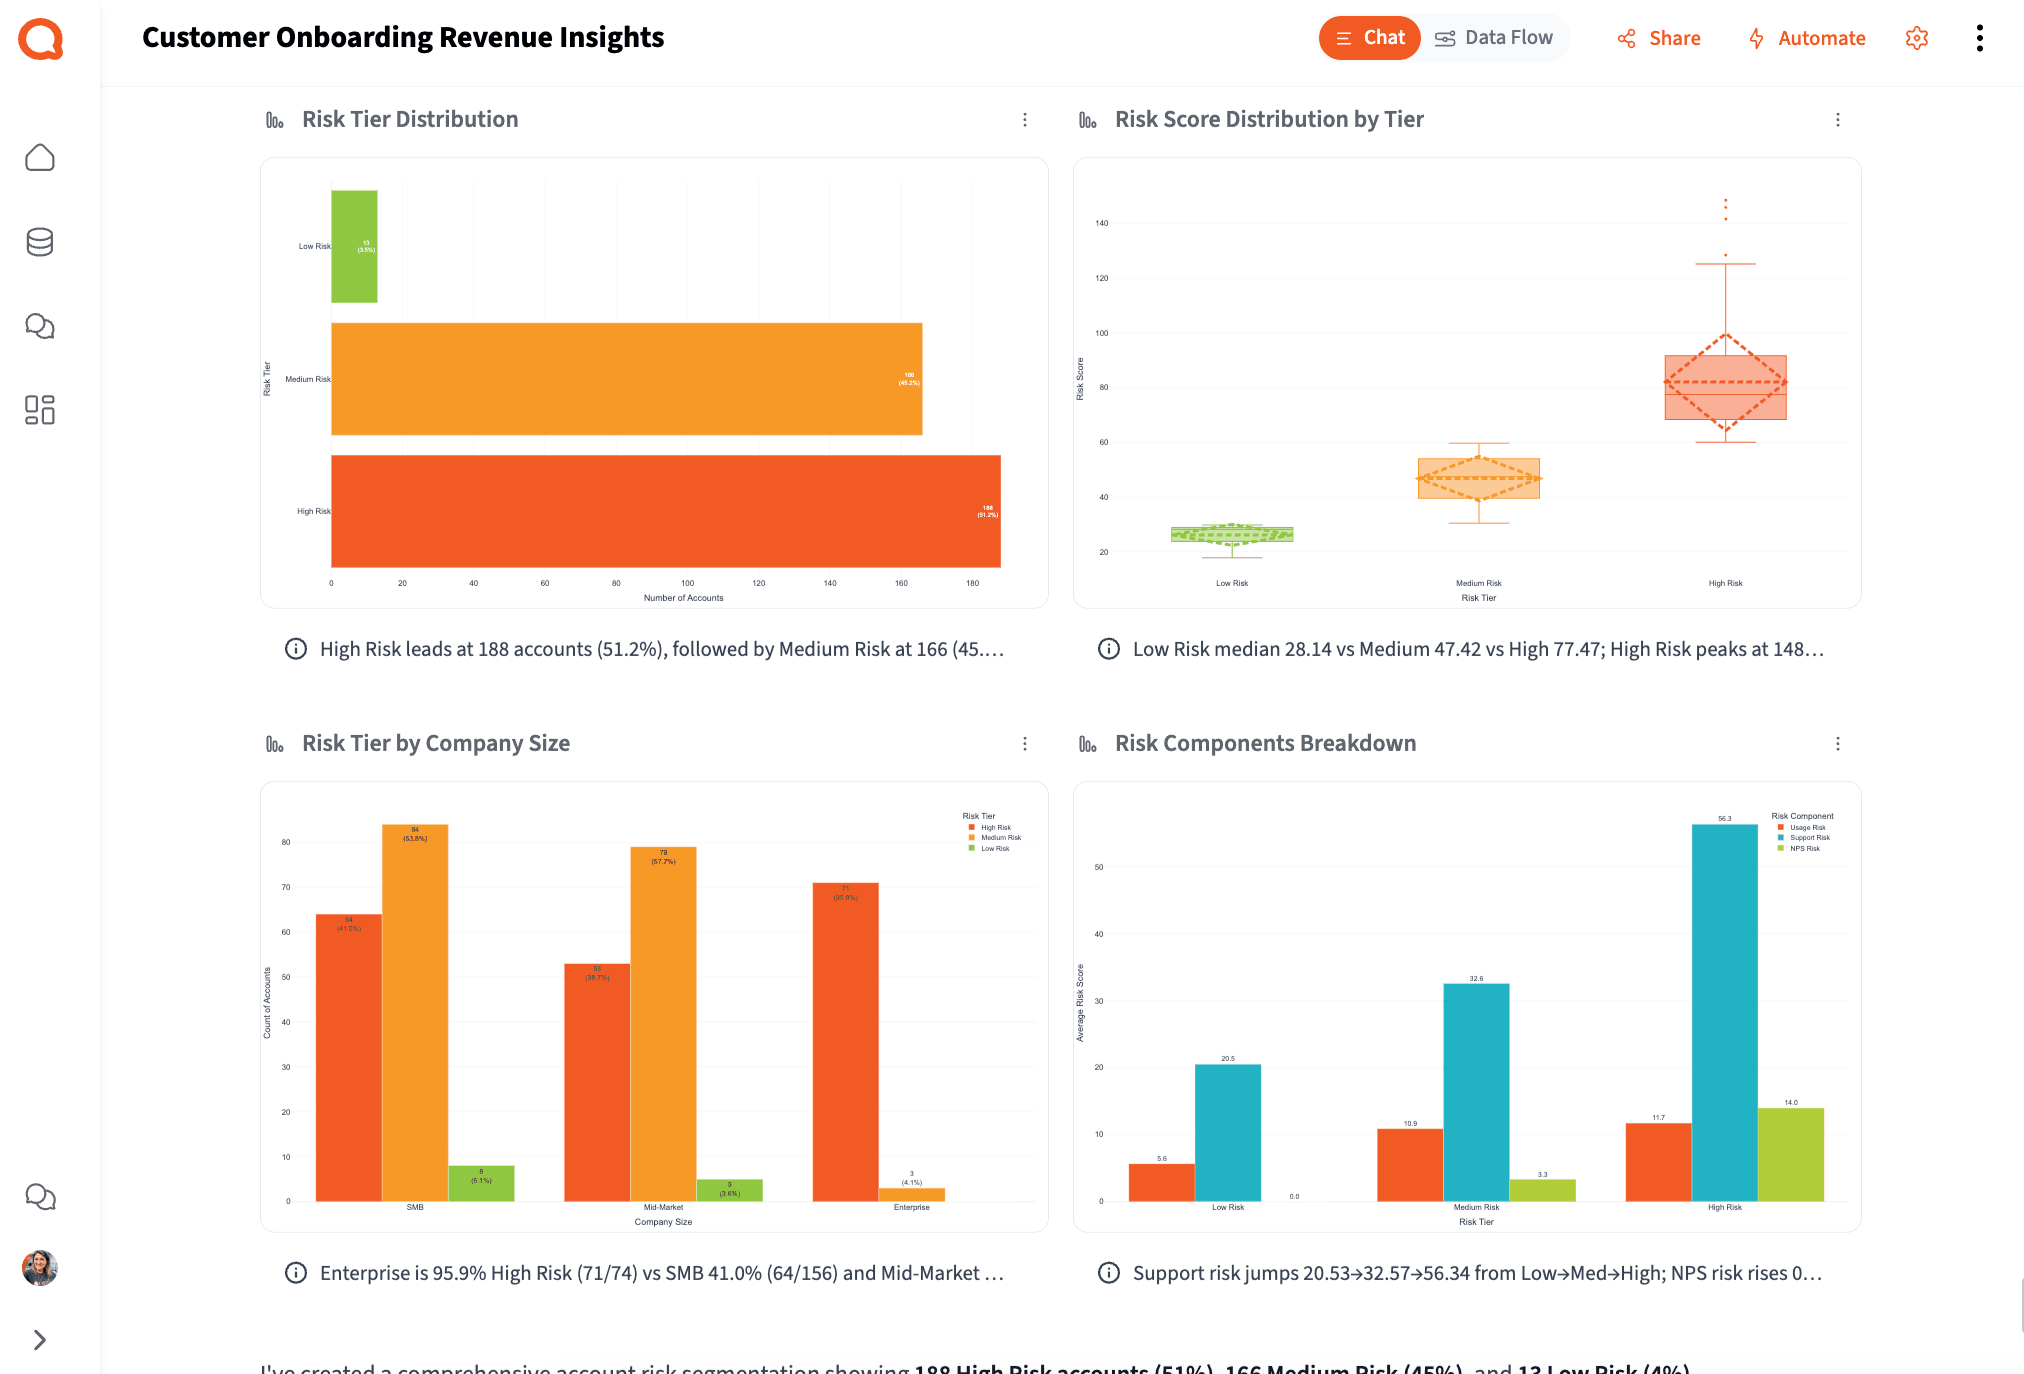
Early Churn Signal Detection
73% of CS leaders say identifying at-risk customers is the best activity to automate with AI — but most tools only show you structured metrics. Querri extracts risk signals from the text your dashboards can't read: negative sentiment in tickets, escalation themes in call notes, complaint patterns in NPS verbatims. Combined with usage and billing data, it builds a risk picture that's weeks ahead of a formal health score alert.
Try asking
How it works
How Querri Works for Customer Success
Step 1 — Connect
Connect Your Entire CS Data Stack
Step 2 — Clean
Clean the Fragmented Data Your CS Team Relies On
How it works
From fragmented CS exports to leadership-ready output in four steps
Any CS ops manager can run this workflow. No SQL, no data engineering ticket, no waiting in a queue.
Connect
Upload exports from your helpdesk, CRM, or survey tool — or connect live to HubSpot, Salesforce, BigQuery, and Google Drive.
Clean
Querri automatically normalizes account IDs, deduplicates contact records, fixes date formats, and resolves field mismatches across your CS data sources.
Analyze
Ask your question in plain English. Querri runs multi-step analysis — churn signals, health score inputs, account segmentation, ticket theme discovery — and shows its reasoning in explicit, inspectable steps.
Share
Export to Excel, PowerPoint, or PDF. Build a live CS dashboard. Or schedule the whole workflow to run automatically every week.
See each step in action with our playbooks
Step-by-step walkthroughs for real CS workflows — from connecting your first export to building an automated weekly account health report.
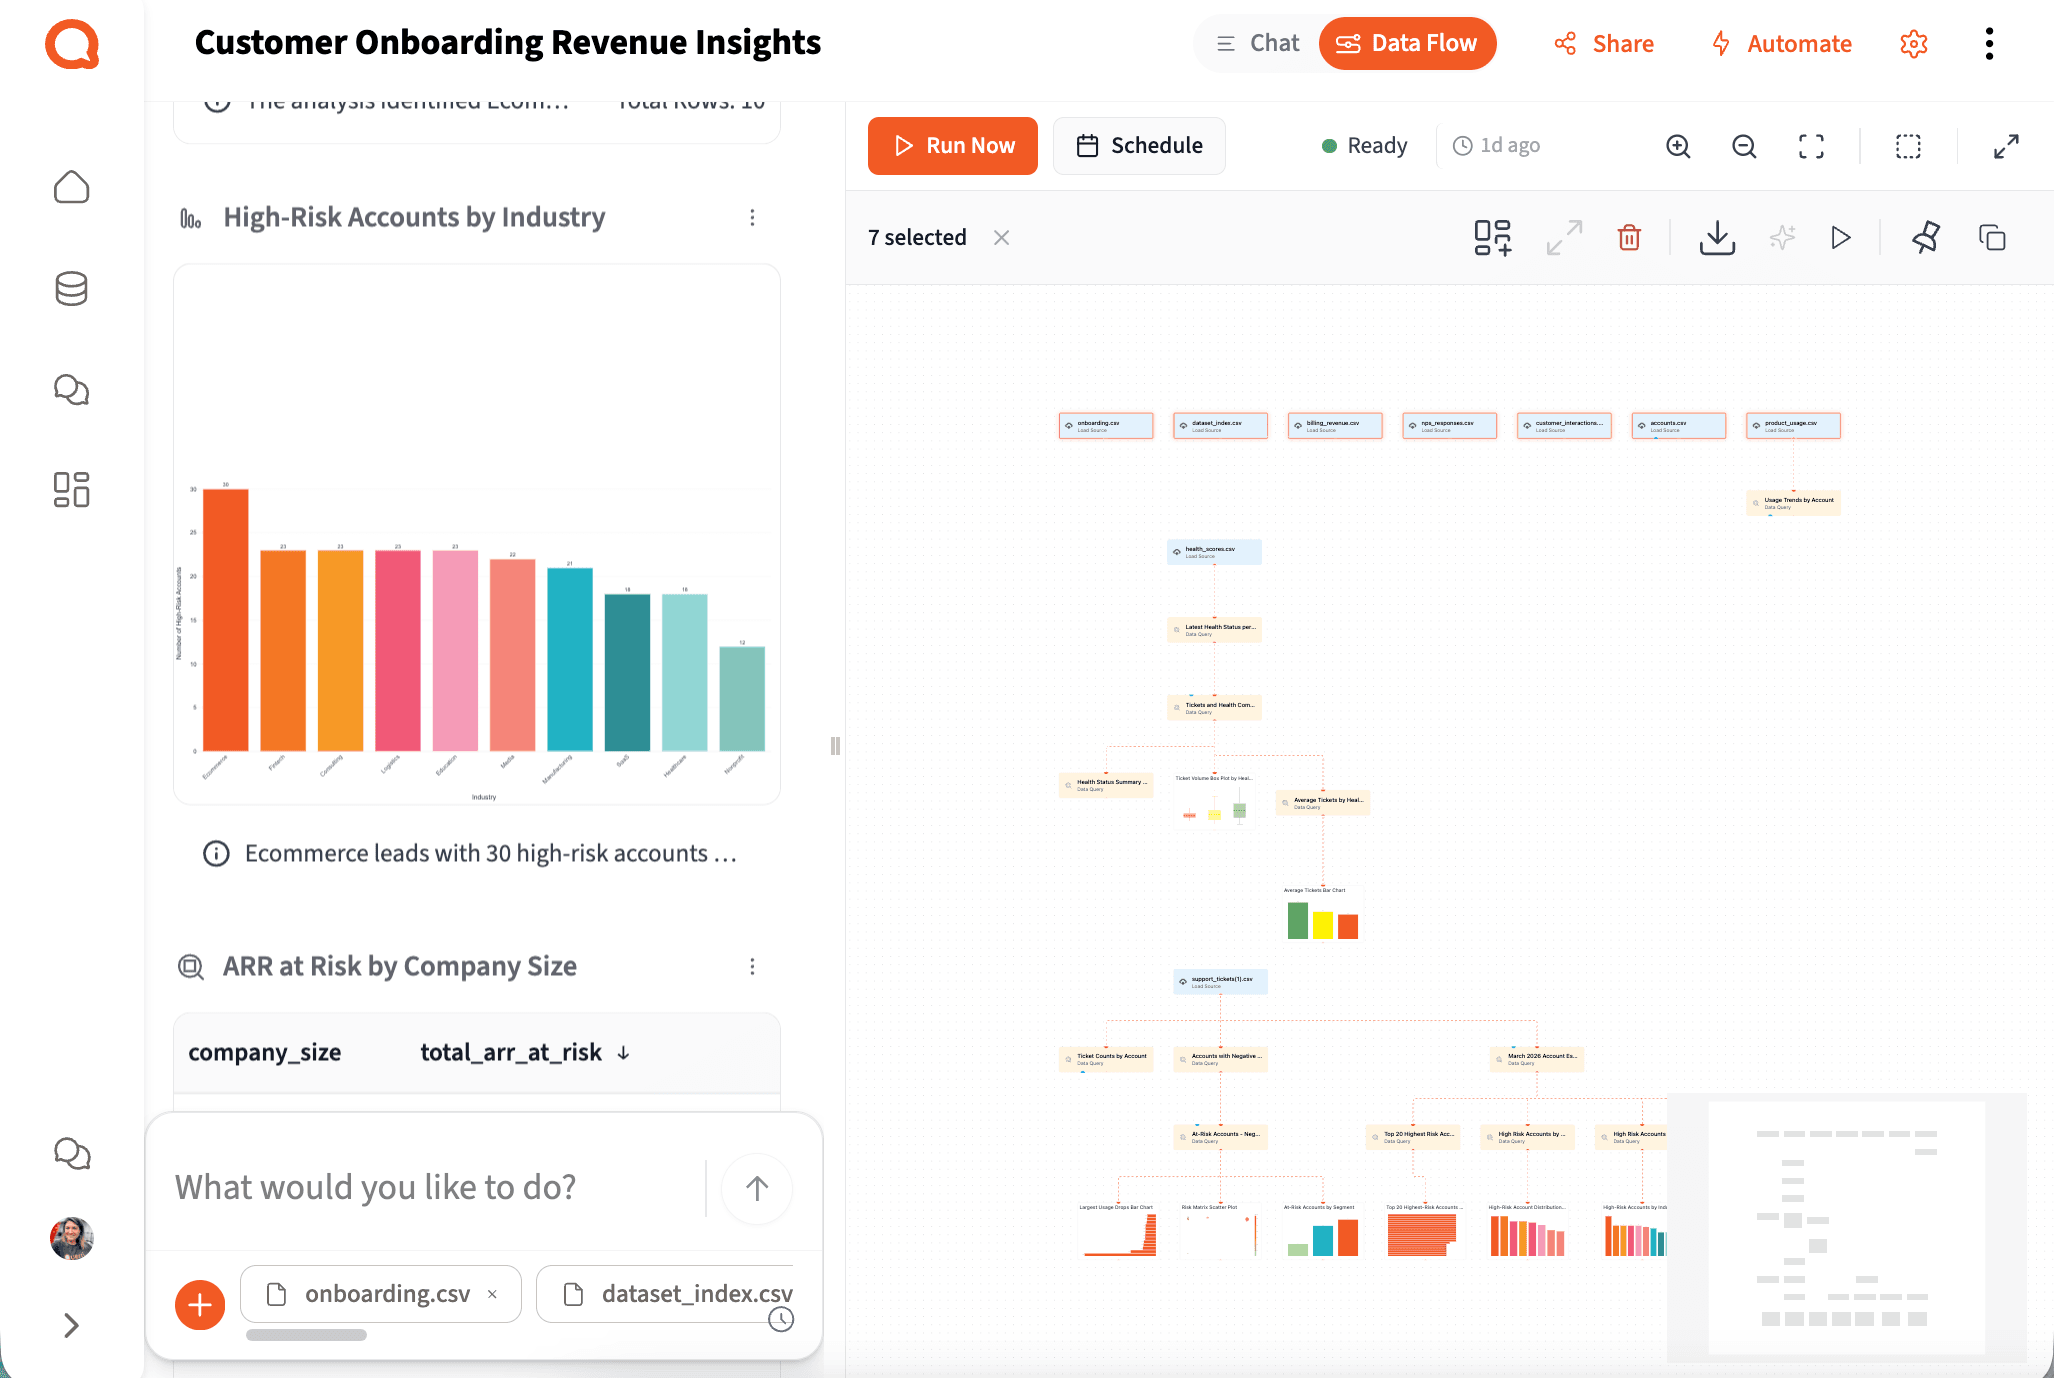
Step 3 — Analyze
Answer CS Questions Without a Data Engineering Ticket
The reality for most CS teams
You're sitting on thousands of customer signals. Most tools just can't read them.
Based on research from Gainsight, ChurnZero, and Custify across 1,500+ CS leaders and practitioners.
73%
Of CS leaders want to automate churn risk identification
But most tools only surface risk from structured metrics. The real signals — negative tone in tickets, complaint themes in notes, disengagement in verbatims — are locked in free text.
32%
Of organizations have a single place tracking all customer data
CRM, helpdesk, product analytics, billing, surveys — each system tells a different part of the story. CS ops spends hours every week stitching them together manually.
83%
Of CS professionals use spreadsheets daily
Not because they want to — but because no single tool connects all their sources and answers questions without a data team or SQL knowledge.
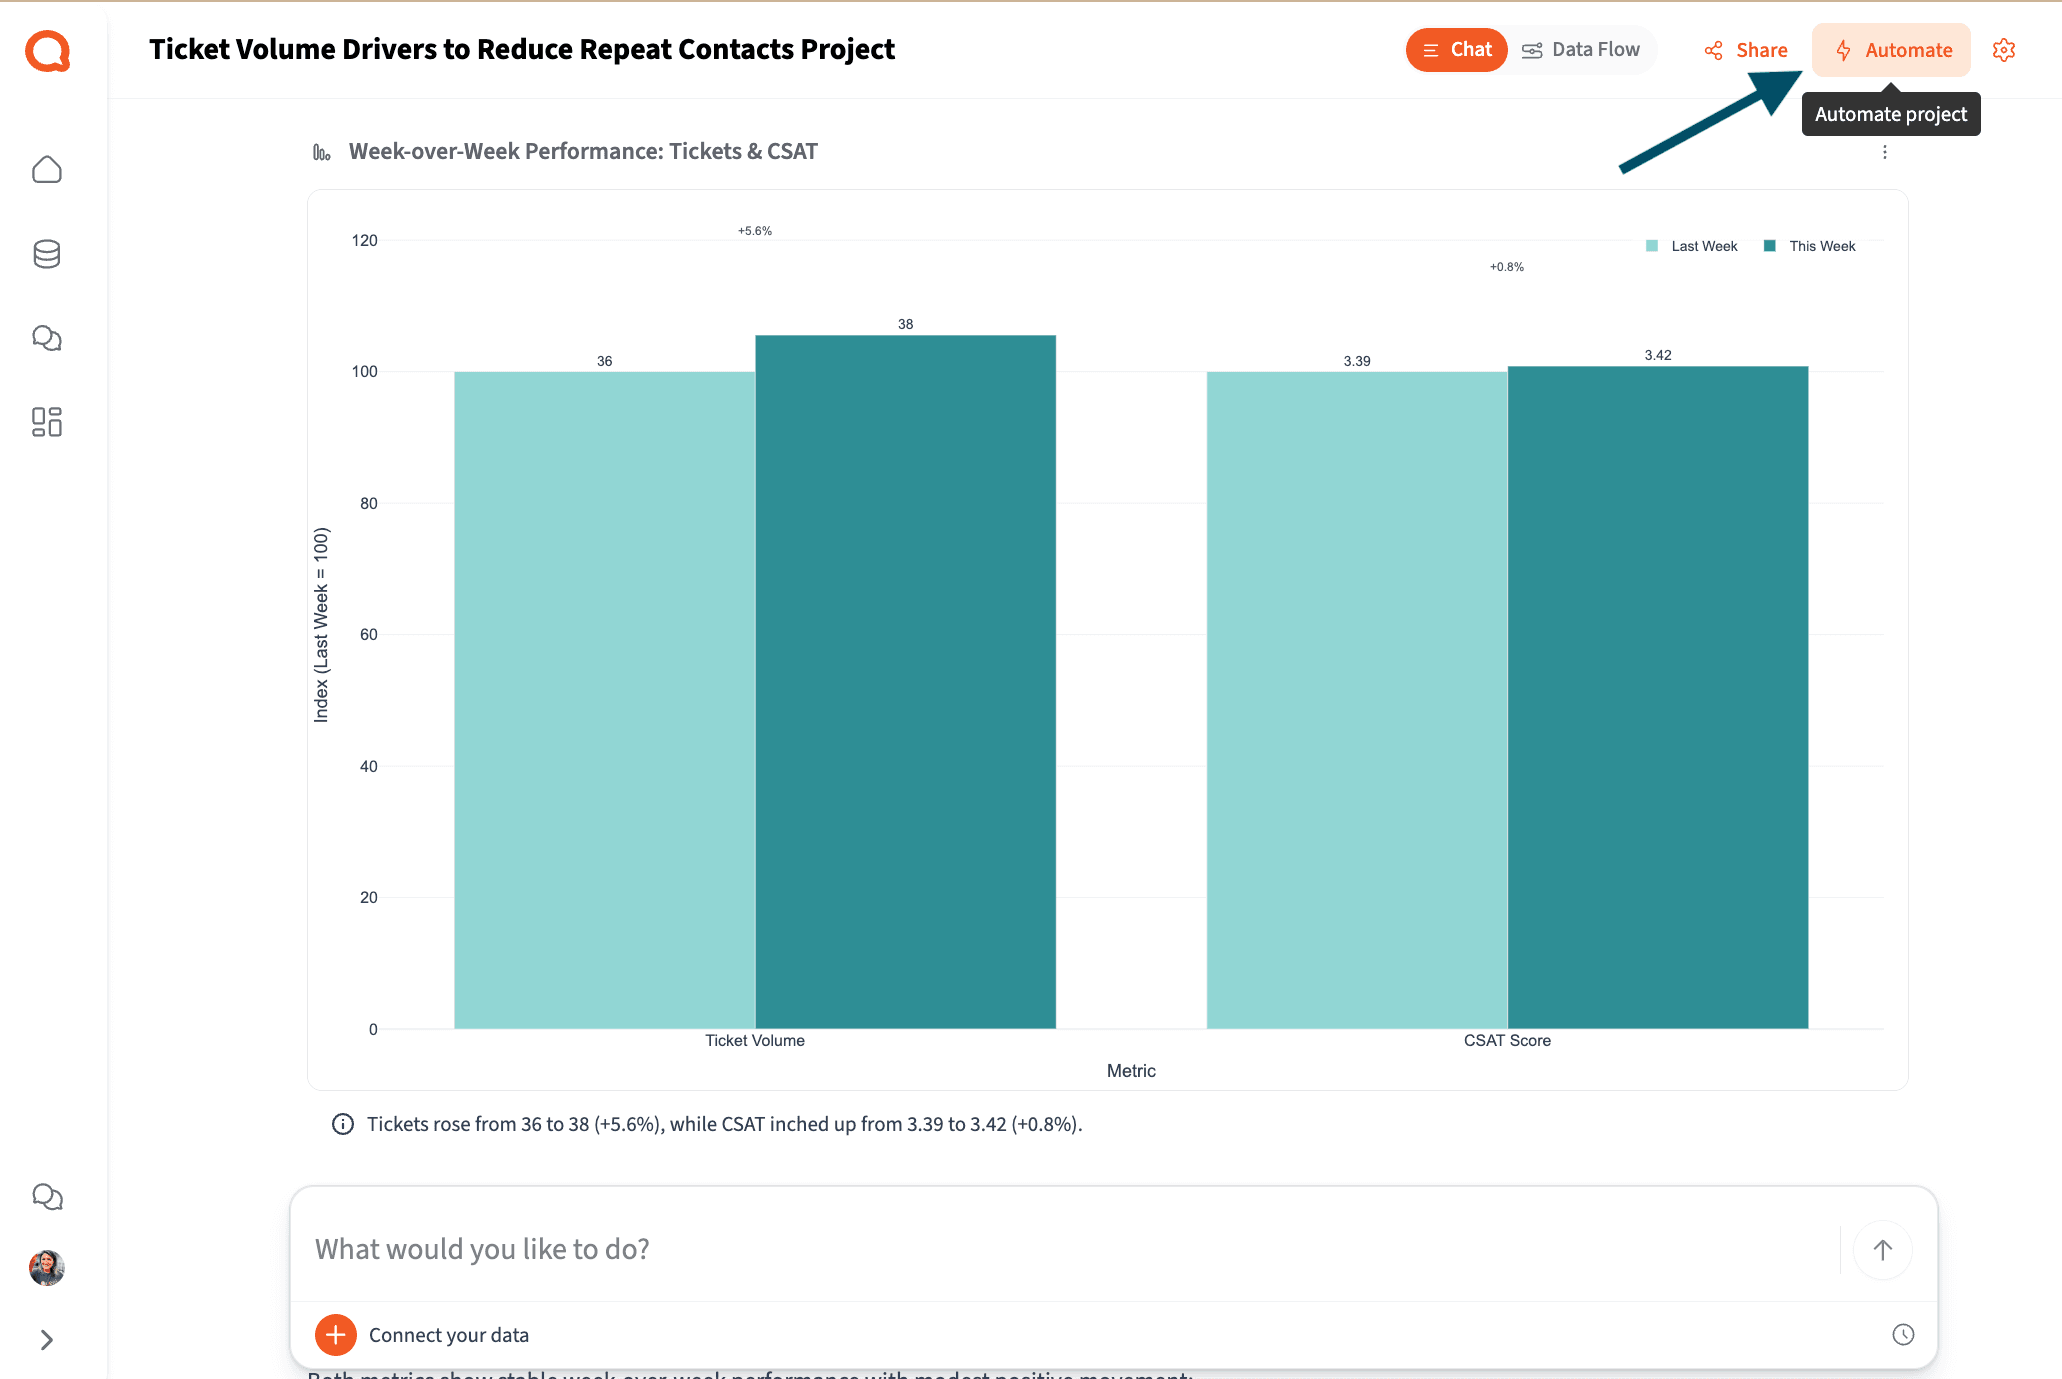
Step 4 — Share & Automate
Automate Weekly CS Reports and Account Health Reviews
The biggest problem in CS isn't that we don't have data — it's that it lives in five different tools and none of them agree on the same account ID.
Head of Customer Success Operations
B2B SaaS, 200-person company
New — Querri Wrapped
You ran the analysis.
Querri builds the QBR deck.
The best use of CS ops time isn't formatting slides — it's knowing what the account data means and what to do about it. Querri Wrapped closes the loop: once your analysis is done, Querri's agentic pipeline turns it into a complete, branded CS performance presentation in seconds.
25 slide templates. Interactive Plotly charts. Fullscreen 16:9 presentation mode. Export to PowerPoint or PDF. Renewal pipeline, account health trends, churn signals, and narrative — all in one output ready for the executive review.
Ready to see Querri in action for your specific CS workflows?
Explore our library of step-by-step CS playbooks — each one built around a real customer success job-to-be-done.
Why Querri
Built differently — so CS teams can actually use it.
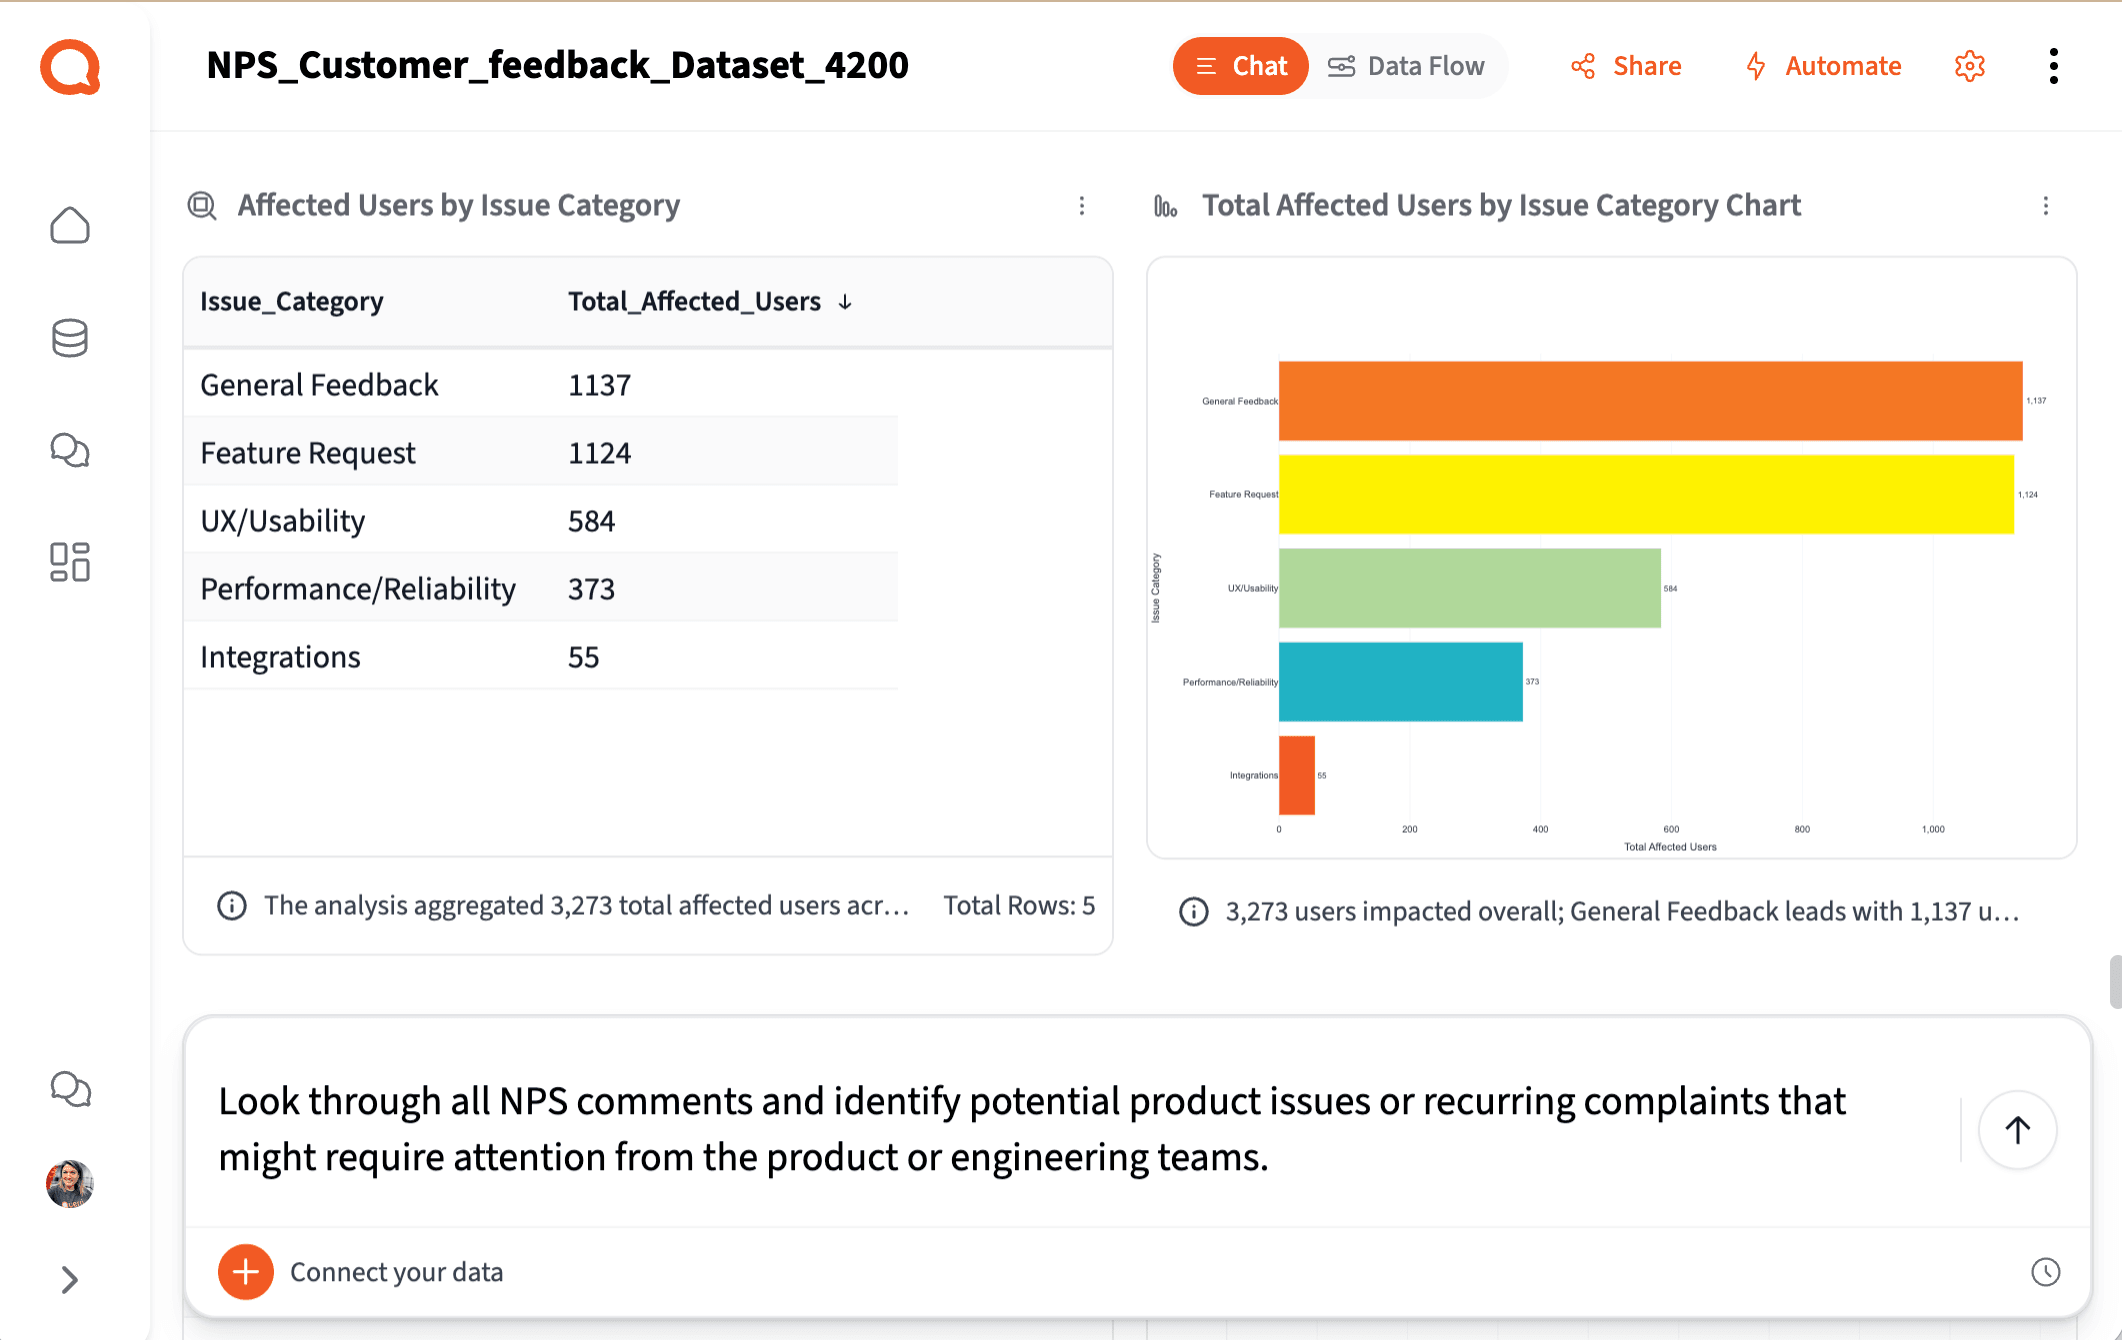
It reads the signals your tools can't.
Tickets, call notes, NPS verbatims — the most important customer signals are unstructured. Querri converts free text into structured columns: complaint themes, sentiment, priority, escalation flags. Signals you couldn't measure before become trackable metrics.
Every analysis is transparent and defensible.
Step-by-step logic you can inspect before you share it with the VP of CS. No black box, no churn predictions you can't explain. When leadership pushes back, you're back in the analysis in seconds.
Self-serve, without the wait.
Ask CS questions in plain English, get answers in minutes — not a two-week BI ticket. Churn signals, health score inputs, account segments — all from the same workspace, no SQL required.
The complete CS analytics workflow. One platform. Any CS ops manager can run it.
Try it freeSecurity & Privacy
Your customer data stays yours.
Customer success data includes renewal values, health scores, escalation records, and strategic account context — among the most sensitive data in the organization. Querri is built for teams that can't afford a data security incident.
SOC 2 Type II Certified
Independently audited →
Encryption in transit and at rest →
All customer account data is encrypted end-to-end. Tenant isolation, RBAC, SSO/MFA, and full audit logging are included at every tier.
Transparent, step-by-step analysis — not a black box →
Every step Querri takes is visible and reviewable. See exactly how a health signal or churn indicator was calculated and validate the answer before you share it with leadership.
Zero data training policy →
Your customer data is never used to train AI models. Customer data is isolated per tenant and never shared or commingled across accounts.
Why Customer Success Teams Choose Querri
Simple ways to do hard things
Talk to your data through a chat interface and watch it transform in a spreadsheet view.
Reliable, repeatable data workflows
Clean, merge, and analyze once. Then set up your data workflows to run on your schedule.
Designed for humans, not machines
It’s not a black box. See an explanation of the data workflows behind every Querri.
Frequently Asked Questions
Why is it so hard to get a complete picture of account health?
Which data sources does Querri work with for Customer Success?
How is Querri different from dedicated CS platforms like Gainsight or ChurnZero?
Can Querri analyze unstructured customer signals like support tickets and NPS verbatims?
How long does it take to build a weekly CS health report?
Can CS ops teams without SQL skills actually use this?
Is Querri secure enough for sensitive customer account data?
How does Querri handle messy exports from multiple CS tools?
What is customer success analytics and why does it matter?
Resources
Go deeper on CS analytics
Step-by-step playbooks and practical guides for the workflows CS teams run every day.
How to Build a QBR Deck from Live Customer Data in Minutes
Build a polished, data-rich QBR presentation — with usage trends, health indicators, support history, and renewal context — without manually pulling data from multiple systems.
How to Track and Improve First Response Time by Channel and Agent
A walkthrough for analyzing FRT across your support channels, identifying breach patterns, and surfacing the agent-level data your SLA reviews need.
11 First Response Time Reporting Mistakes CS Teams Make
The most common FRT measurement errors — from calendar-time miscalculations to bot-inflated averages — and how to fix each one.
Read articleFrom Survey Chaos to Clear Themes: Analyzing NPS Responses at Scale
Turn hundreds of open-ended NPS verbatims into structured themes, sentiment trends, and account-level signals that matter for retention.
Read articleHow to Actually Make Sense of Unstructured Text Data
A practical guide to extracting structured insight from tickets, call notes, and survey verbatims — the customer signals most tools can't read.
Read articleHow to Turn Dashboards into Decision Systems (Not Just Displays)
Why most CS dashboards don't drive action — and how to design account health views that connect signals to next steps.
Read articleClear, Concise Leadership Reporting
Build CS performance summaries your leadership team will actually use — for QBRs, board reviews, and check-ins.
Read articleCustomer Segmentation: The Complete Guide for Data-Driven Teams
Segment accounts by behavior, risk, and value — and keep those segments consistent across systems.
Read articleYour customers are signaling churn before it happens. Querri helps you see it.
Connect your CS data stack, extract risk signals from the text your tools can't read, and build the account health view your team actually trusts.