The 10 KPIs That Actually Matter in a Weekly Marketing Performance Report (And 5 Vanity Metrics to Drop)
Most weekly marketing performance reports are full of vanity metrics that look impressive but drive no decisions. This guide breaks down the 10 weekly marketing report KPIs that actually matter — from marketing-sourced pipeline to opportunity conversion rate — and the 5 metrics to stop tracking.

Most marketing performance reports fail for the same reason: they measure activity instead of impact.
You've probably seen them — slides full of impressions, page views, and follower growth. The numbers look impressive, but they rarely answer the questions leadership actually cares about:
- Are our campaigns generating pipeline?
- Which channels deserve more budget?
- What changed this week that requires action?
A great weekly marketing performance report isn't a list of metrics. It's a decision-making tool that helps marketing teams understand what's working, what isn't, and what to do next.
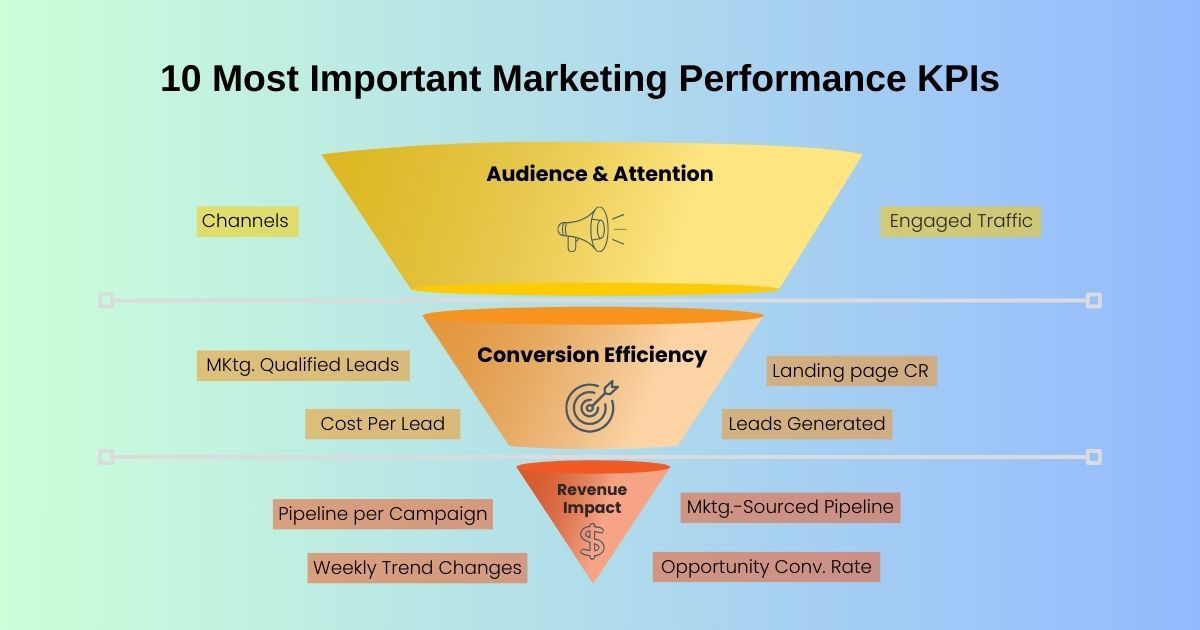
The best reports follow a simple framework: The Marketing Performance Pyramid.
Level 1: Audience & Attention
These metrics tell you whether your marketing is reaching the right people.
1. Website Sessions by Channel
Shows where traffic originates — organic, paid, social, or referral — and reveals which channels deserve more investment.
2. Engaged Traffic
Time on site, engaged sessions, or pages per visit help distinguish meaningful traffic from accidental clicks.
Level 2: Conversion Efficiency
Once visitors arrive, the question becomes: do they convert?
3. Landing Page Conversion Rate
A key indicator of campaign efficiency. If traffic increases but conversions drop, the problem is usually messaging, targeting, or page design.
4. Leads Generated
Lead volume indicates whether marketing is feeding the pipeline consistently.
5. Marketing Qualified Leads (MQLs)
Not all leads are equal. MQLs signal leads that meet criteria indicating potential buying intent.
6. Cost per Lead (CPL)
Helps evaluate marketing efficiency. But context matters: a lower CPL doesn't help if lead quality declines.
Level 3: Revenue Impact
This is where marketing performance becomes meaningful to executives.
7. Marketing-Sourced Pipeline
The total value of opportunities created by marketing campaigns.
8. Opportunity Conversion Rate
Tracks how often leads become real sales opportunities — a key indicator of lead quality.
9. Pipeline per Campaign
Shows which campaigns produce the most pipeline relative to their cost.
10. Week-over-Week Trend Changes
The most valuable insight often comes from change. Sudden increases or drops in performance usually reveal the most important signals.
The Vanity Metrics to Drop
Many marketing reports still highlight metrics that rarely influence decisions:
- Social media follower counts
- Total page views
- Ad impressions
- Email open rates
- Raw traffic without engagement context
These metrics describe visibility, not impact.
Why Weekly Reports Matter
Weekly marketing reporting creates a continuous learning loop.
Instead of waiting until the end of the quarter to analyze performance, teams can quickly identify changes such as campaigns suddenly outperforming expectations, traffic declines caused by SEO or technical issues, or rising acquisition costs. This enables faster decisions — adjusting budgets, optimizing campaigns, and reallocating resources before problems grow.
How Weekly Reports Power Your QBR
Your quarterly business review shouldn't feel like a surprise. If you track the right KPIs weekly, the QBR becomes a story of trends that have unfolded over time.
A strong marketing QBR answers four executive questions:
- What changed this quarter?
- Why did it change?
- What did we learn?
- What will we do next?
Weekly reports provide the evidence that supports that narrative.
Why Automation Matters
The challenge is that marketing data rarely lives in one place. Analytics platforms, ad networks, CRM systems, and campaign tools all generate their own reports. Manually compiling them every week is slow, error-prone, and often inconsistent.
Automating these reports ensures that data is collected, cleaned, and standardized consistently while freeing marketing teams to focus on interpreting insights rather than assembling spreadsheets.
Platforms like Querri help marketing teams bring data together from multiple sources, automatically clean and structure it, and analyze performance using natural-language queries. The result is a single workspace where teams can build dashboards, surface insights, and present clear, narrative-driven reports that make marketing's impact visible to leadership.
Ready to build this report for your team? The Weekly Marketing Reporting Playbook walks you through exactly how to set it up in Querri — from connecting your data sources to generating the narrative summary.
Tags