Which deals in this quarter's forecast are actually real?
Audit the committed number with evidence instead of opinion. Join Salesforce opportunities and stage history, HubSpot engagement, and Amplitude product usage in Querri, then split the forecast into high, medium, and low confidence tiers with dollar totals your CFO can act on.
Open QuerriWhat you'll need
Querri (Free trial) to join the three systems, score every open deal, and build the executive view
Salesforce, HubSpot, and Amplitude exports — Step 1 lists exactly what to pull from each
An account ID and your quarterly targets — to line the three systems up and measure against the number
Free resources
Start your free trial here →Sample data sets
Synthetic demo datasets covering 900 opportunities across five quarters, not real customer data. Safe to download and explore. Follow along and you'll get the same numbers you see below.
Need help?
If you have any questions, you can request a demo or email our team.
Before we begin
Every forecast review runs on the same currency: what the sales team believes. Stage, probability, forecast category, and a close date that has quietly moved twice. It's not dishonest, it's just unverified, and by week ten of the quarter nobody can tell the difference between a deal that is closing and a deal that is being talked about.
This playbook builds the other view. One row per open opportunity, enriched with evidence from outside the CRM: whether the buyer is still responding, whether the decision-maker has shown up in the last month, whether the account is actually using the product, and how deals with this exact signal pattern have historically closed. Then it splits the quarter into high, medium, and low confidence with dollar totals, and names the deals driving the gap.
How it works:
- • Upload Salesforce opportunities with stage and close-date history, HubSpot engagement activity, and Amplitude account usage with a product-access flag
- • Clean the pipeline: flag stale close dates, missing next steps, repeated pushes, and stage-time outliers
- • Score each open deal on buyer engagement and product usage, then test every signal against your own closed deals before you trust it
- • Split the forecast into high, medium, and low confidence tiers with dollar totals
- • Produce the executive view: the committed number, the at-risk number, the upside, and the specific deals driving the gap
Follow the steps
Upload Salesforce, HubSpot, and Amplitude
Bring all three systems into one project. Each one answers a different question, so bring the pieces that let it do that:
- •
Salesforce — open and closed opportunities (the closed ones are your evidence base), opportunity field history so you can reconstruct stage and close-date changes, and contact roles so you know who is actually on the deal.
- •
HubSpot — engagement activity at the event level. One row per email, call, meeting, or form, each with a direction and an outcome.
- •
Amplitude — account-level weekly usage, plus a product-access table that says whether usage applies to that account at all.
Add your quarterly revenue targets and that's everything. Querri profiles every file and works out how they relate.
Tip: Include at least four quarters of closed opportunities. You cannot call a deal high confidence until you can show which signal combinations actually closed, and that requires closed-won and closed-lost history, not just the open pipeline. This sample spans five quarters and 900 opportunities.
Clean the pipeline before you score it
Start with the hygiene problems that inflate every forecast: close dates that have already passed, deals with no documented next step, close dates that have been pushed more than once, and deals sitting in a stage far longer than deals that actually won. Ask Querri to reconstruct each deal's history and flag them:
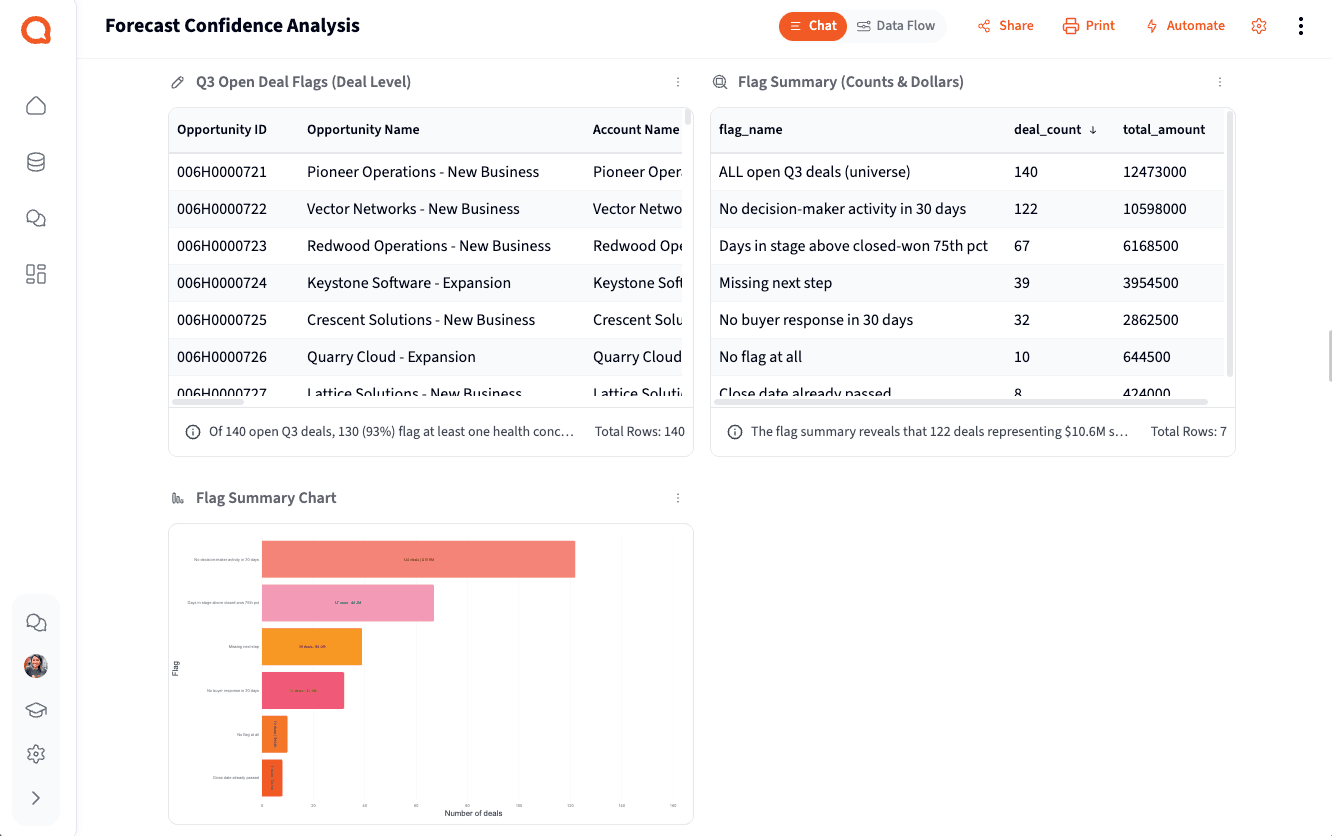
"For every open opportunity closing in 2026-Q3, use the opportunity field history to calculate days in the current stage, the number of times the close date has been pushed out, and total days pushed. Flag close dates that have already passed, missing next steps, and any deal whose days in stage exceed the 75th percentile for that stage among closed-won deals. Show deal counts and dollar amounts per flag."
The quarter's open pipeline is 140 deals worth $12,473,000, and 130 of them carry at least one flag. Only 10 deals, $644,500, come through clean. The single biggest problem isn't the close date, it's the buying committee: 122 deals worth $10,598,000 have had no decision-maker activity in 30 days.
Score the evidence, then test it against your own closed deals
Now score engagement and usage per deal, and separate buyer engagement from sales effort. Ten unanswered outbound emails are not evidence. A reply, a held meeting, a connected call, or a form submission is. Then prove the signals work by scoring your closed deals as they looked 14 days before they closed:
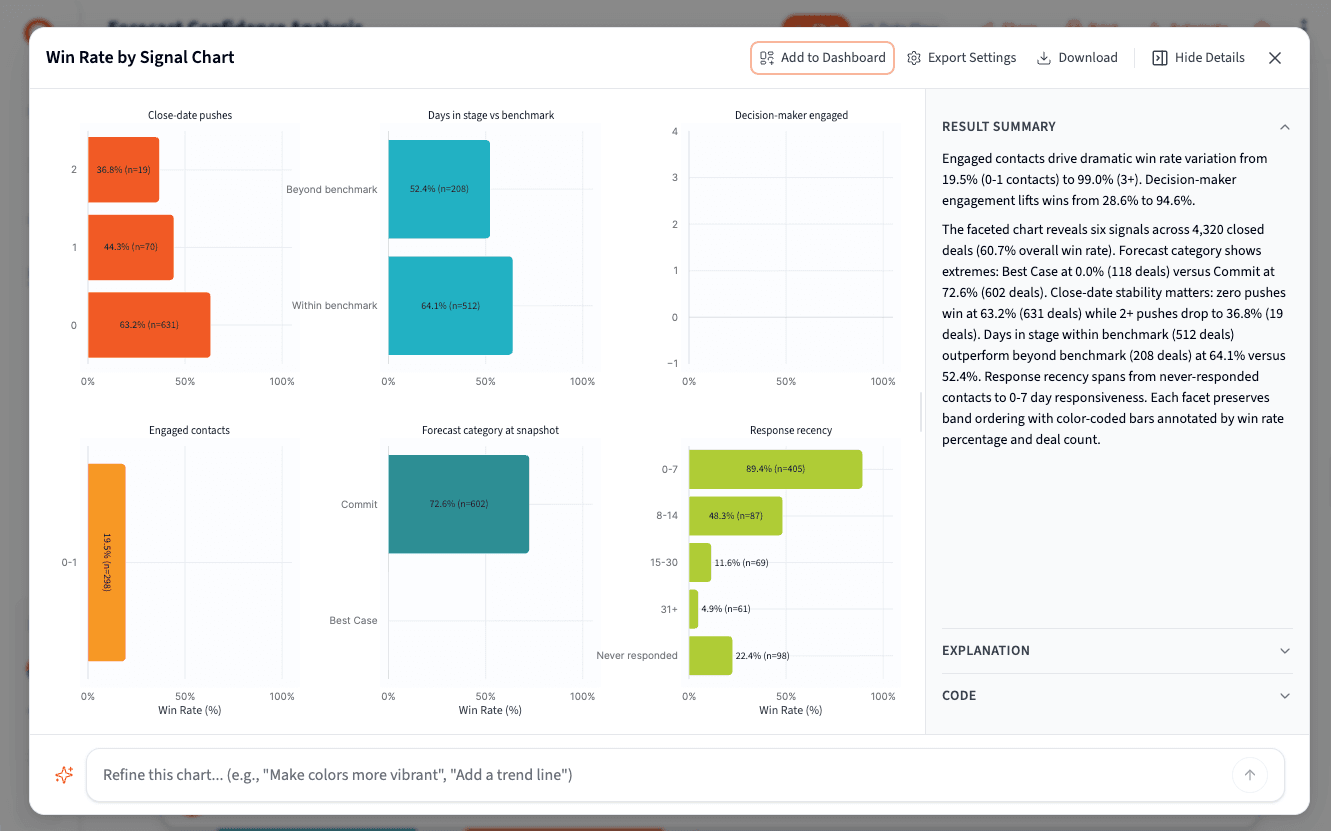
"For each opportunity, count buyer-initiated engagement only: inbound email replies, meetings held, connected calls, and form submissions. Calculate days since the last buyer response, meetings held in the last 30 days, unique engaged contacts, and whether an economic buyer or decision-maker engaged in the last 30 days. Then score every closed opportunity as of its close date minus 14 days and show the win rate for each signal band."
Across 720 closed deals the base win rate is 60.7%. Engagement recency splits it violently: a buyer response inside 7 days is worth 89%, past 30 days it collapses to 5%. Decision-maker involvement is just as stark, 94.6% against 28.6%, and three or more engaged contacts wins 99% of the time where single-threaded deals win 19.5%. The CRM's own category was informative too: every deal still sitting in Best Case 14 days out lost, all 118 of them.
Split the forecast into confidence tiers
Now tier the open pipeline on the signals that survived the test: engagement recency, decision-maker involvement, multi-threading, close-date stability, and stage duration against the won-deal norm. High confidence requires recent buyer contact, an active decision-maker, at most one push, and a stage duration inside the norm. Low confidence is where the evidence is missing, not merely thin:
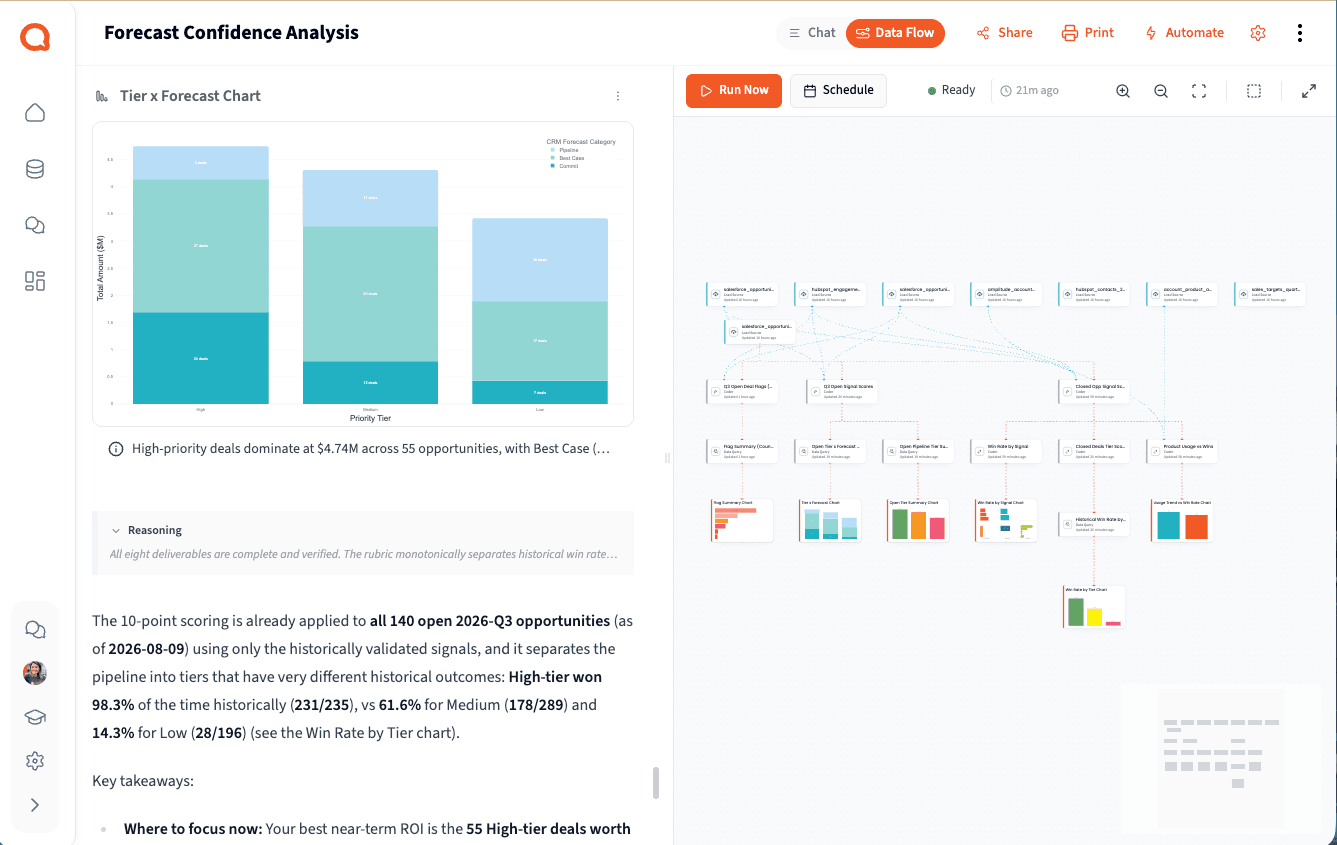
"Score every open 2026-Q3 opportunity on engagement recency, decision-maker activity, engaged contacts, close-date pushes, and stage duration versus the won-deal benchmark. Assign High, Medium, or Low confidence, then show deal counts and dollar totals per tier, cross-tabbed against the CRM forecast category, and attach the historical win rate for each tier."
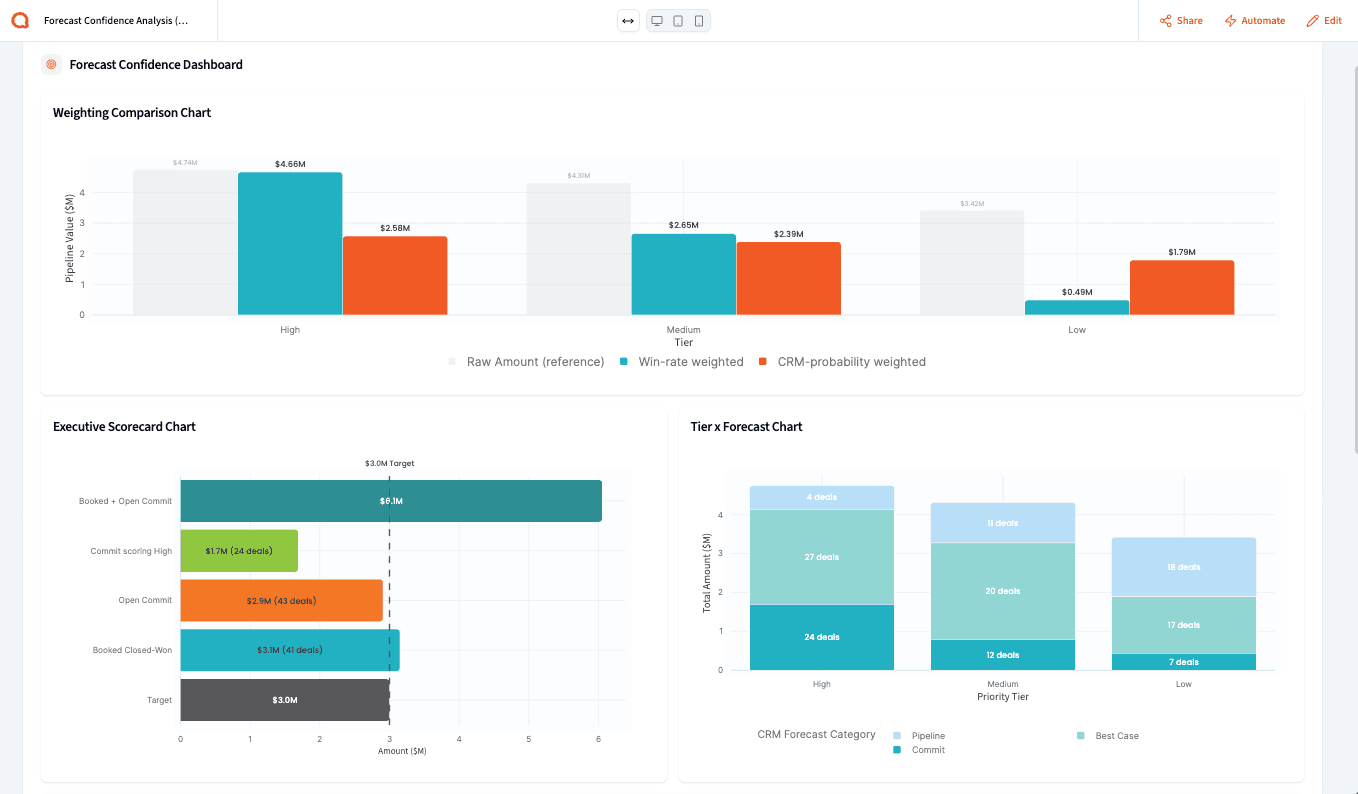
$3,420,000 of the open pipeline, 27% of it, sits in the bottom tier, where comparable historical deals won 14.3% of the time. And the tiers cut across the CRM categories rather than tracking them: $432,500 of Commit scores Low, while $3,055,000 of high-confidence business sits outside Commit entirely.
Produce the executive view
The last step turns the tiers into the four numbers an executive team actually needs, then names the deals driving the gap with the specific missing evidence next to each one, so the meeting is about actions rather than adjectives.
Booked
$3,148,500
41 deals won, 105% of target
Committed
$2,905,500
43 open deals on top of booked
At risk
$1,895,500
24 of those deals, no evidence
Upside
$3,055,000
31 strong deals not in Commit
The narrative Querri writes:
The quarter's target is already covered by booked business. The exposure is in what has been promised on top of it.
- • Only 58% of that committed number ($1,689,000 across 24 deals) is backed by recent buyer engagement, an active decision-maker and a stable close date.
- • The at-risk block sits in the tier where comparable deals historically won 14.3% of the time, and $3,055,000 of high-confidence business isn't in Commit at all. The forecast is wrong in both directions.
- • The fastest fix isn't a pricing approval. It's a meeting with an economic buyer on those 24 deals.
What you can create or export:
- A one-page executive forecast view: booked, committed, at risk, upside, and the named gap drivers
- The deal-level scoring table with every signal and flag, exportable to Excel, CSV, or Google Sheets
- A live dashboard your revenue team can open on Monday, refreshed on a schedule
- A narrative-driven presentation for the forecast call or board meeting, exported to PDF or PowerPoint
- A saved project you can re-run weekly, so tier movement week over week becomes its own early-warning signal
Tips for a forecast review people actually trust
Separate buyer engagement from sales effort
Ten unanswered outbound emails make a deal look active and change nothing about whether it will close. Count only buyer-initiated evidence: inbound replies, meetings held, connected calls, high-intent form submissions. In this dataset that one distinction is the difference between an 89% win rate and a 5% one.
Validate every signal before it moves a dollar
Score your closed deals as they looked two weeks before they closed, then check which signal bands actually separated won from lost. Here engagement recency and decision-maker involvement were decisive and product usage was not. Had we scored usage on instinct, the tiers would have been confidently wrong.
Report the composition, not just the total
Weighted two ways, this quarter's open pipeline comes out a million dollars apart, and the tiers cut across the CRM's categories in both directions: Commit deals with no supporting evidence, high-confidence deals nobody has committed. A total that happens to look reasonable, built from deals that are misfiled, will still cost you the quarter. Show the tiers, not the sum.
Run it the same way every week
Consistency beats sophistication. Save the analysis as a project in Querri and schedule it, so the tier a deal was in last week is comparable to this week. A deal sliding from High to Low is often a clearer warning than any single flag, and it arrives while you can still do something about it.
Have a Data Dictionary? Bring it. Don't have one? Build a first draft in Querri.
A Data Dictionary documents what the fields in your data mean, how important business terms are defined, and how different systems relate to one another. Forecast analysis is unusually dependent on it, because almost every term is contested: what counts as buyer engagement, which roles qualify as decision-makers, when a close-date change counts as a push, and what "Commit" is supposed to mean in your company. The sample datasets below use field names close to the Salesforce, HubSpot, and Amplitude defaults, so Querri can infer a lot on its own, but the definitions that decide a forecast are yours to state.
Show me how to bring or build one
If you already have a Data Dictionary
Upload it alongside the data and tell Querri how you want it used. Querri can work across multiple Sources in one project, investigate their structure and contents, identify data types and relationships, and join Sources when needed.
"Use our Data Dictionary as the reference for interpreting the Salesforce, HubSpot, and Amplitude data in this project. Use its definitions for stages, forecast categories, contact roles, and engagement outcomes. If the data appears to conflict with the dictionary, flag the conflict rather than making an assumption."
If you don't have a Data Dictionary
Use Querri to create a useful first draft. Upload the Sources you want documented, then ask Querri to inspect them and build a table with everything a good dictionary needs:
- Source name
- Field or column name
- Inferred data type
- Example values
- Likely business meaning
- Possible relationships to fields in other Sources
- Questions or ambiguities that need human clarification
"Review the Sources in this project and create a first-pass Data Dictionary. For every field, show the Source, field name, inferred data type, example values, likely business meaning, and any fields that appear useful for joining Sources. Flag definitions you cannot determine confidently instead of guessing."
Then add the business context only your team knows
Querri can infer a great deal from the data itself, but the definitions that decide a forecast come from your team. Querri can see that an activity has an outcome of "Replied" and a direction of "Inbound"; only you can say that this is what your company counts as buyer engagement. Rules like these can't be learned from the data alone:
- • Buyer engagement means inbound replies, meetings held, connected calls, and form submissions, not email opens or sequence enrollments
- • Economic Buyer, Decision Maker, and Executive Sponsor are the roles that count as decision-maker involvement
- • A close-date change only counts as a push when the new date is later than the old one
- • Product usage applies to customers, trials, and pilots, and never to accounts with no product access
- • Stage-duration outliers are measured against the 75th percentile for closed-won deals, not against an average
Save your standard definitions once
When a definition is a company standard, save it once instead of restating it in every chat. Add organization-wide rules in Context Settings, and Querri applies them automatically to every analysis your team runs. For the bigger picture, the Querri Library is where your company's data context lives: it learns your business and keeps your sources, definitions, and business rules consistent everywhere. Once your dictionary looks right, you can export it to CSV or Excel for use outside Querri.
A good Data Dictionary gets better with human review
Think of Querri's generated dictionary as a starting point, not the final authority. Querri does the tedious part: profiling fields and proposing definitions. Your team confirms the business meaning, corrects the ambiguous ones, and adds the rules that can't be learned from the data. In a forecast review that shared reference is worth as much as the analysis, because it moves the argument off what the numbers mean and onto what to do about them.
Frequently asked questions
What does "forecast confidence" actually mean?
Why not just use the CRM probability field?
Which signals actually predicted wins?
Should product usage lower a deal's confidence score?
How do you avoid look-ahead bias when you test the scoring rules?
What if the three systems don't share an account ID?
Do I need historical forecast snapshots to do this?
How often should this run?
What do I do with the low-confidence deals?
Other popular resources
Playbook
Weekly pipeline coverage
Build a coverage report that strips out false signal.
Playbook
Weekly RevOps exec report
Replace the Monday morning CRM scramble.
Demo
Request a walkthrough
See Querri in action with your own data.
Pricing
Compare plans
Find the right plan for individuals, teams, or enterprise.