How to Automate Your Weekly Pipeline Coverage Report
Stop guessing at pipeline health. Build a weekly coverage report that cleans and standardizes your data, surfaces real coverage gaps, and gives your revenue team the clarity they need to forecast with confidence.
Open QuerriWhat you'll need
Querri (Free trial) to connect your CRM data, analyze pipeline coverage, and generate reports your team can act on
HubSpot or Salesforce — connect via HubSpot connector, or upload a CSV export from Salesforce or any other CRM
Optional: quota targets file — uploaded as Excel or CSV to calculate coverage ratios by rep, team, or region
Need help?
If you have any questions, you can request a demo or email our team.
Before we begin
Pipeline coverage is one of the most quoted metrics in RevOps and one of the least trusted. Teams celebrate "3x pipeline" while quietly knowing what's underneath: stale deals, padded amounts, and opportunities that will never close. It creates a dangerous illusion of control until the quarter falls apart.
This playbook is about building a pipeline coverage report that tells the truth: one that strips out false signal, reflects real deal health, and gives you an honest view of what will actually close.
How it works:
- • Upload deal/opportunity and quota targets export (CSV or XLSX) from HubSpot or other CRM source
- • Ask Querri to unify, clean, and standardize your data across sources so it's ready for accurate analysis
- • Run a prompt to flag stale data
- • Run prompts to create pipeline coverage by quarter, region, owner, or however you wish to slice and dice the data
- • Review, ask Querri to add strategic recommendations and create a dashboard of your liking
- • Optionally, ask Querri to create a presentation from your dashboard and export it to PDF or PowerPoint for a beautifully animated, narrative-driven presentation
- • Save as a reusable template. Your next pipeline coverage report will run automatically on schedule.
Follow the steps
Connect your CRM data
Upload CSV or Excel exports of your deal and opportunity data from HubSpot, Salesforce, or any other CRM. If you're on HubSpot, you can connect directly via Querri's native connector. Querri handles the data profiling and preparation automatically.
Tip: Include your quota targets file as a separate Excel or CSV upload. Querri will use it to calculate accurate coverage ratios by rep, team, or region.

Clean your data and flag stale deals
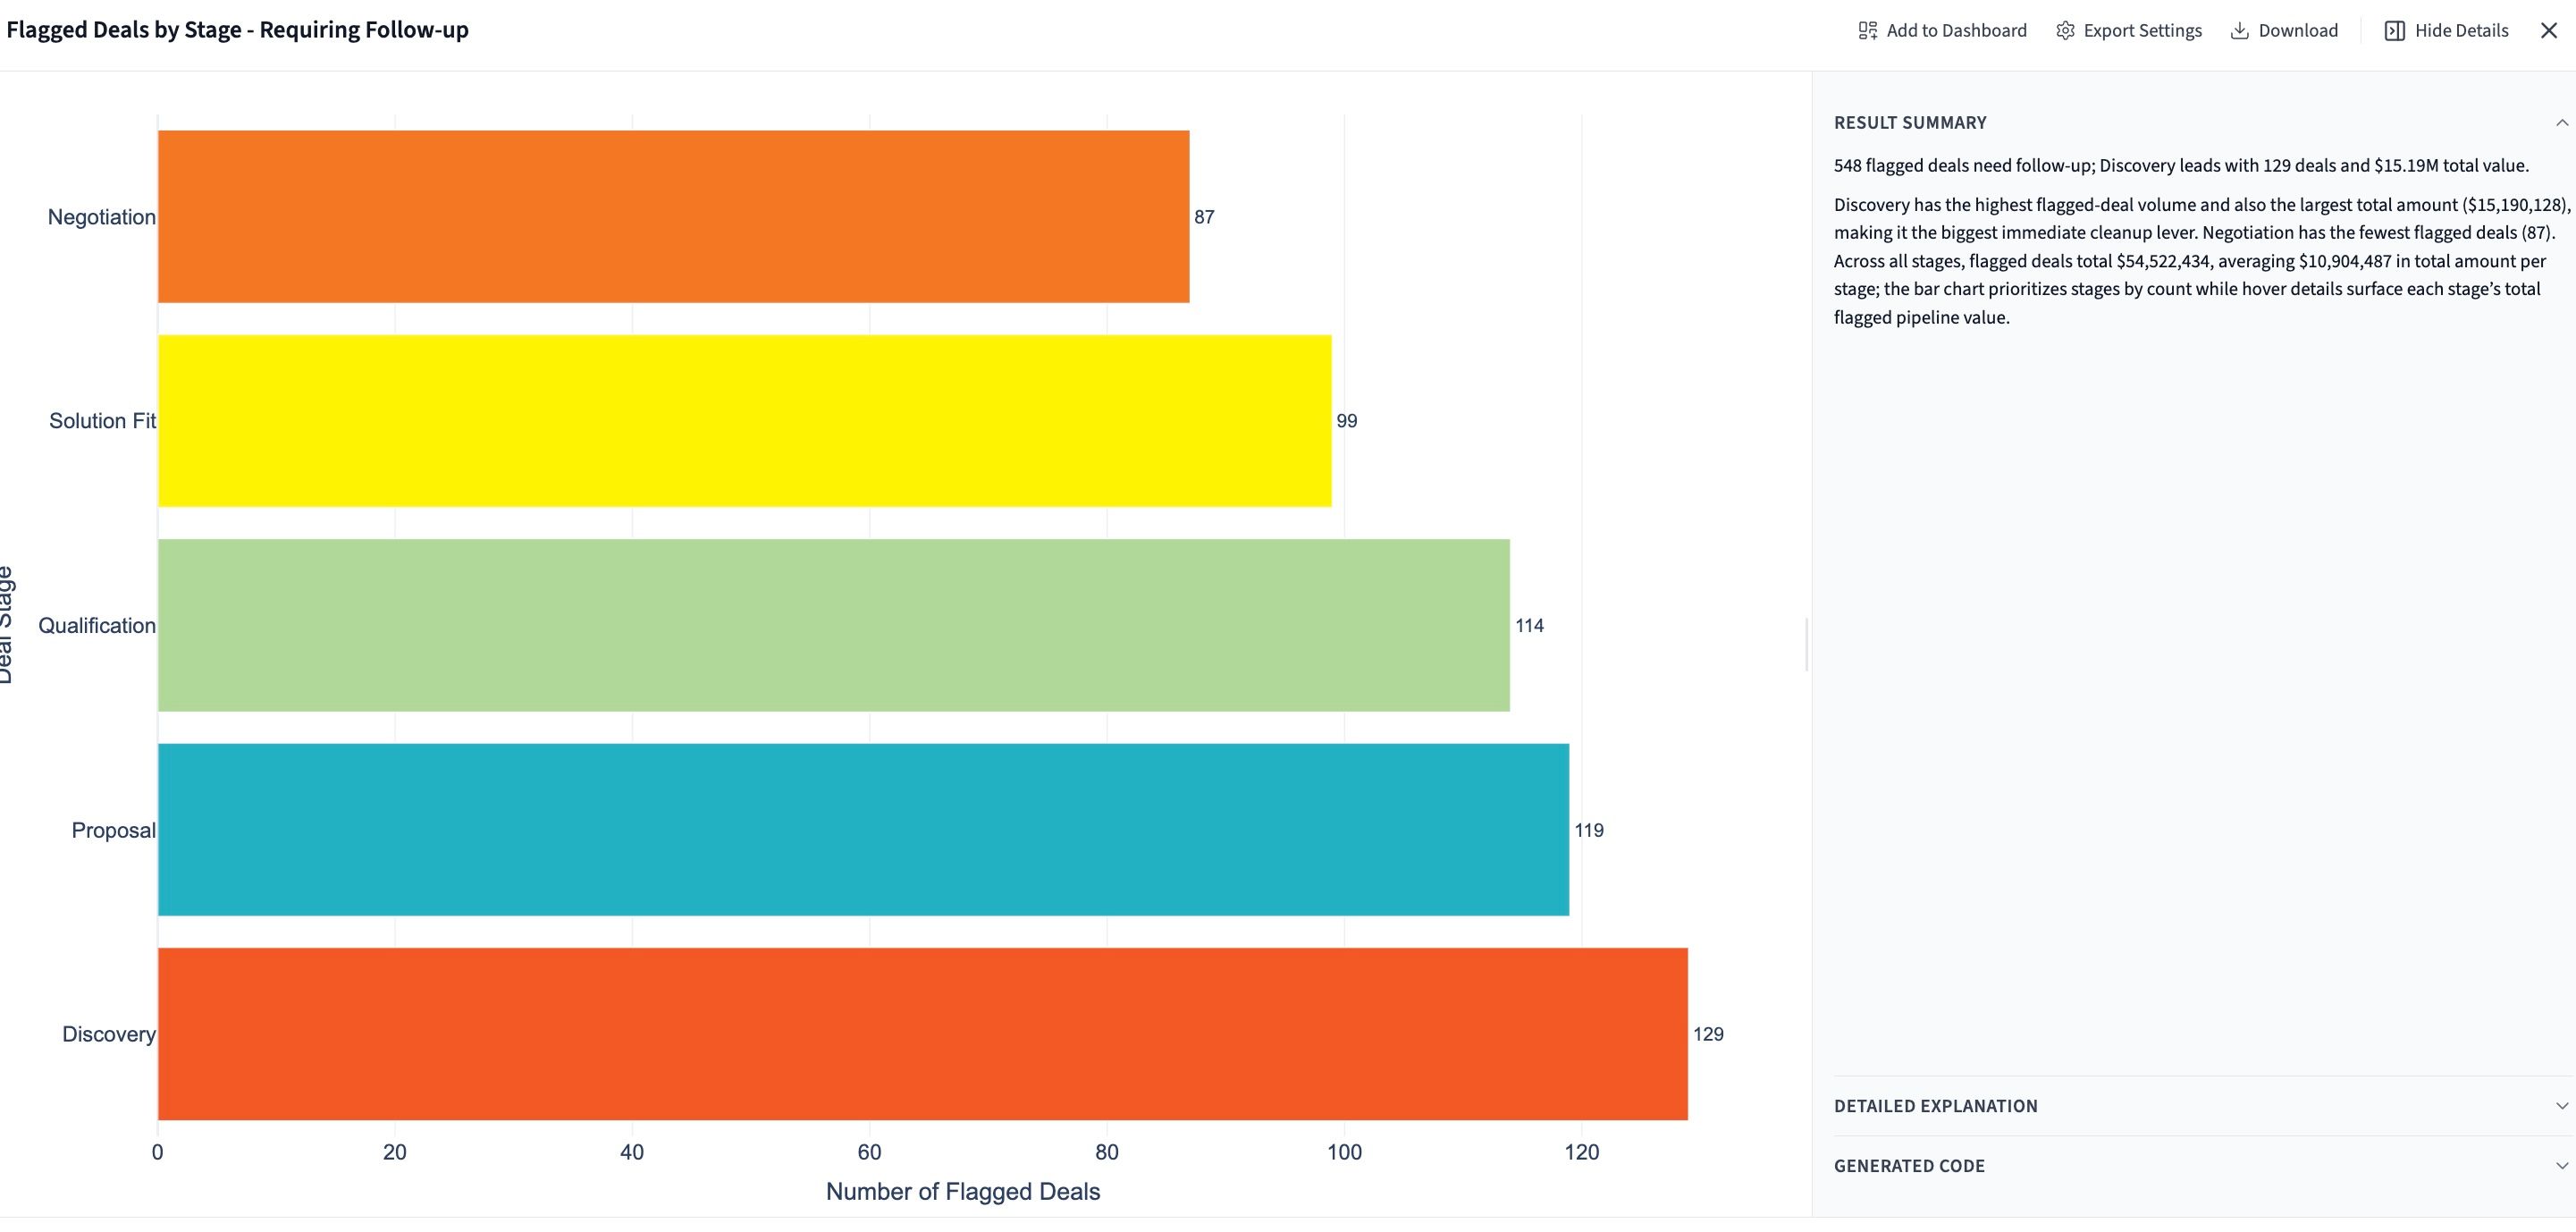
If your CRM data needs further cleaning or standardization, you can do it with simple prompts. You can also flag stale deals that shouldn't be counted toward real coverage:
"Flag any open opportunities that haven't had activity in the last 60 days as stale."
Querri identifies and tags stale deals automatically, so they don't inflate your coverage numbers, giving you a cleaner, more honest view of pipeline health.
Uncover insights that would have taken hours to find
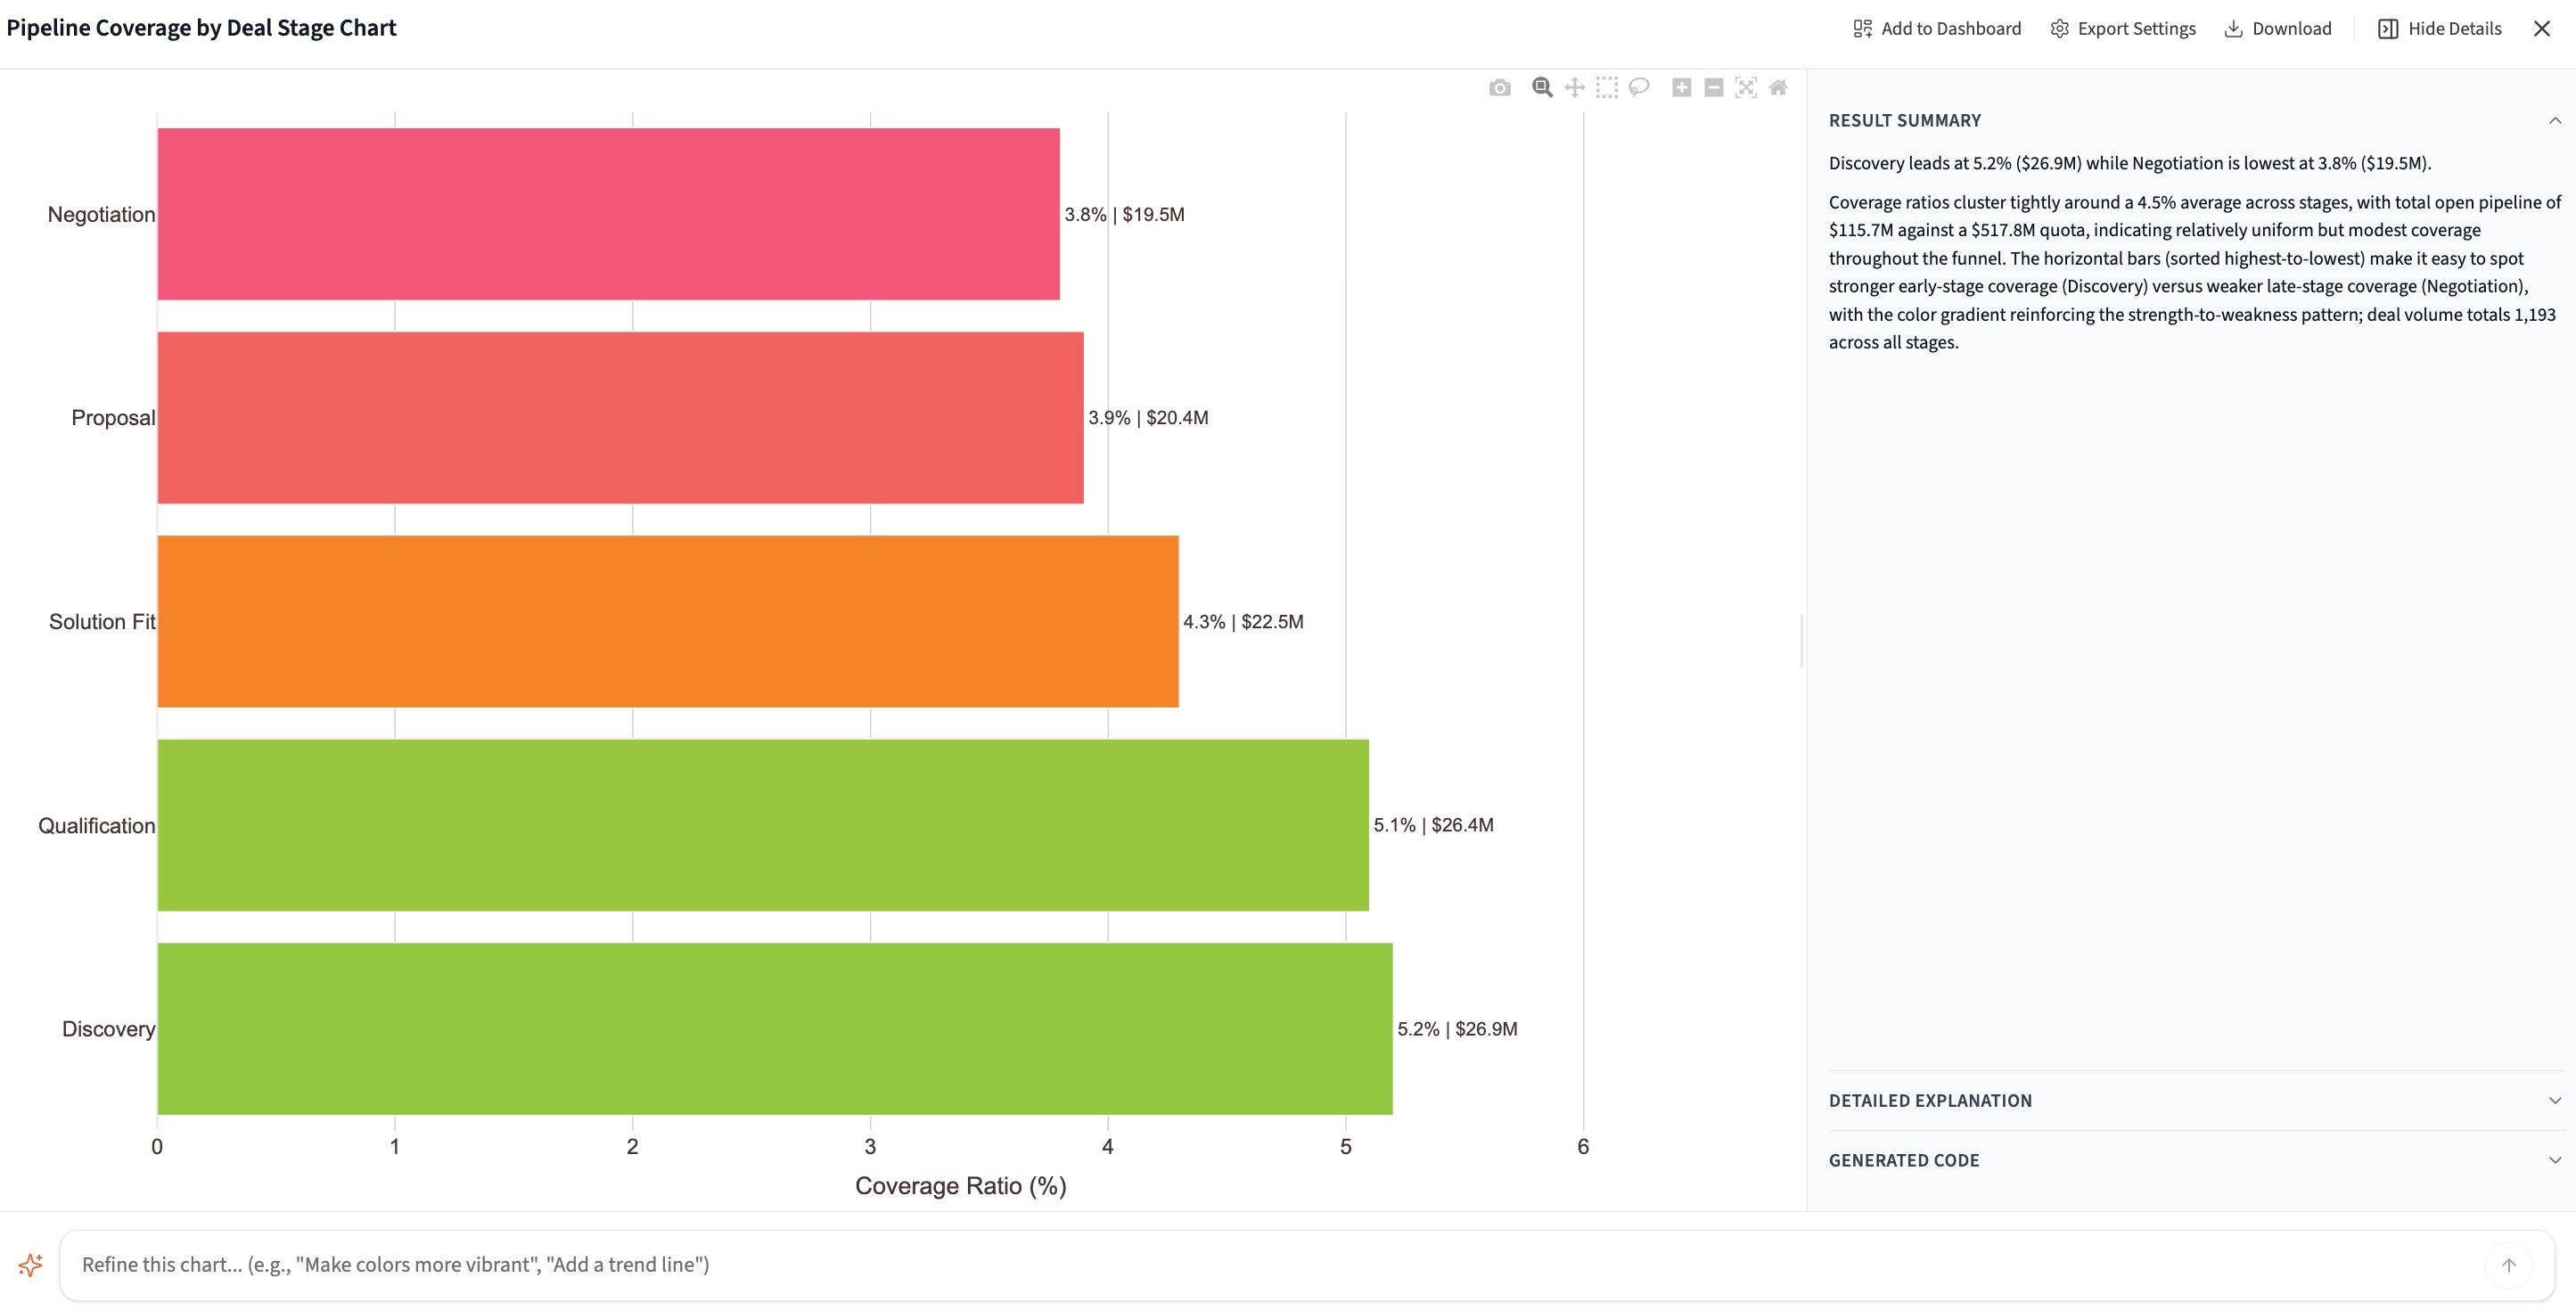
Generate a pipeline coverage report sliced any way you need: by quarter, deal owner, region, category, or any other dimension:
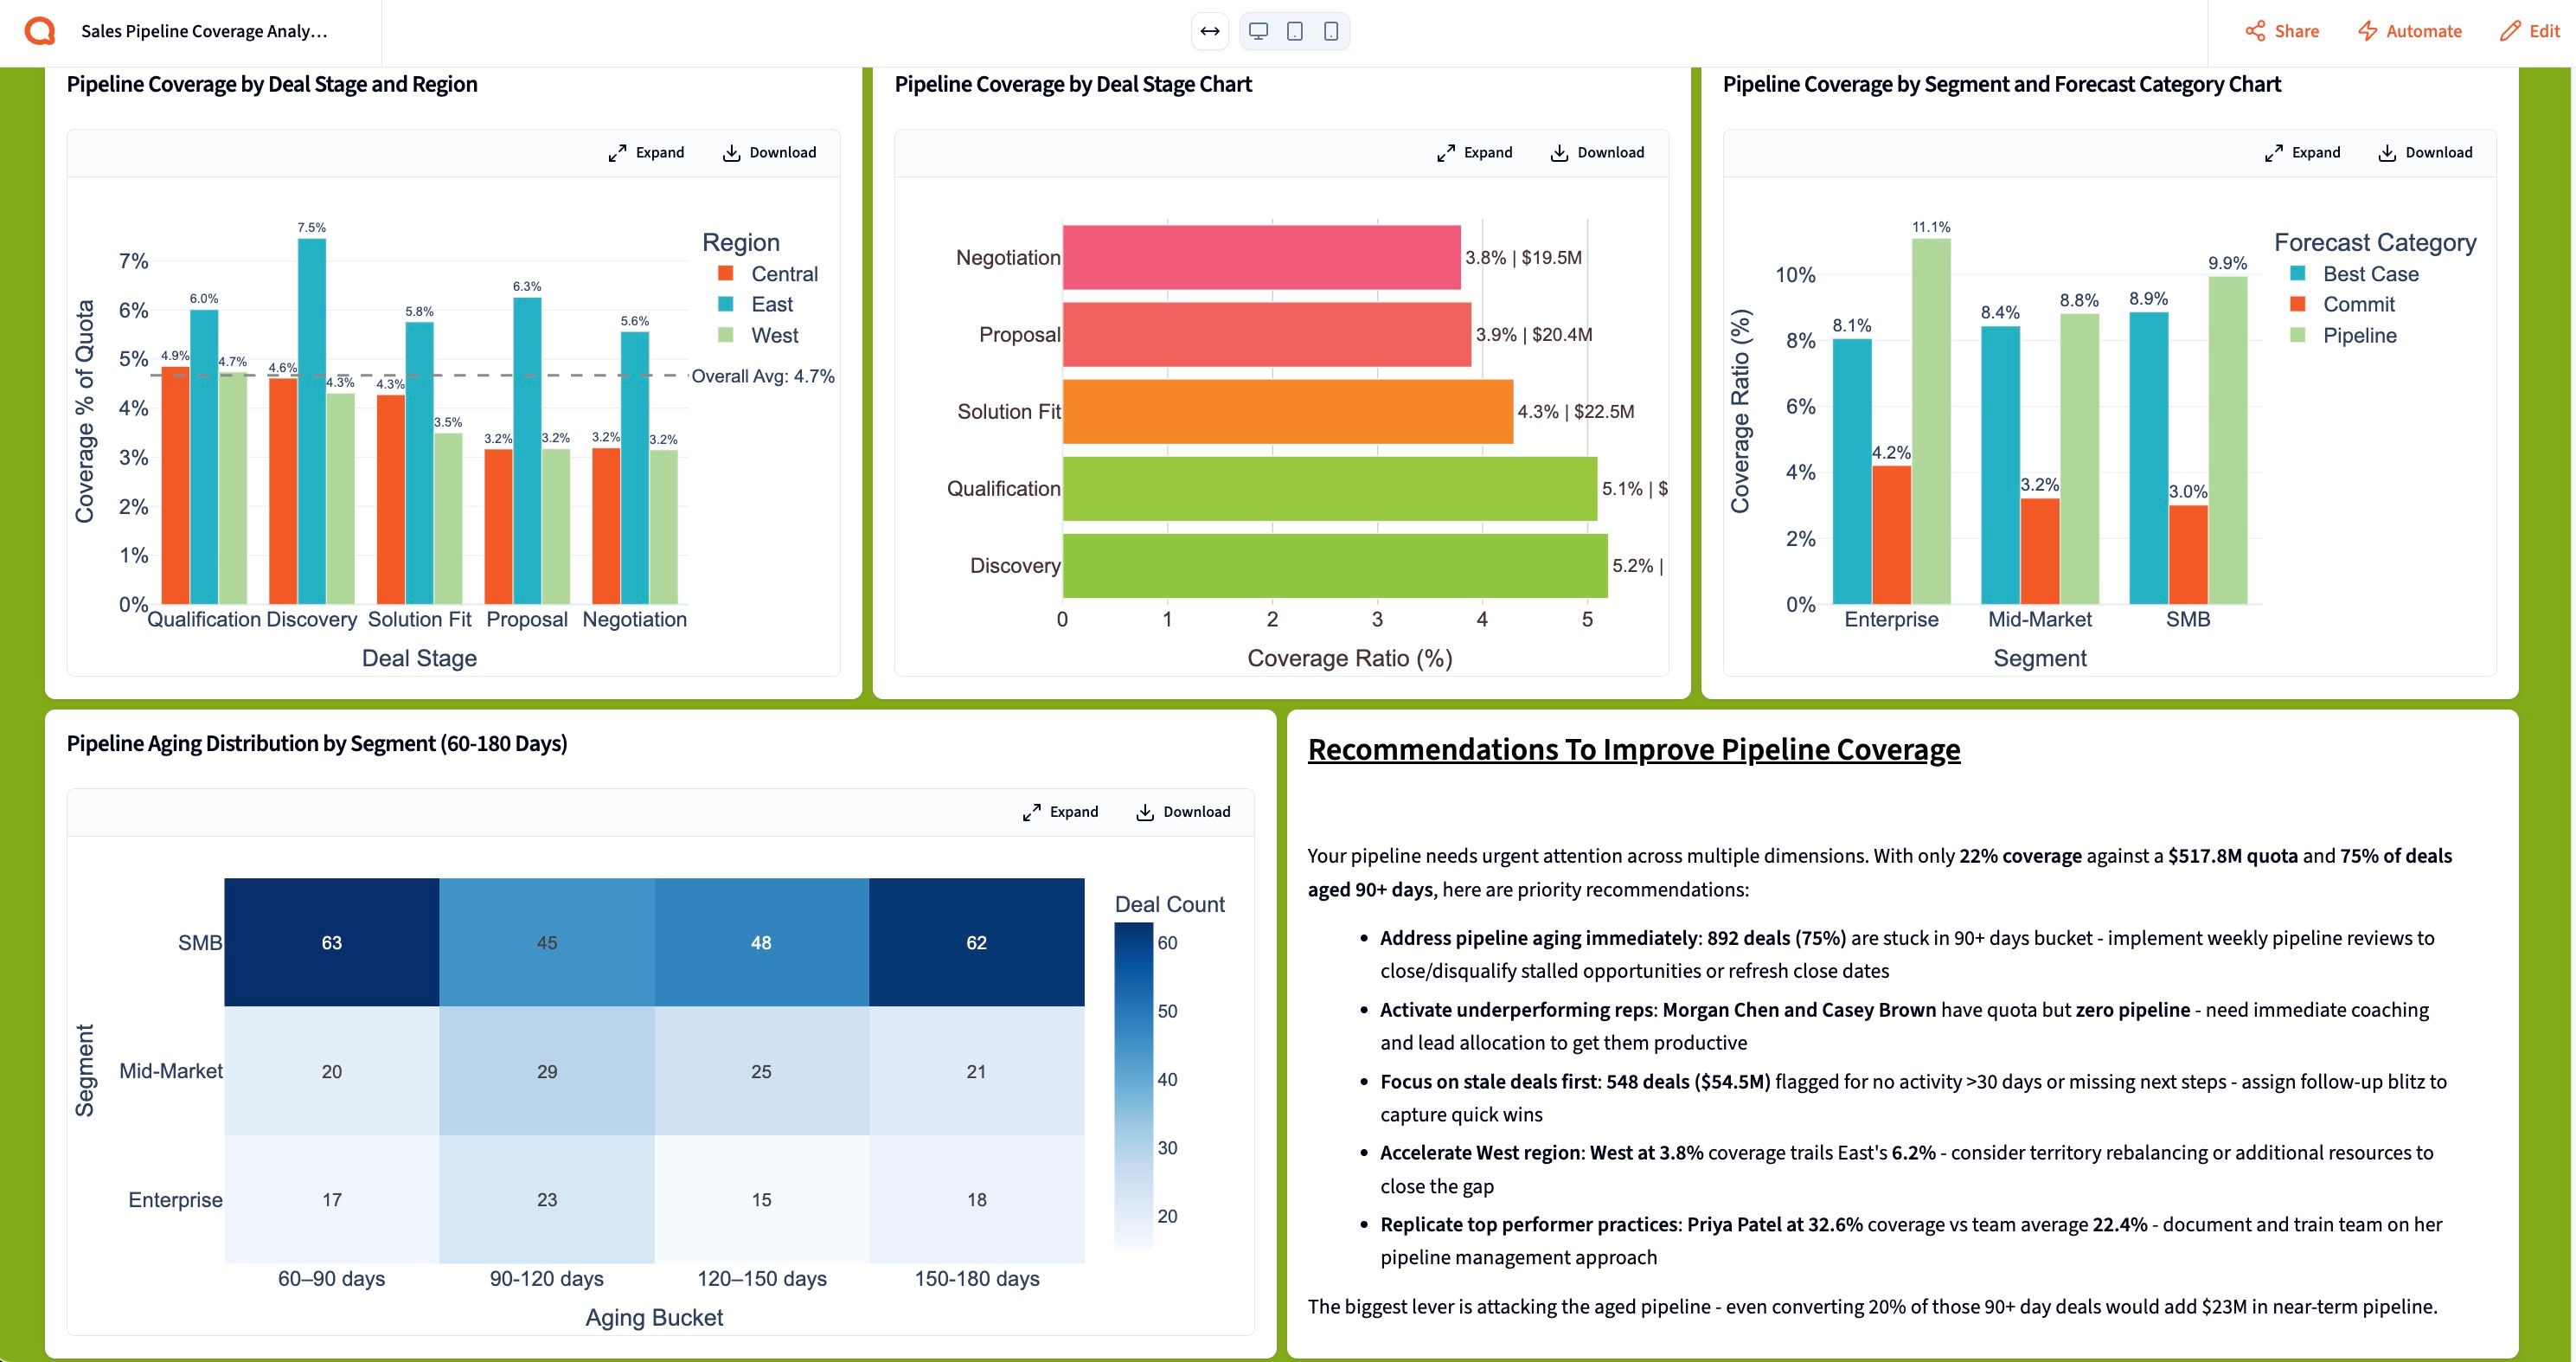
"Create a pipeline coverage report with appropriate visualizations, segmented by quarter, region, and deal category."
Querri analyzes the data, identifies trends and anomalies, and produces a pipeline coverage report the way an expert data analyst would. In minutes, not hours.
Generate executive-level presentations and reports
From here, you can add your data and visualizations to a live dashboard and share it with your team for ongoing monitoring. Or generate a compelling, narrative-driven presentation ready to share with the executive team:
- Build a live dashboard and share it with your sales or RevOps team
- Generate a narrative-driven presentation and export it as PDF or PowerPoint
- Save as a reusable template. Your next pipeline coverage report will run automatically on schedule.
Tips for better pipeline coverage reports
Define what "qualified pipeline" actually means
Before running any report, align your team on what counts as a valid opportunity: minimum deal size, required fields populated, stages that qualify. Querri can filter to only include deals that meet your criteria, so your coverage ratio reflects reality, not wishful thinking.
Flag stale deals every single week
Deals with no activity in 30–60 days are rarely going to close. Make flagging stale pipeline a weekly ritual, not a quarterly cleanup. Querri can automate this check so your report never quietly inflates coverage with zombie deals.
Report coverage at multiple stages, not just total pipeline
A single "3x coverage" headline masks where pipeline is thin. Break it down by stage: early, mid, and late. That way you can see whether you have enough deals ready to close this quarter versus next. Querri makes this segmentation instant.
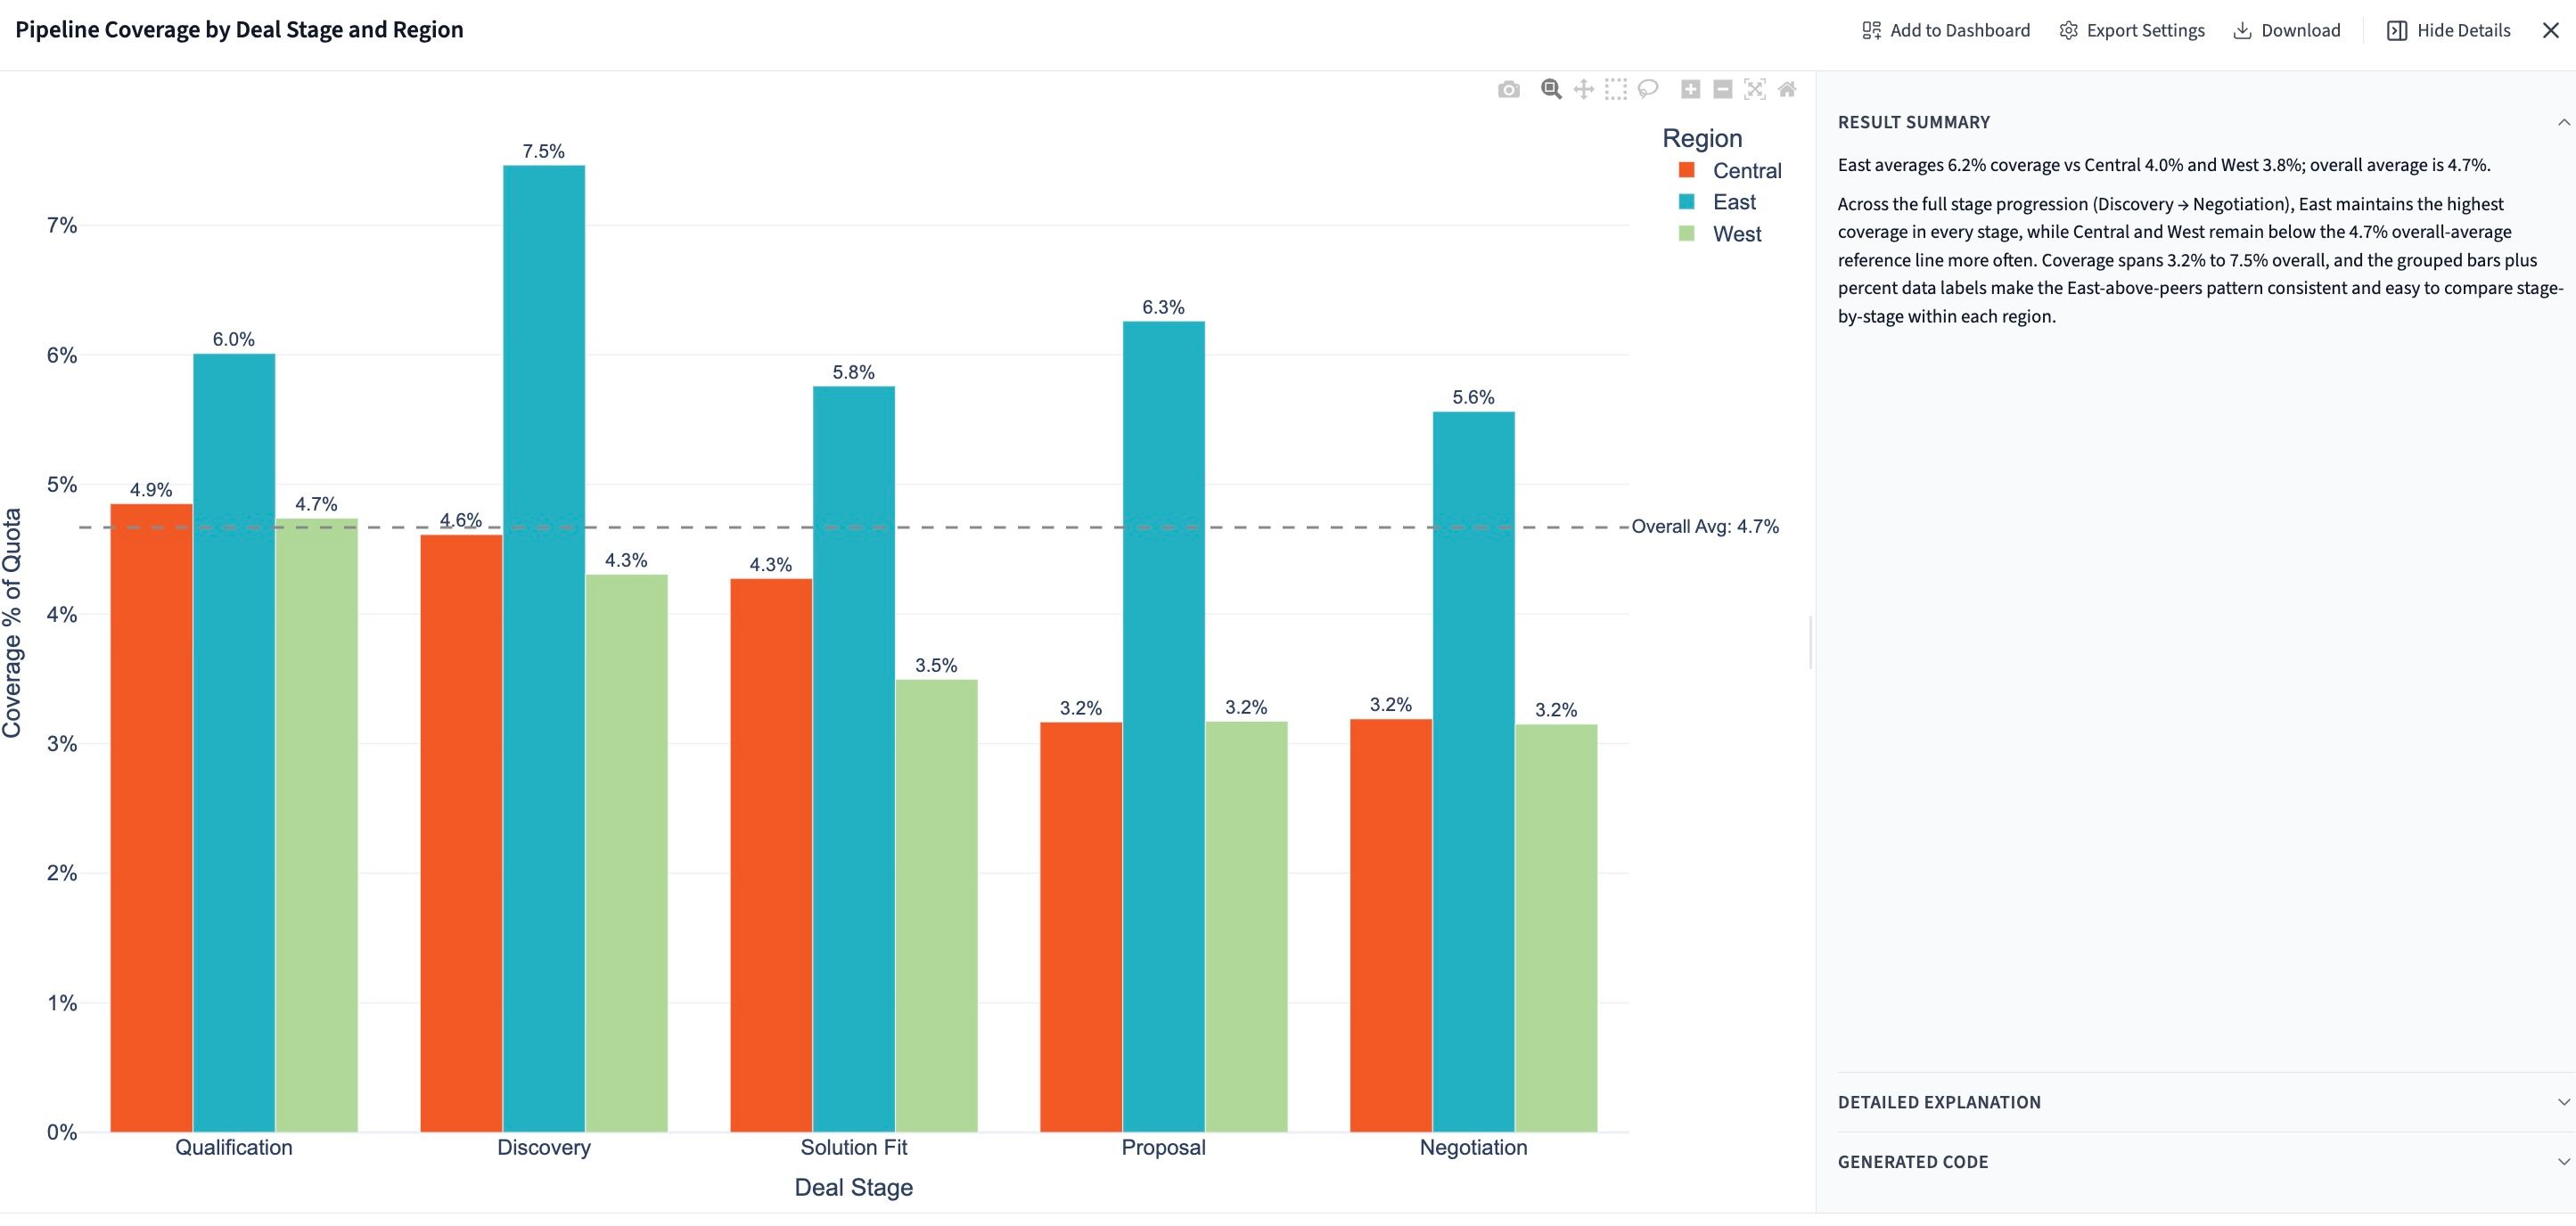
Compare coverage by rep and region, not just in aggregate
Aggregate numbers hide performance gaps. A team hitting 4x coverage overall may have one rep at 8x and another at 1x. Use Querri to slice coverage by owner and region every week. That's where the real coaching conversations start.
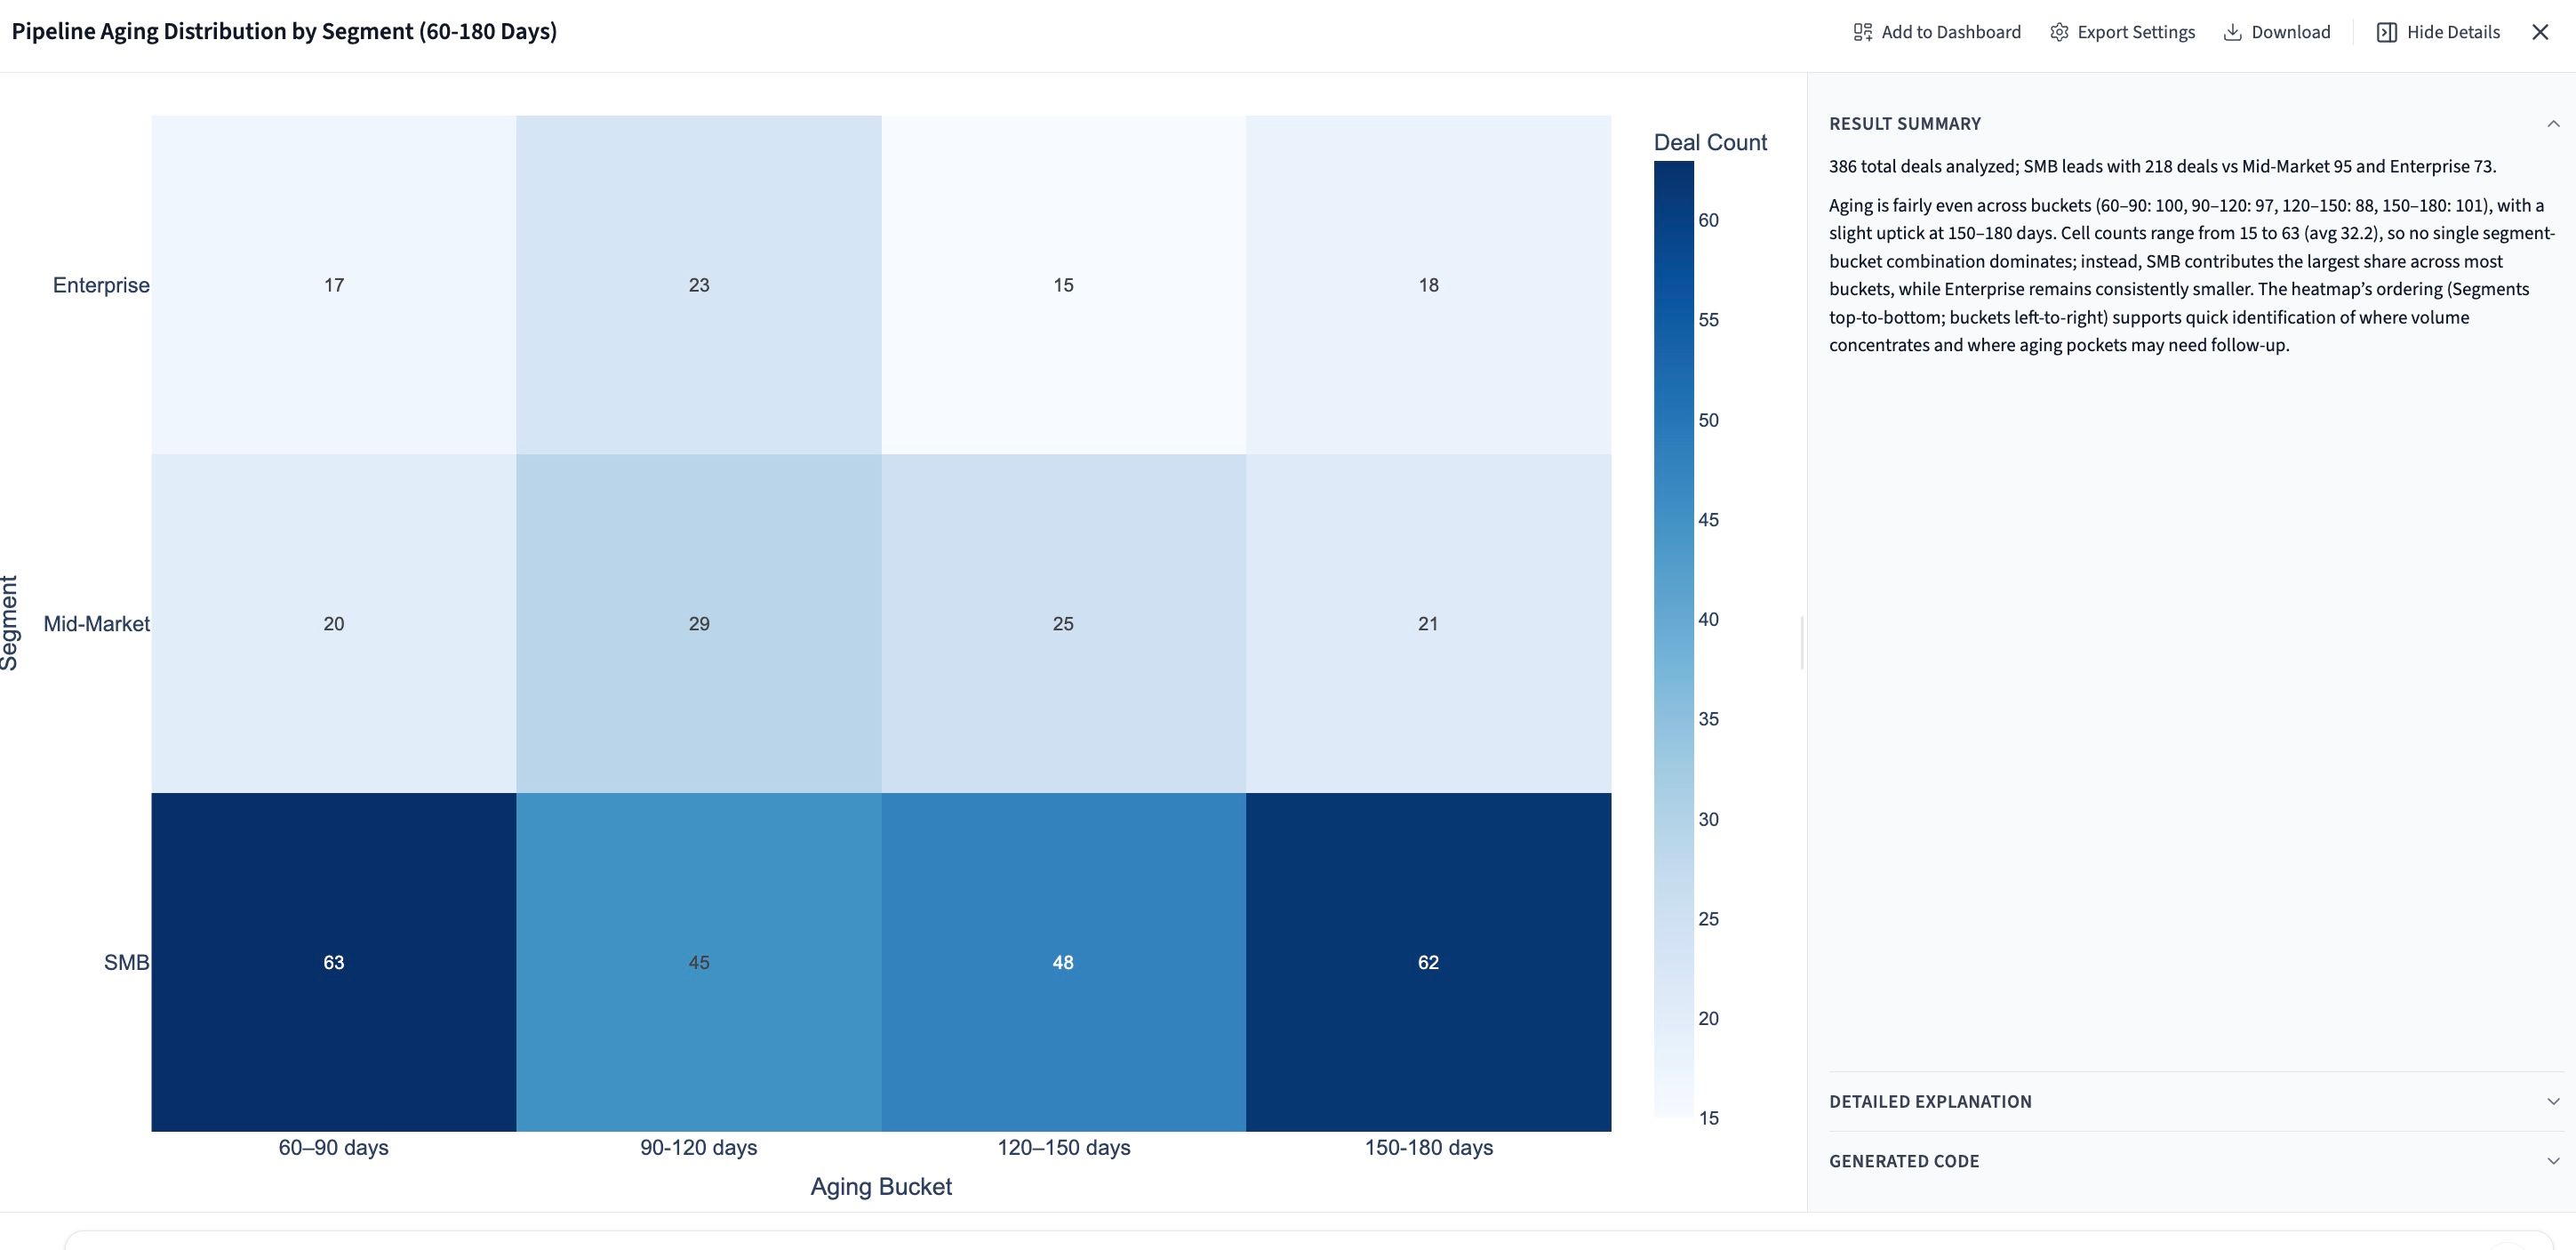
Pair coverage with pipeline velocity
Coverage tells you how much pipeline you have. Velocity tells you how fast deals move through. Ask Querri to include average deal cycle time alongside coverage ratios — together they give you a much more accurate forecast of what will actually close on time.
Save your report as a template and automate it
Once you've built a pipeline coverage report you trust, save it as a reusable project in Querri. Schedule it to run automatically each week so your team always has a fresh, accurate view of pipeline health — without anyone having to pull data manually.
Frequently asked questions
What's the right pipeline coverage ratio for my team?
How do I know which deals to exclude from coverage calculations?
How is this different from just pulling a pipeline report from Salesforce or HubSpot?
Can I track pipeline coverage trends week over week?
What if my quota targets are in a separate spreadsheet from my CRM data?
How do I present pipeline coverage to the executive team without losing their attention?
Can I automate this report to run every week without manual effort?
What if different regions or teams have different quota structures?
Other popular resources
Examples
Browse all use cases
Explore how other teams use Querri for data analysis.
Blog
How agentic AI works
Learn how Querri's AI agents transform your data analysis.
Demo
Request a walkthrough
See Querri in action with your own data.
Pricing
Compare plans
Find the right plan for individuals, teams, or enterprise.