How to Build and Monitor a Customer Health Score Without a CS Platform
Built for Customer Success Managers, CS Ops, and CS Leads. Get a weighted, multi-signal health score for every account, calculated from real data, refreshed weekly, and visible in a shared dashboard, without Gainsight or ChurnZero.
Open QuerriWhat you'll need
Querri (Free trial) to connect your data, calculate component and composite scores, build the health dashboard, and schedule weekly refreshes
Product usage / adoption data : CSV or database export with account ID, login frequency, feature adoption events, and session counts
Support ticket data : CSV from Zendesk, Intercom, or Freshdesk with account ID, open ticket count, and ticket severity
CRM engagement data : HubSpot or Salesforce export with account ID, last activity date, email engagement, and meeting history
Billing / renewal data : CSV with account ID, contract value, renewal date, and at-risk flags
Need help?
If you have any questions, you can request a demo or email our team.
Before we begin
Most CS teams are running their health tracking in a spreadsheet someone built two years ago, or relying on gut feel and recency bias: whichever account they talked to last week feels healthy, and the ones they haven't heard from feel risky. Neither is a system.
The alternative (a dedicated CS platform like Gainsight or ChurnZero) is real, but it's also a six-figure contract, a six-month implementation, and a full-time CS Ops admin to maintain it. Most teams at the stage where they're building their first health score model aren't ready for that investment.
This playbook is for CS Managers, CS Ops, and CS Leads who want to build a working, weighted health score from their existing data, using Querri to calculate the scores, build the dashboard, and keep it refreshed weekly, so the team can prioritize outreach based on actual risk signals rather than instinct.
How it works:
- • Connect or upload your usage, support, CRM, and billing data into the Querri Library. Querri profiles each source and surfaces data quality issues before any scoring begins
- • Ask Querri to calculate a 1–5 component score for each signal per account: login frequency, open ticket count, days since last engagement, and contract value at risk
- • Ask Querri to compute a weighted composite health score by combining signal scores using your chosen weights (e.g. usage 40%, support 25%, engagement 20%, billing risk 15%)
- • Build a dashboard with health score distribution across your book, a ranked account list, and a drill-down view showing which signal is driving each account's score
- • Schedule the project to refresh weekly so scores stay current without manual effort, then export for CRM import or a Wrapped leadership presentation
Follow the steps
Connect or upload your data sources
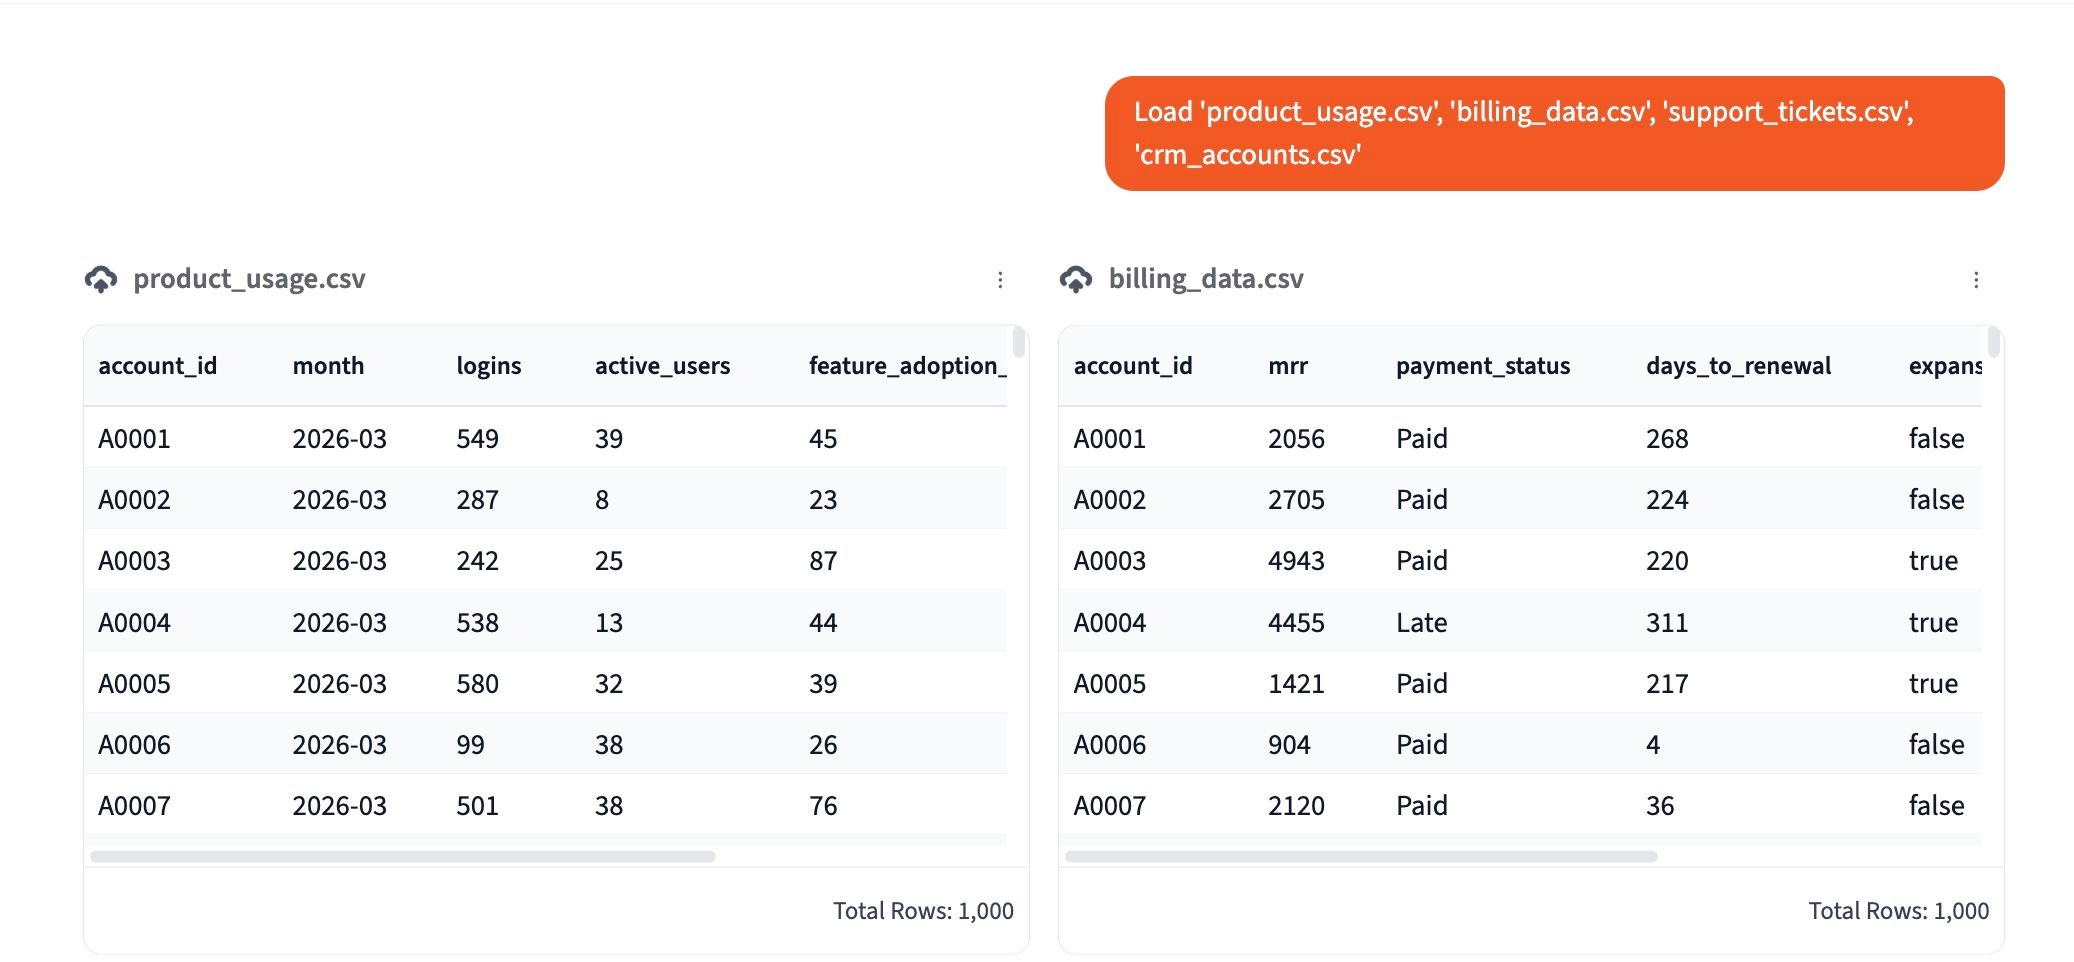
Start by uploading all four data sources into the Querri Library: product usage or adoption data, support ticket data, CRM engagement data, and billing or renewal data. Each file can be a CSV export from your existing tools. You don't need a direct integration to get started.
As soon as the files land, Querri runs an automatic data audit across all sources, checking for missing account IDs, inconsistent date formats, duplicate records, and accounts that appear in one dataset but not another. It surfaces everything it finds in a plain-language report before any scoring begins.
If you're connecting HubSpot or Salesforce directly, Querri will pull account and engagement data via the native connection. For usage and billing data, a CSV export is the fastest path. You can add additional sources later without rebuilding the project.
Calculate component scores for each signal
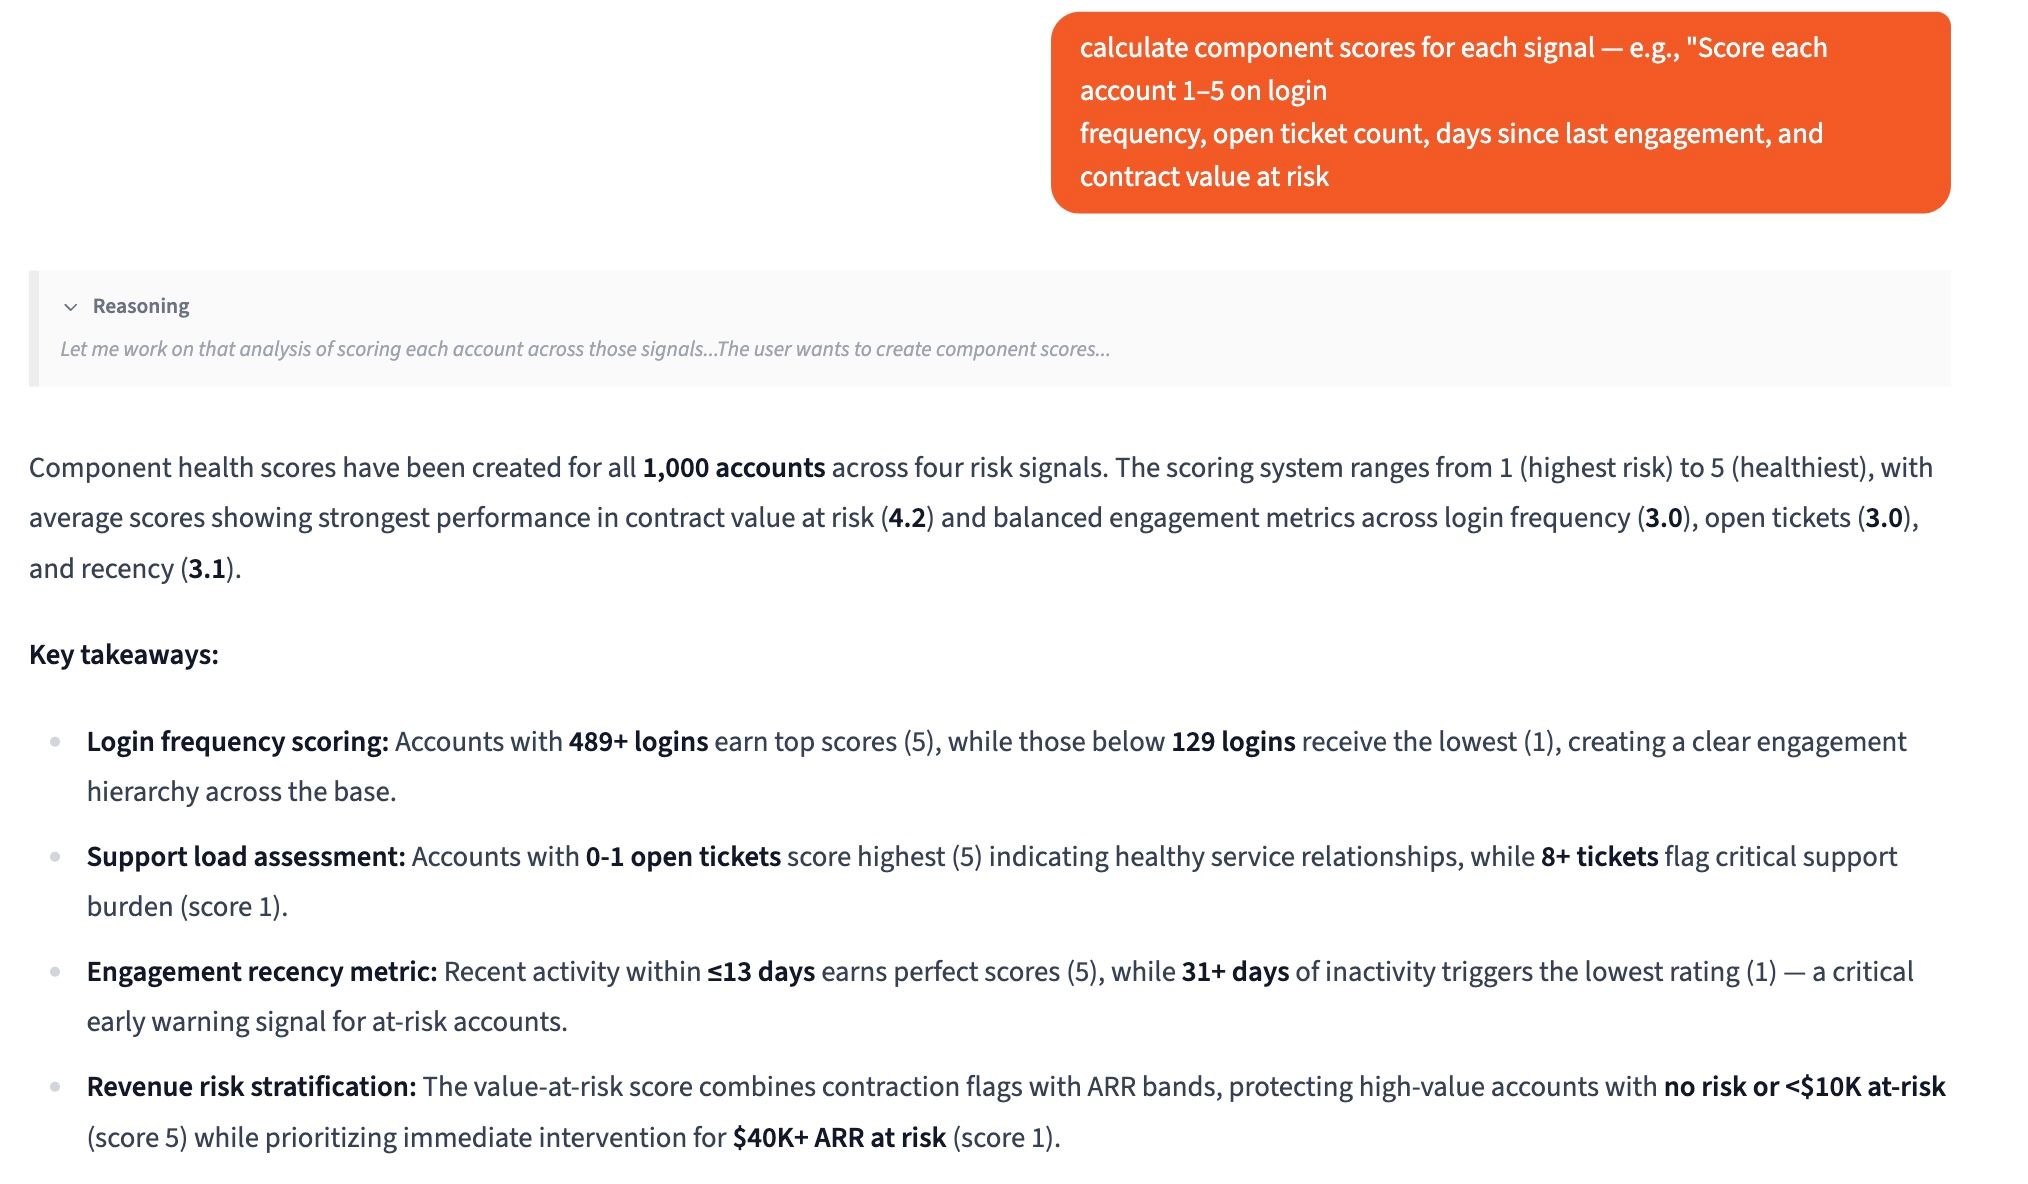
Before combining signals into a composite score, ask Querri to score each account 1–5 on every individual signal. This keeps the math transparent and lets CSMs see exactly which dimension is pulling an account's score down, not just the final number.
"Score each account 1–5 on four signals: login frequency over the past 30 days (5 = daily active, 1 = no logins), open ticket count (5 = zero open tickets, 1 = 3 or more open tickets), days since last CRM engagement (5 = within 7 days, 1 = over 60 days), and contract value at risk (5 = no risk flags, 1 = flagged at-risk or within 30 days of renewal with no renewal confirmed). Add each as a separate column."
Querri adds four new columns to the account table (one per signal) so you can see the raw component scores before any weighting is applied. Adjust the scoring thresholds in the prompt to match how your business defines healthy versus risky behavior on each dimension.
Compute a weighted composite health score
With component scores in place, ask Querri to combine them into a single composite health score using weighted averages. The weights should reflect how predictive each signal is for churn or expansion in your book, with usage typically carrying the most weight and billing risk the least.
"Compute a weighted composite health score for each account using these weights: usage score at 40%, support score at 25%, engagement score at 20%, and billing risk score at 15%. Express the final score as a value from 1–5."
Querri adds a Composite Health Score column to the account table. You can immediately see how your book distributes and which accounts need attention this week.
To adjust weights, simply re-run the prompt with different percentages. Once you have six months of scored data, revisit the weights by correlating them against actual churn events to sharpen the model over time.
Build a health score dashboard
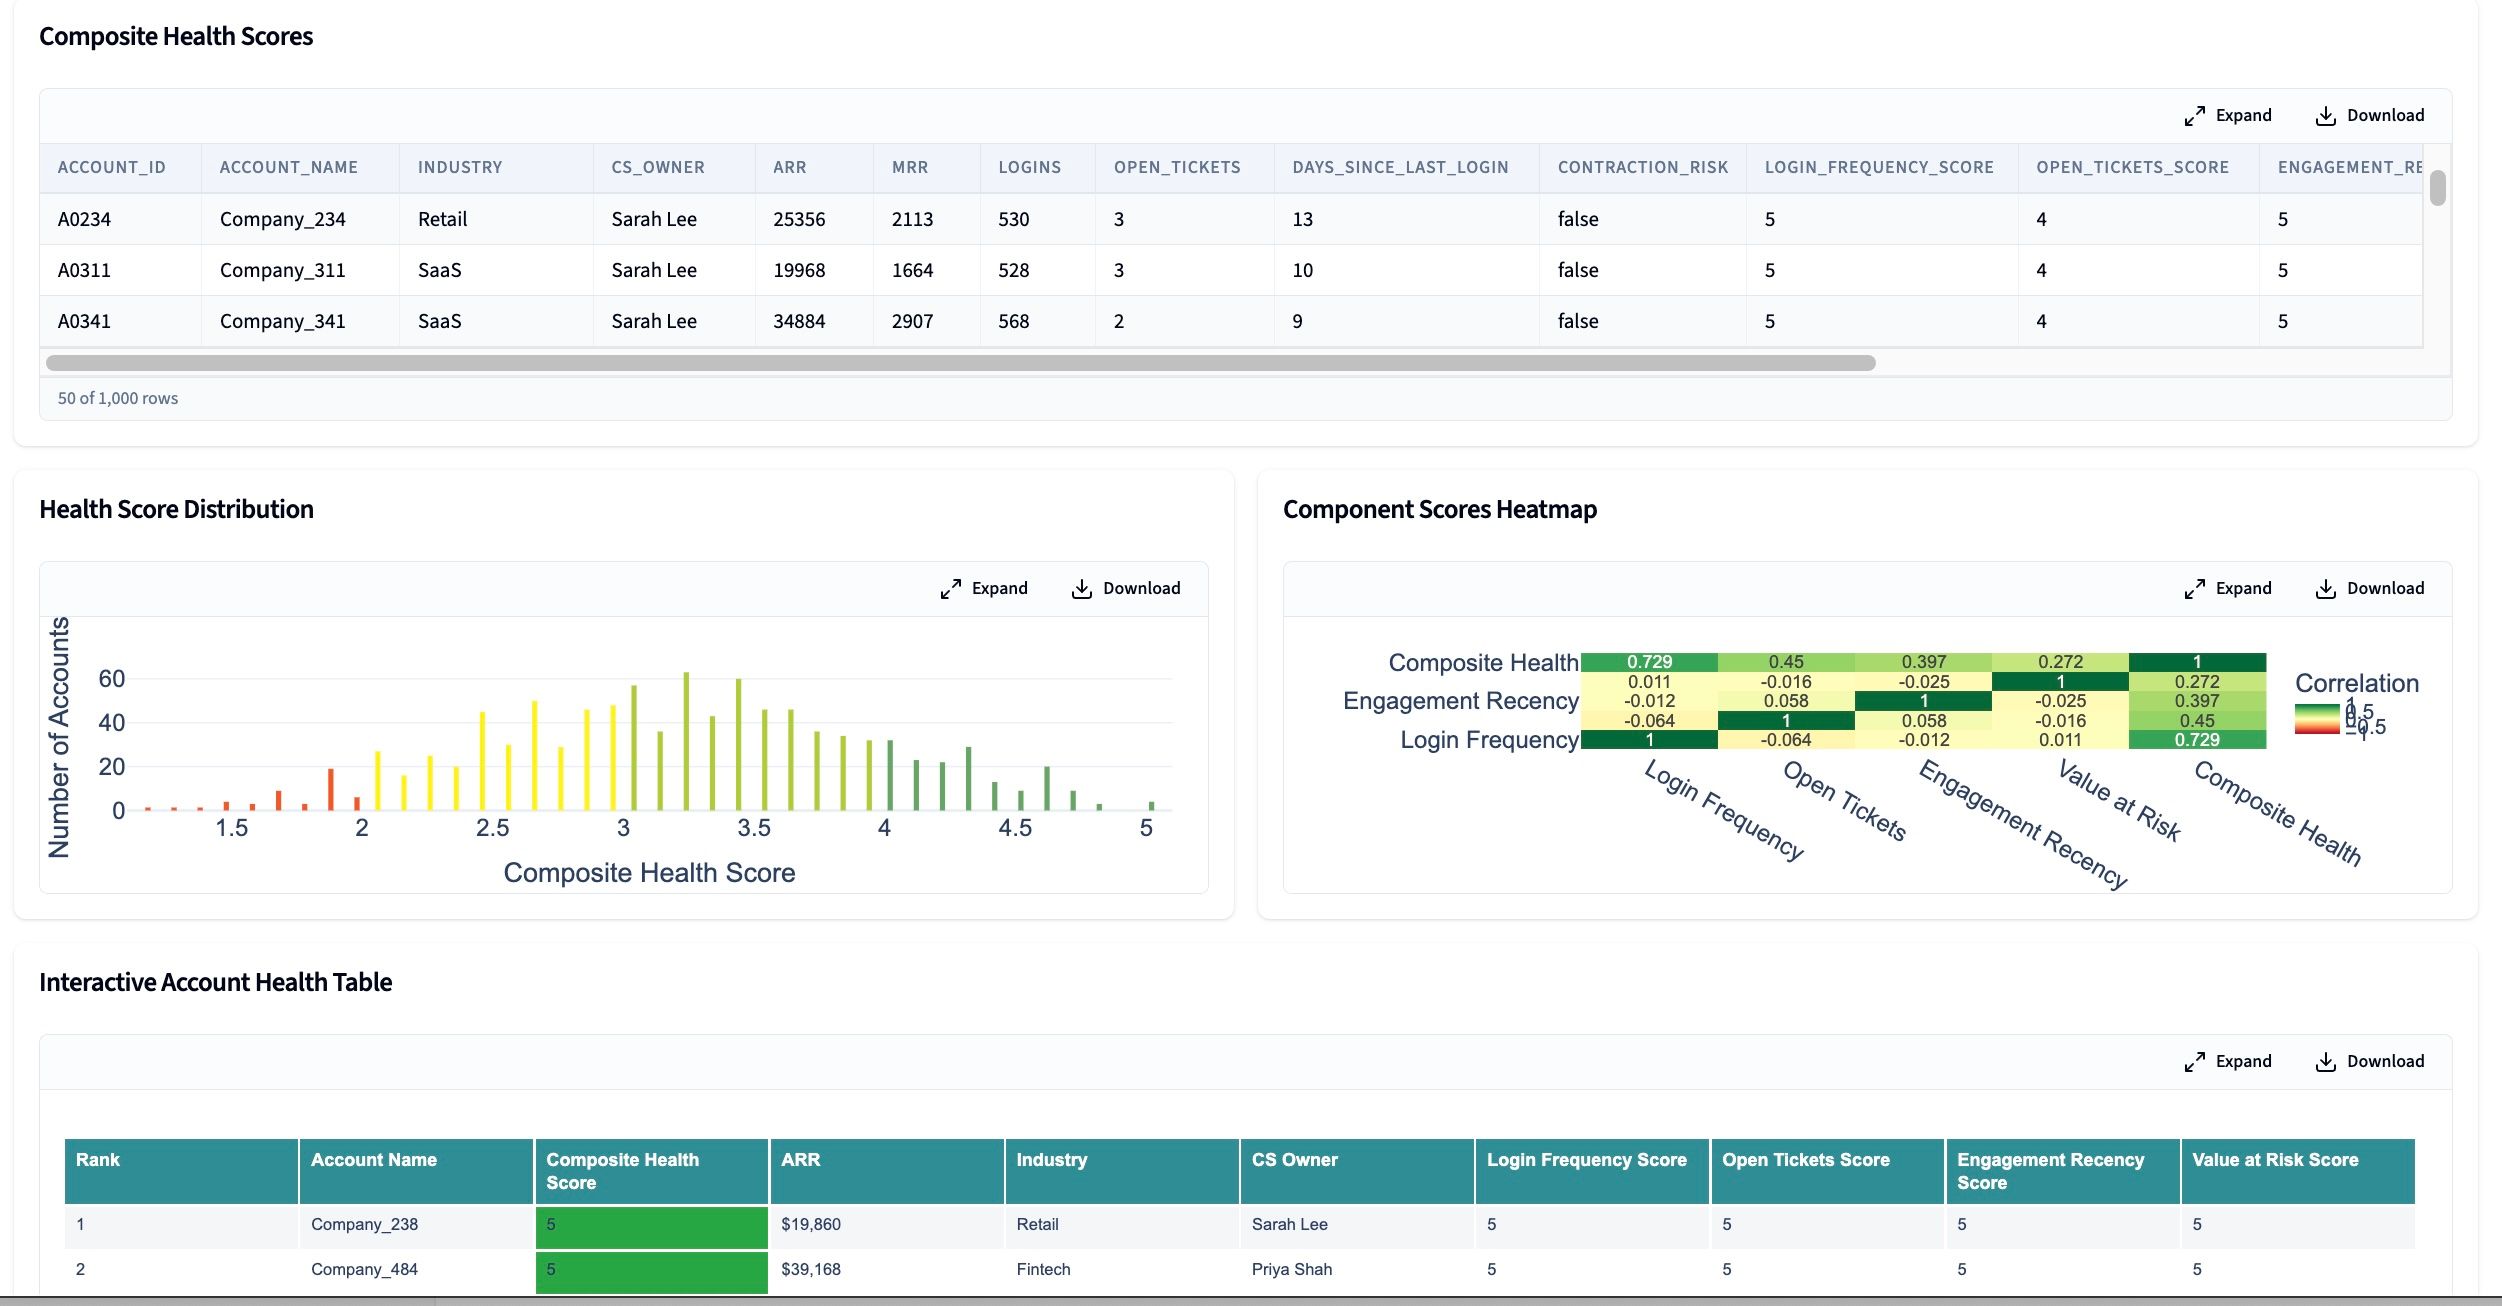
A scored account list is useful. A dashboard that shows how the whole book is distributed and lets a CSM drill into any account's component scores in one click, is what the team will actually use every week.
"Build a dashboard with health score distribution, a ranked account list, and drill-down by score component."
The distribution chart gives leadership a portfolio-level view: what percentage of ARR is at risk, and how that's changed week over week. The ranked account list becomes the CSM's weekly outreach queue. The drill-down table tells each CSM where to focus the conversation: is it a product adoption issue, a support escalation, or a renewal risk?
You can filter the ranked list by CSM owner, segment, or contract value to give each team member a personalized view of their book.
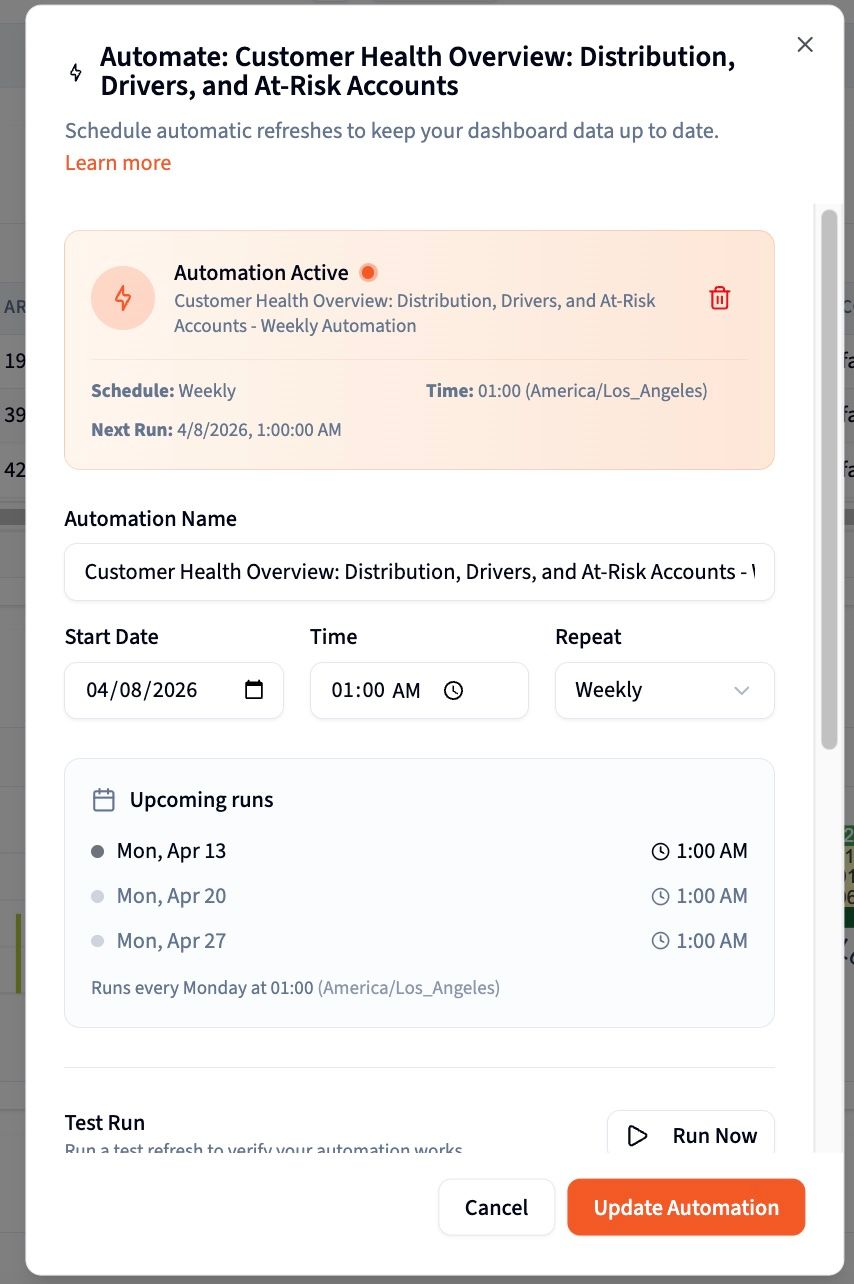
Schedule weekly refreshes and export for CRM or leadership
A health score that's two weeks old is only marginally better than gut feel. Once the project is working, schedule it to refresh automatically every week so the dashboard reflects current data without manual effort from anyone on the team.
For leadership reviews, ask Querri to generate a Wrapped presentation summarizing health score trends across the quarter: how the distribution has shifted, which segments are deteriorating, and which accounts moved from red to green following outreach.
Tips for better health scoring
Start with two or three signals, not all four
The instinct is to include every possible signal. Resist it. A model built on two strong signals (product usage and support health) is more useful than one built on four weak signals with incomplete data. Get the first version working and visible to the team, then layer in additional dimensions once you've validated the model is changing behavior. More signals add complexity before they add accuracy.
Show component scores alongside the composite score
A composite score without component visibility is a black box. If an account scores 2.1 but the CSM can't see whether that's driven by a product adoption drop or an open escalation, the score doesn't tell them what to do next. Always expose component scores in the dashboard so the health signal becomes an action trigger, not just a ranking number.
Flag accounts with incomplete data rather than excluding them
Some accounts will be missing a data source: no CRM activity, no usage data because they're on a legacy tier, or billing records that haven't synced. Don't exclude them from the scored list. Mark them clearly as "partial data" so CSMs know to treat the score with lower confidence. Excluded accounts create blind spots. Flagged accounts create informed judgment calls.
Calibrate weights against actual churn data after six months
The initial weights (usage 40%, support 25%, engagement 20%, billing 15%) are a reasonable starting point, not a permanent formula. Once you have six months of scored data alongside actual churn and renewal outcomes, ask Querri to analyze which component scores were most predictive of churn. Use that analysis to recalibrate the weights. A model that reflects your actual churn pattern is far more useful than one built on industry benchmarks.
Use health score distribution to tell the portfolio story in QBRs
Individual account health scores are operational. The distribution of scores across the entire book is strategic. In a QBR, a slide showing that 34% of ARR is currently in the red band (up from 22% last quarter) tells a fundamentally different story than a list of at-risk accounts. Use the distribution chart to lead leadership reviews, then use the ranked account list to drive the conversation about specific interventions.
Make it recurring before you make it perfect
The biggest failure mode in health scoring is spending three months perfecting the model before showing it to the team, then losing momentum when the data changes. A working score refreshed weekly (even a rough one) is worth far more than a theoretically perfect model that takes six months to build. Schedule the weekly refresh from day one. Iterate on the model while it's already in use, not before.
Frequently asked questions
What data do I need to build a customer health score without a CS platform?
How do I decide what weight to assign each signal in a composite health score?
How often should I refresh health scores, and how do I automate it?
What should I do with accounts that score in the red zone?
How is this different from what Gainsight or ChurnZero does?
Can I use health scores to prioritize QBR conversations and leadership reviews?
What if my data is incomplete and some accounts are missing usage data or CRM records?
How do I export health scores back into my CRM?
Other popular resources
Examples
Browse all use cases
Explore how other teams use Querri for data analysis.
Blog
How agentic AI works
Learn how Querri's AI agents transform your data analysis.
Demo
Request a walkthrough
See Querri in action with your own data.
Pricing
Compare plans
Find the right plan for individuals, teams, or enterprise.