How to Track and Improve First Response Time by Channel and Agent
Built for Support Ops Leads, CS Managers, and QA Leads. Identify which agents and channels are consistently missing FRT targets, and turn that analysis into a recurring coaching input. Not a one-time data pull.
Open QuerriWhat you'll need
Querri (Free trial) to compute FRT per ticket, aggregate by agent and channel, and produce a ranked performance table
Ticket/conversation export (CSV or Excel from Zendesk, Intercom, Freshdesk, or any helpdesk) including ticket creation timestamp, first reply timestamp, assigned agent, and channel (email, chat, phone)
FRT target thresholds (your SLA or internal targets by channel, e.g. email < 4h, chat < 2min). Used to filter breach tickets and rank agents by % missing target
Need help?
If you have any questions, you can request a demo or email our team.
Before we begin
Most teams already track FRT in some form. The problem is it usually lives in a one-off export someone pulled last quarter, averaged across everything, and quietly filed away. It doesn't tell a Support Ops Lead which agents are consistently late. It doesn't tell a CS Manager whether email or chat is the bigger problem. And it certainly doesn't feed into 1:1 coaching in any structured way.
This playbook is for Support Ops Leads, CS Managers, and QA Leads who want to turn FRT analysis into a repeatable process. One that computes FRT per ticket, aggregates by agent and channel, filters to breach tickets, and produces a ranked table your team can act on every week.
How it works:
- • Upload your ticket/conversation export with ticket creation timestamp, first reply timestamp, assigned agent, and channel
- • Run a single prompt to generate a full FRT report covering agent and channel performance
- • Double-click to find correlations that drive the breach rate. Ask Querri to dig further and surface whether breaches are tied to ticket volume, time of day, channel-agent fit, or staffing capacity
- • Filter to tickets outside your FRT target thresholds and produce a ranked table of agents by % of tickets breaching the threshold
- • Run what-if scenarios to test the impact of staffing changes, channel rebalancing, or target adjustments before committing
- • Ask Querri for recommendations to improve FRT performance and get prioritized, data-backed actions rather than generic advice
- • Wrap it up with an exec-level presentation or schedule automated weekly reports so performance stays visible without manual effort
Follow the steps
Upload your data
Export your data as CSV or XLSX from Zendesk, Intercom, or whichever support platform you use and upload it directly to Querri. The file lands and an automatic data audit runs, checking for missing values, duplicate records, and inconsistent formats across timestamps, agent names, and channel labels.
Querri surfaces everything it finds in a plain-language report so you can see exactly what's there. If it spots issues it can fix (like normalising date formats or deduplicating rows), it'll ask for your permission before making any changes.
Once the data is clean, Querri generates a high-level summary of the dataset (ticket volume, channel breakdown, date range, agent coverage) so you have a clear starting point before any analysis begins.
Compute FRT, filter out the noise
Ask Querri to compute FRT for each ticket as first reply timestamp minus ticket creation timestamp. Before it does, apply the critical sanity check: exclude any tickets where no first reply exists. Bot-handled and auto-closed tickets with no human response will otherwise inflate your numbers and make slow agents look better than they are:
"Compute FRT for each ticket as first reply timestamp minus created timestamp. Exclude any tickets where first reply is missing or null — these are bot-handled or auto-closed and shouldn't count toward FRT averages."
Querri flags and removes the noise rows automatically, so your FRT calculations only reflect genuine human responses going forward.
Find the easy answer first
Before you go hunting for sophisticated explanations, rule out the obvious one. When teams miss FRT targets, the first instinct is always the same: we need more agents. Sometimes that's right. Often it isn't. Either way, the data will tell you.
"Is there a correlation between ticket volume and breach rate? Plot them together over the period."
In this example, Querri finds essentially no correlation. Breach rate doesn't track with volume. That tells you something important: the team isn't drowning. Adding bodies wouldn't fix this. The cause is structural, and you'll have to look harder.
Then look at the time of day
If volume isn't the cause, the next thing to check is when the breaches are happening. Aggregated daily numbers wash out hour-by-hour patterns, and most FRT problems live inside those patterns.
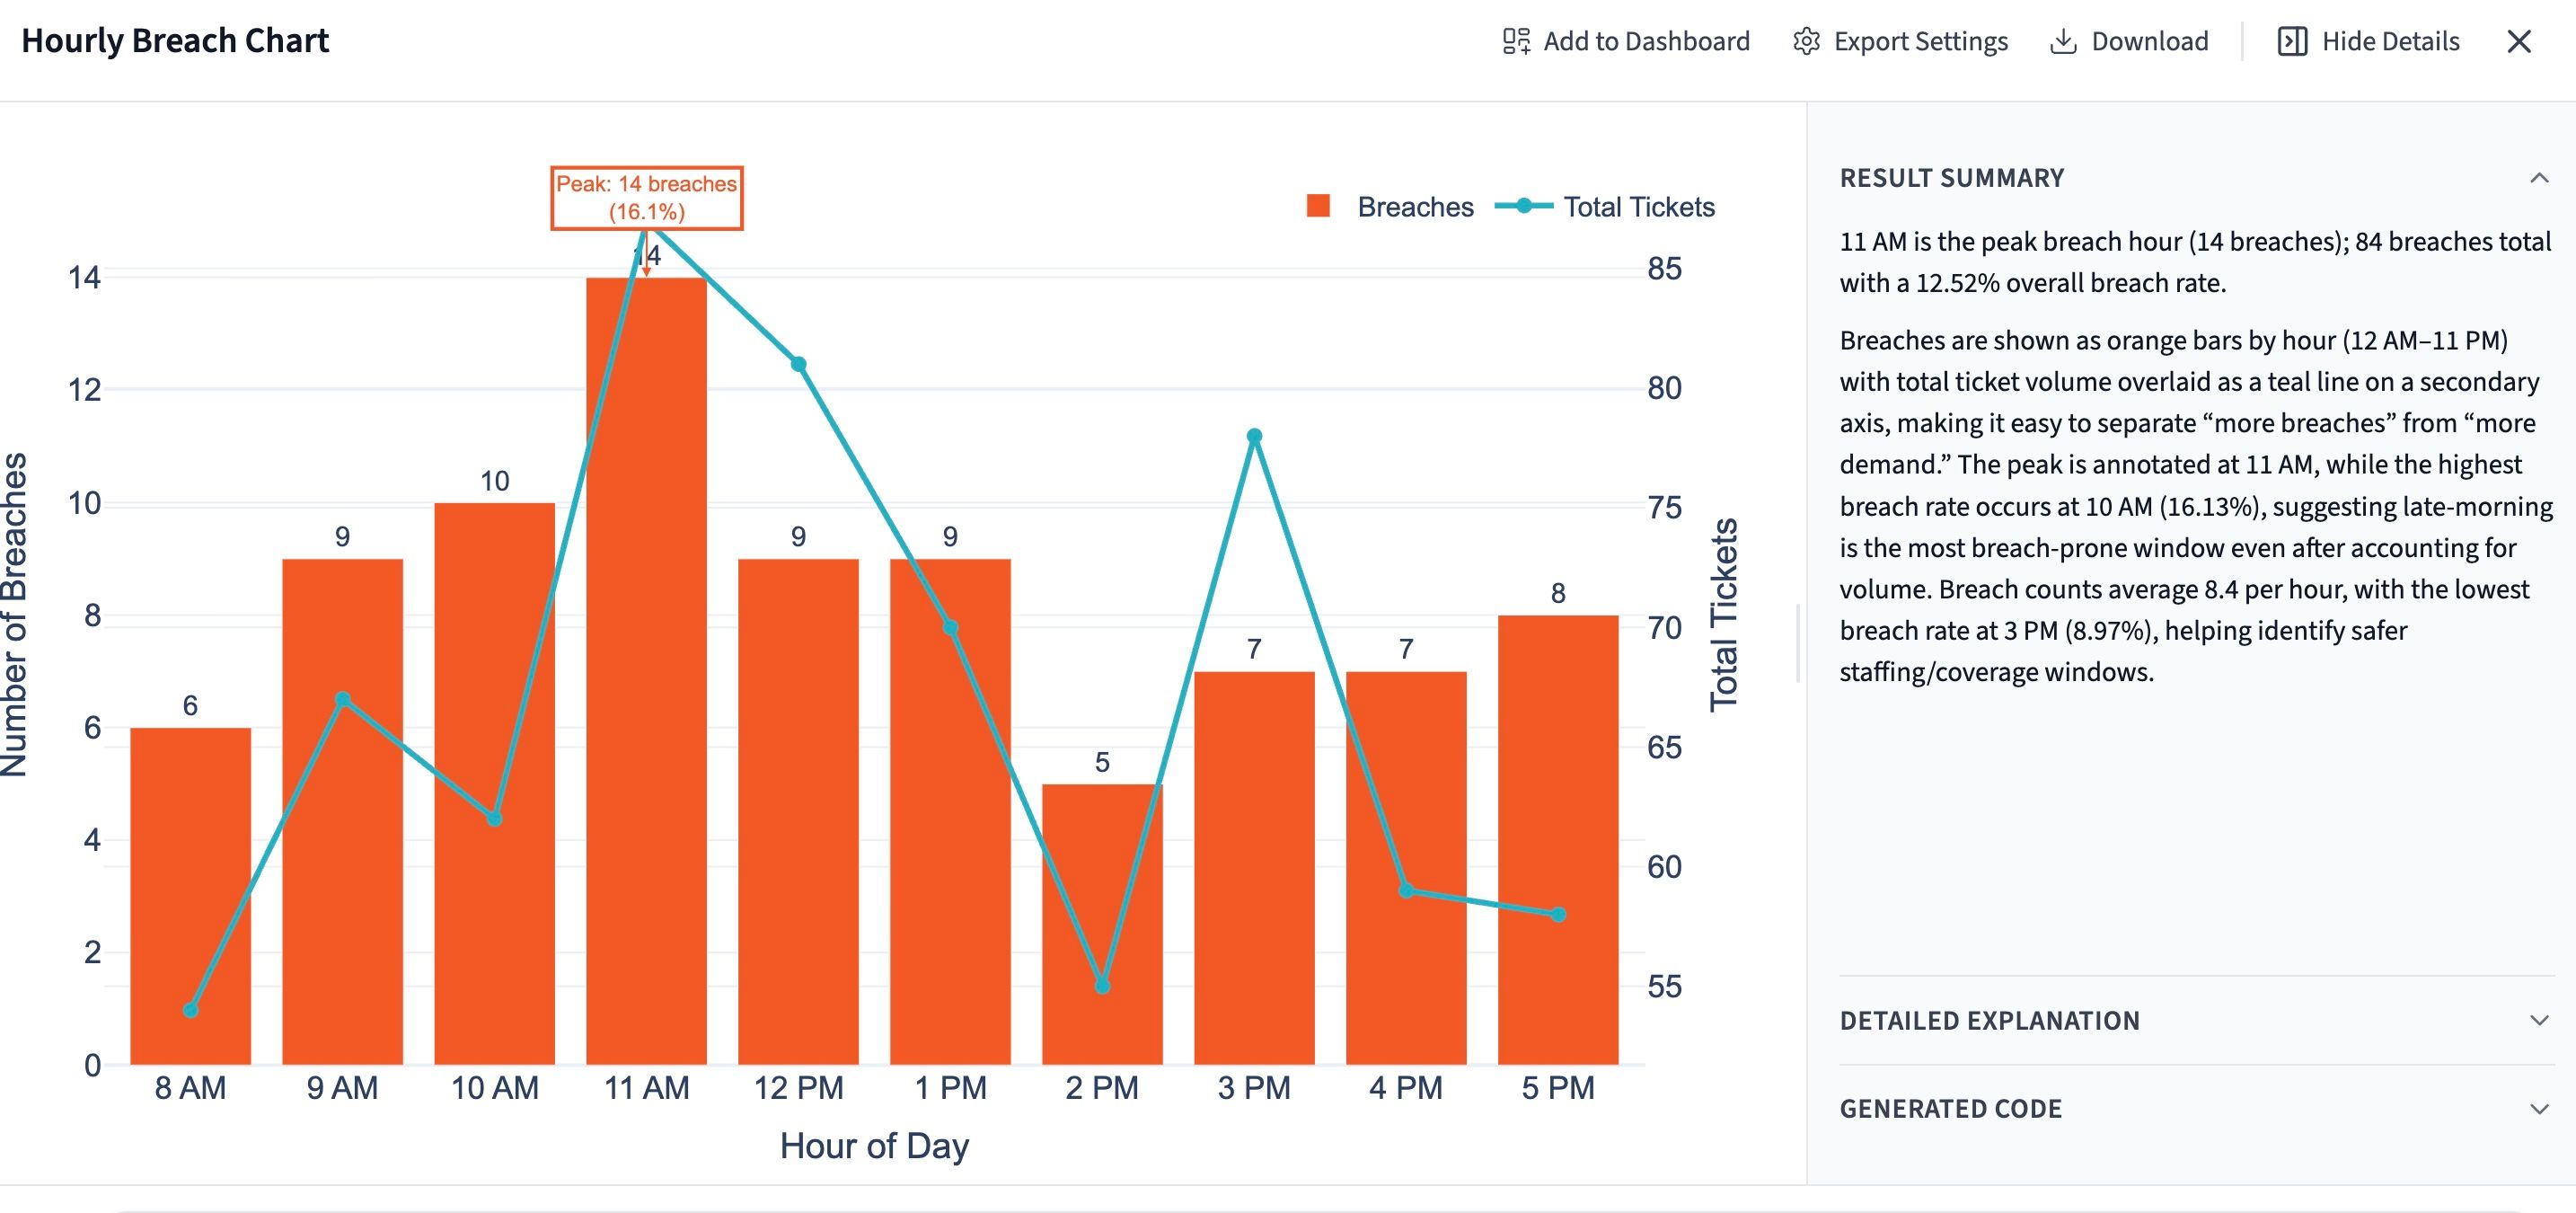
"Break down breach rate by hour of day. Identify any peak breach windows and tell me what percentage of total breaches fall in those windows."
In this example, Querri finds a sharp peak at 11am. About 17% of all breaches happen in that single hour. That's a lot of pain concentrated in a 60-minute window, and it reframes the whole coaching conversation. The question stops being "why are these agents slow?" and starts being "what's happening at 11am, and is it a staffing, routing, or handoff issue?"
The fix for an 11am peak is almost never coaching. It's almost always a scheduling change, a routing rule, or an upstream handoff that's quietly breaking. You wouldn't find any of that in an agent-by-agent FRT report.
Test the fix before you commit to it
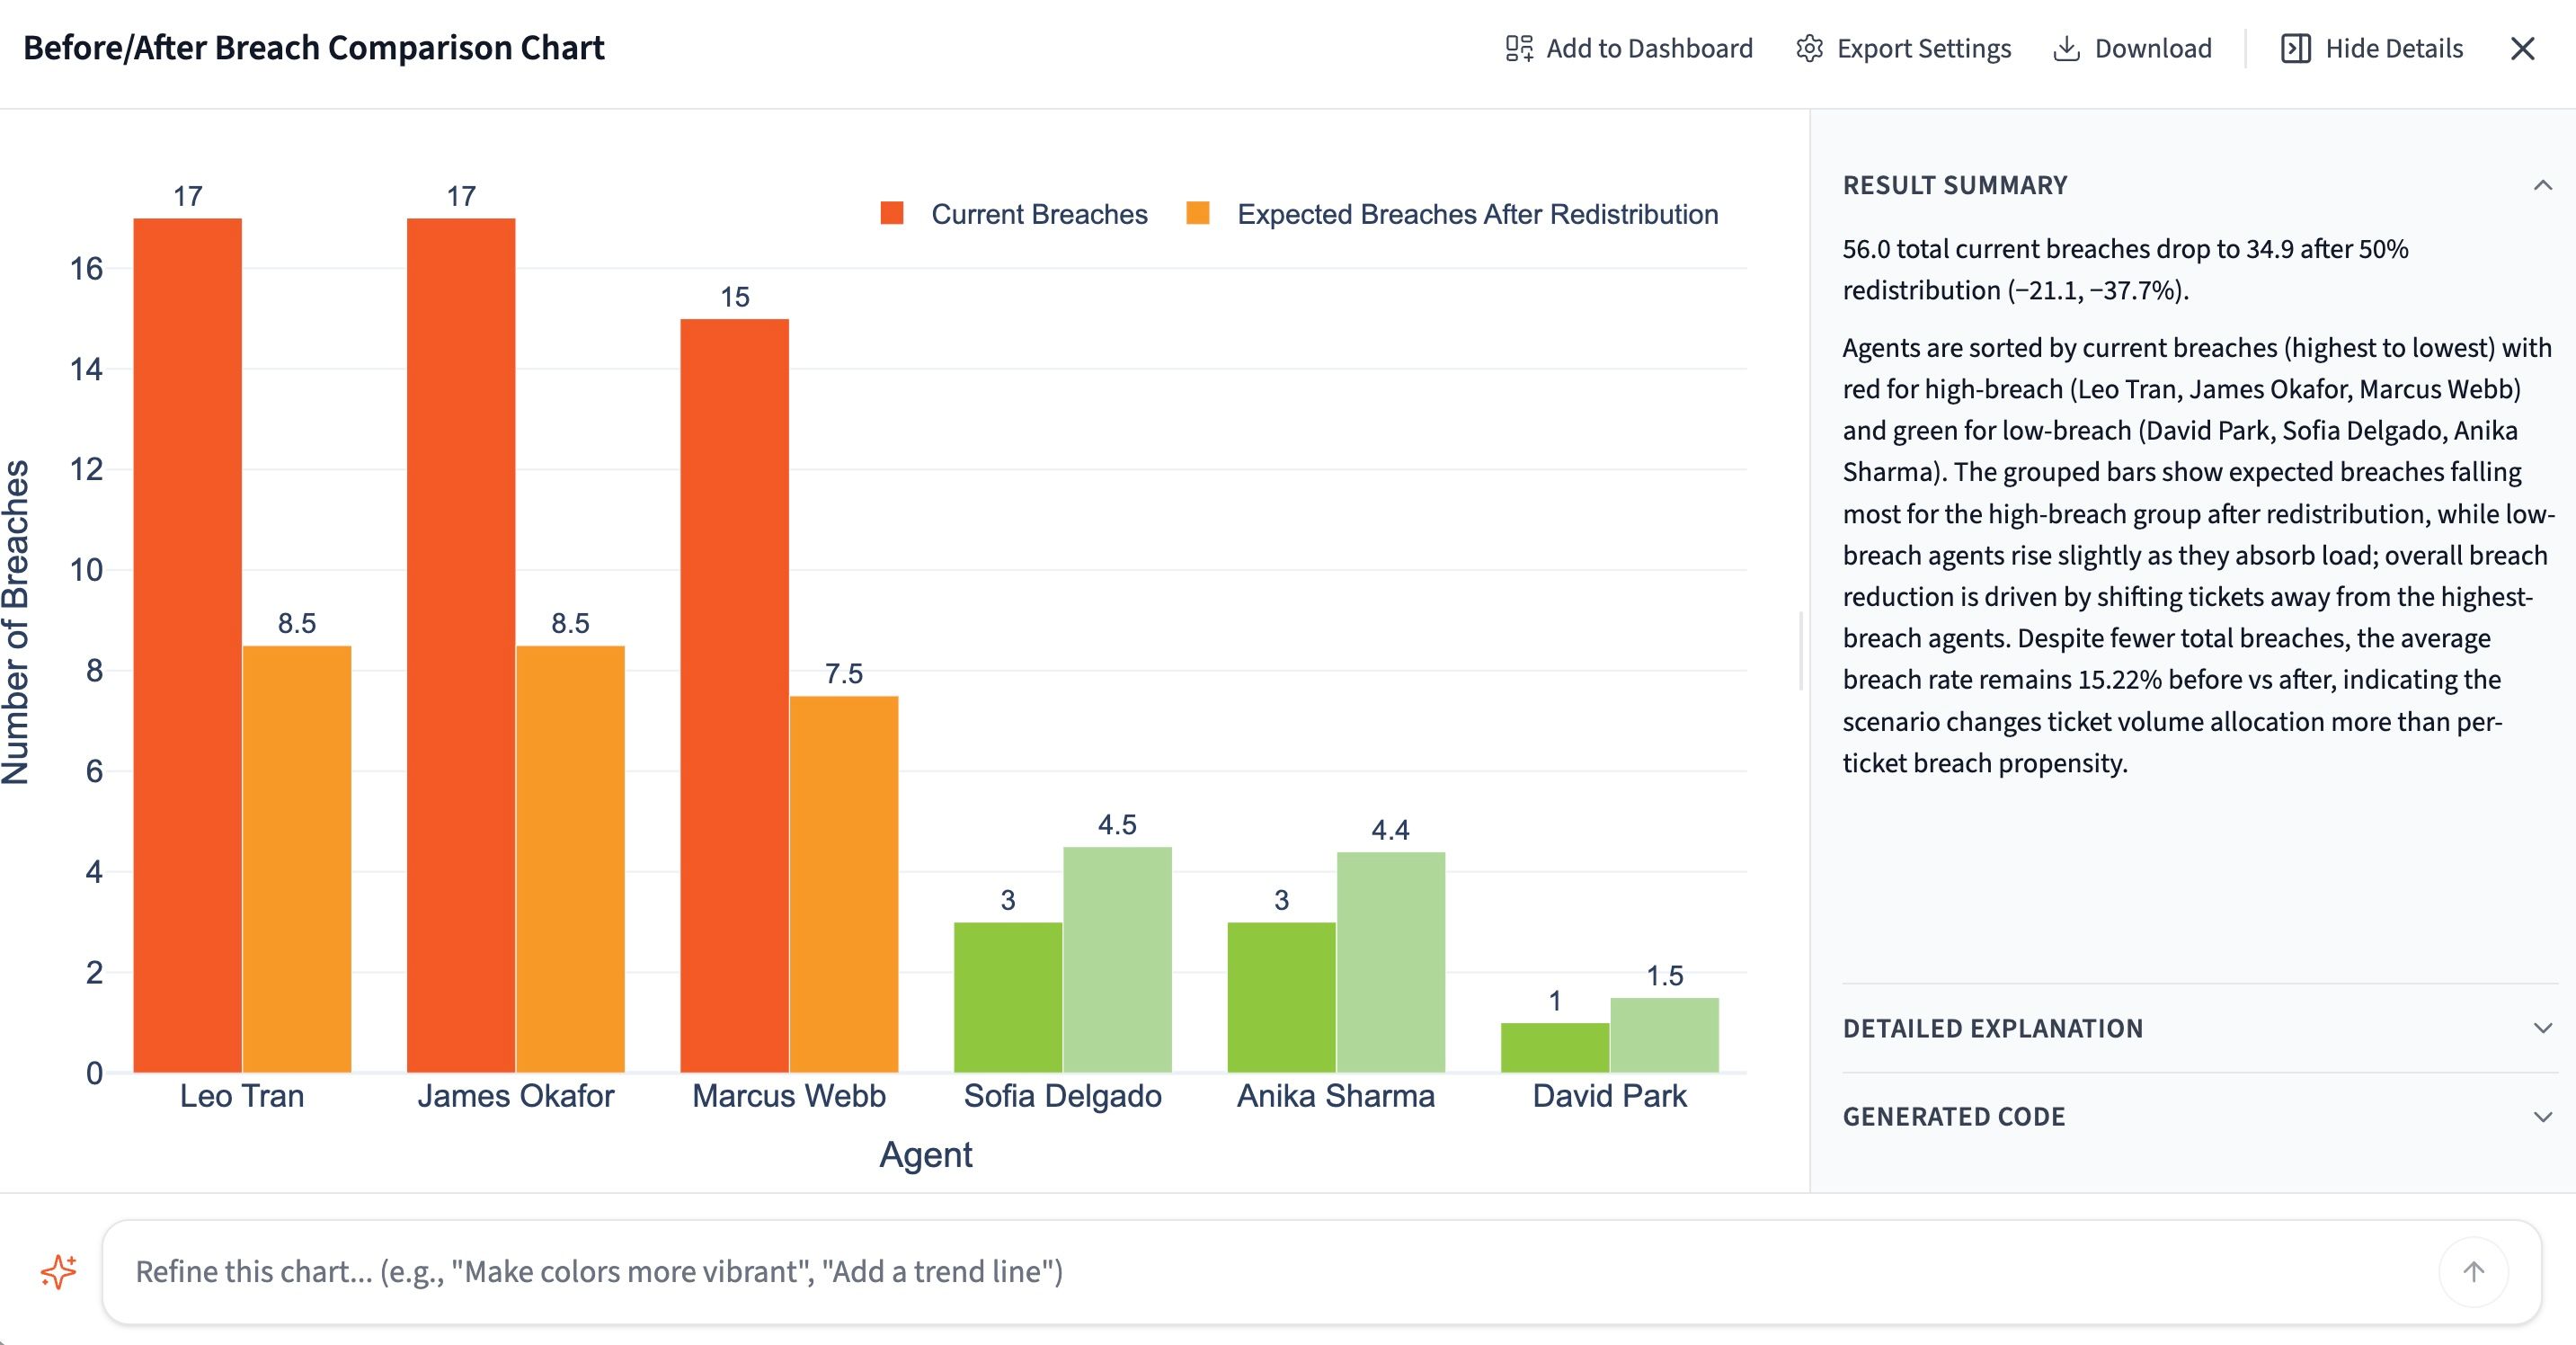
You know where the breaches are. The next question is what fixing it would actually do. Test it before you commit. Ask Querri to model a simple redistribution: what happens to the overall breach rate if 50% of tickets shift from your highest-breach agents to your lowest?
"If 50% of tickets were redistributed from the highest breach-rate agents to the lowest breach-rate agents, what would the projected impact be on overall breach rate?"
Querri runs the scenario against your actual ticket data and returns a projected new breach rate. Now you have a concrete, defensible number to bring to a staffing or routing conversation instead of a gut feeling.
Run as many variations as you want. Try different redistribution percentages, specific agents, or channel-level rebalancing until you find a scenario that moves the number and is realistic to actually staff.
Let Querri write the recommendations
Most articles about improving FRT give you the same three suggestions: hire more agents, route smarter, train better. Useful in the abstract. Useless when you're staring at a specific 11am breach pattern and trying to decide whether the fix is a scheduling change or a coaching one. So skip the generic playbook. Just ask Querri.
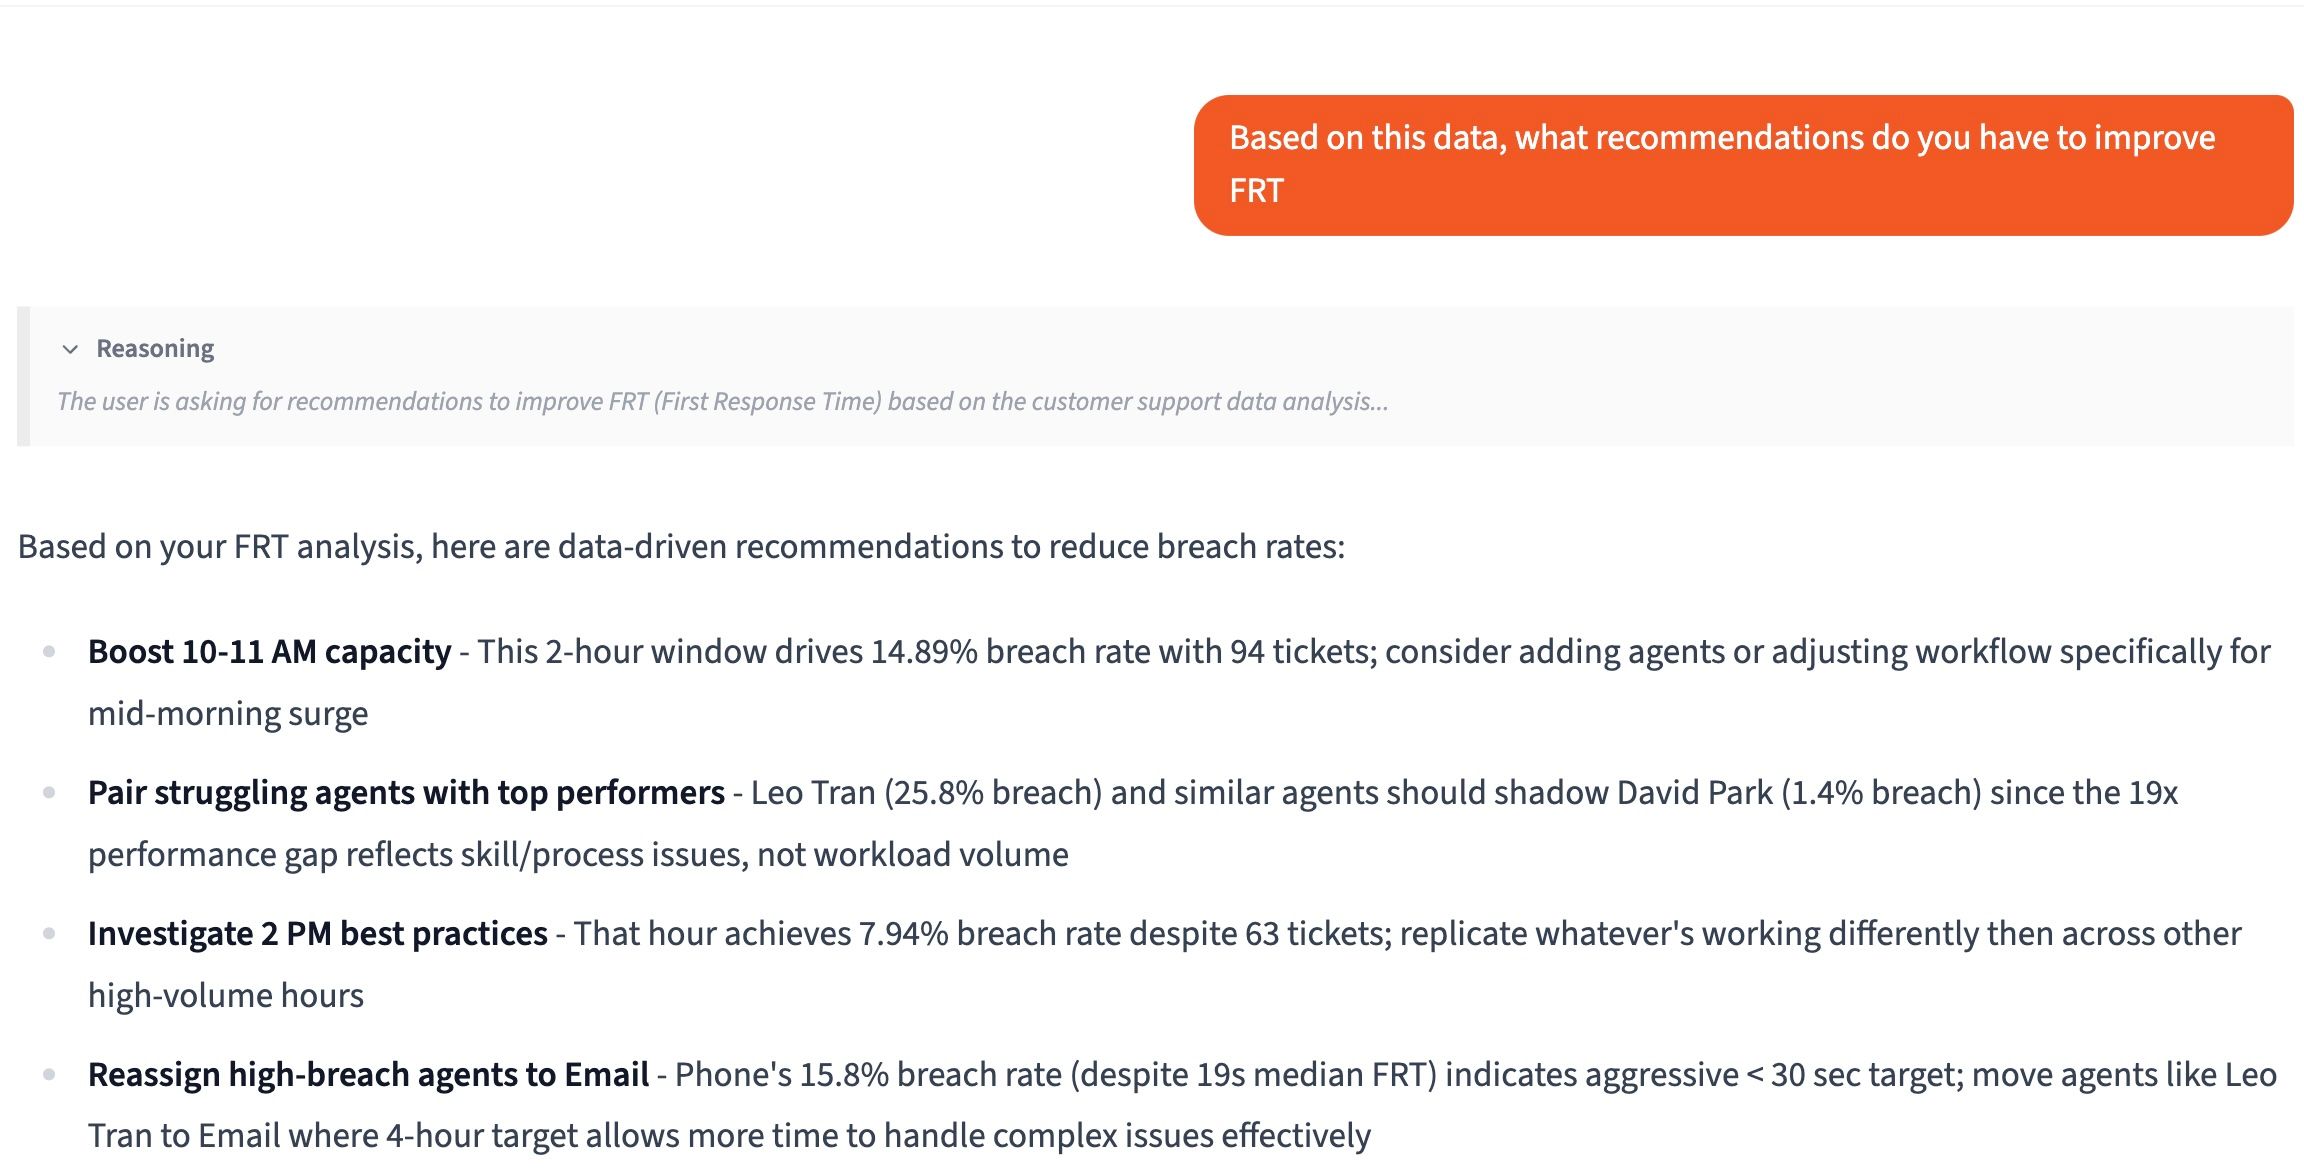
"Based on everything you've found, what are your top recommendations to improve our FRT performance?"
Querri already knows where your breaches are concentrated, what time-of-day patterns exist, and what impact redistribution would have. So its recommendations aren't starting from scratch. They're tied directly to your data, and they're prioritized by the math, not by what sounds most defensible in a meeting.
Drill into any recommendation with follow-up prompts. Ask Querri to explain its reasoning, size the impact, or identify which team members or channels it applies to most.
Bring it to the QBR
Weekly FRT data tells you what's happening now. Quarterly data tells you whether anything you're doing about it is actually working, which is the question your CFO wants answered. Pull three months of ticket exports into Querri and ask for the QBR version:
"Using this quarter's data, generate a QBR-ready presentation on FRT performance. Include key findings, trend analysis, the main breach drivers we identified, and our top recommendations for next quarter."
Querri produces a structured presentation your team can take directly into a leadership review. Breach trends, root cause summary, what-if scenario outcomes, and a prioritized action plan, all in one place. No manual formatting, no starting from a blank slide.
Bringing FRT into the QBR shifts it from an operational metric to a strategic one. Leadership gets the context to make decisions on staffing, tooling, or SLA targets instead of reacting to complaints after the fact.
Tips for better FRT reporting
Always filter out tickets with no first reply before computing FRT
This is the single most important data quality step in any FRT analysis, and it's the one most teams skip. A null first reply timestamp means a bot, an auto-close rule, or a self-service flow handled the conversation. No human ever touched it. Including those rows in your average is like measuring how fast your sales team closes deals by including all the leads they never called. The number gets better, but it stops describing anything real. The teams with the worst-looking FRT data are sometimes the ones doing the most honest accounting. Make this filter part of your standard prompt every single time.
Rank by breach rate, and report median + p90 alongside it
Average FRT lies. One overnight ticket can distort a whole week. What you actually want for coaching is the percentage of tickets an agent missed the threshold on, the median (the typical experience), and the p90 (what your slowest 10% of customers are dealing with). A team with a fast median and a high p90 has a tail problem that the average is hiding. Surface all three.
Compare agents within their channel, not across
Chat agents will always look faster than email agents. Different SLAs, different customer expectations, different work entirely. And while you're at it, pair the ranked table with ticket volume context: an agent who handled 8 tickets and missed 3 is in a very different situation from one who handled 200 and missed 70. Volume changes the framing of the conversation entirely.
Make it recurring, not reactive
A one-time pull tells you who was slow last month. A weekly scheduled report tells you whether anything is changing. Save your Querri project as a template and run it on a schedule.
Frequently asked questions
What data do I need to upload for this analysis?
What happens during Querri's data audit when I upload my file?
Why does Querri filter out tickets with no first reply before computing FRT?
Querri found little correlation between ticket volume and breach rate. What does that mean?
How do what-if scenarios work in Querri?
How are Querri's recommendations different from generic best-practice advice?
What goes into a Querri-generated QBR presentation on FRT?
How often should I run this analysis?
Other popular resources
Examples
Browse all use cases
Explore how other teams use Querri for data analysis.
Blog
How agentic AI works
Learn how Querri's AI agents transform your data analysis.
Demo
Request a walkthrough
See Querri in action with your own data.
Pricing
Compare plans
Find the right plan for individuals, teams, or enterprise.