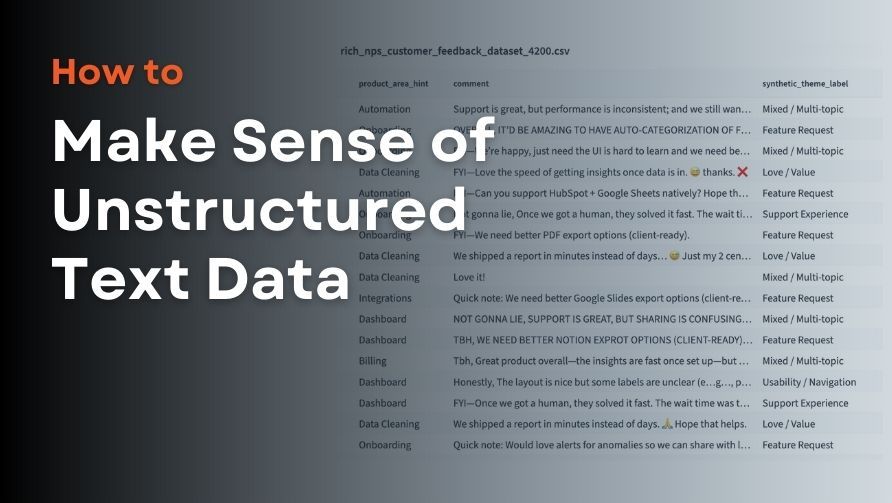
How to Actually Make Sense of Unstructured Text Data
Querri's Researcher and Categorize tools turn surveys, support tickets, and free-text feedback into structured, searchable insights — in minutes, not days.

You have thousands of rows of text data. Customer feedback. Support tickets. Open-ended survey responses. Maybe notes from sales calls or product reviews.
You know there are patterns in there. Themes. Signals. Things your business needs to know. But reading through all of it isn't realistic — and the data just sits there, untouched, while decisions get made on gut feel instead.
This is the unstructured text problem. And it's one of the most common reasons good data goes to waste.
In this post, we'll cover what makes unstructured text so difficult to work with, and how Querri's two newest tools — the Researcher and the Categorize tool — are built to finally solve it.
What Is Unstructured Text Data?
Unstructured text data is any free-form written content that doesn't fit neatly into a spreadsheet column: customer reviews, survey responses, support ticket descriptions, email bodies, chat logs, notes fields. Unlike structured data (numbers, dates, dropdowns), unstructured text can't be easily filtered, sorted, or charted without first transforming it into something analyzable.
That transformation — turning text into structured insight — is exactly where most teams get stuck.
Why Unstructured Text Data Is So Hard to Work With
If you've ever inherited a spreadsheet with a "Notes" column or tried to make sense of 2,000 open-ended survey responses, you already know the pain. But it helps to name it clearly:
You can't analyze what you can't organize. A column of raw text is invisible to charts, pivot tables, and dashboards. Until it's classified or extracted, it produces no insight.
Reading everything isn't feasible at scale. Sampling means you might miss the important patterns. And the themes you do notice will reflect what you read most recently, not what's most significant overall.
You don't always know what categories exist. Before you can classify, you need to know the buckets — which usually means manually skimming data first. It's a frustrating chicken-and-egg problem.
Manual tagging is inconsistent. "Billing issue," "payment problem," and "invoice question" often mean the same thing — but they'll show up as three separate categories and never aggregate correctly.
Rules-based approaches break quickly. Keyword matching and IF statements can't handle synonyms, negation, or context. They require constant maintenance as language evolves.
By the time it's done, the moment has passed. Manually coding qualitative data takes days. The product meeting already happened.
Two Tools That Fix This
Querri now includes two purpose-built tools for working with unstructured text data: the Researcher and the Categorize tool. They're designed for different situations, but they solve the same fundamental problem: turning raw text into something your team can actually use.
The Categorize Tool: Discover Themes You Didn't Know to Look For
What It Does
The Categorize tool analyzes your text data and automatically finds the natural groupings within it — without you having to define any categories upfront. It uses semantic clustering to understand meaning (not just keywords), then generates clear, human-readable labels for each group.
This is the tool for when you're looking at a column of text and asking, "What's actually in here?"
When to Use It
Use the Categorize tool whenever you're starting from scratch on a text dataset and want to discover what themes exist:
- "What topics are customers bringing up in these reviews?"
- "What kinds of issues are showing up in our support tickets?"
- "What are people asking about in these open-ended survey responses?"
- "What types of feature requests do we get?"
If you don't know the categories yet, Categorize will find them for you.
How It Works
When you ask Querri to categorize your data, it runs a two-phase process:
Phase 1 — Choose your granularity. Querri analyzes a sample of your data and presents three levels of detail to choose from:
| Level | Clusters | Best For |
|---|---|---|
| Broad | ~10–15 high-level themes | Executive summaries, quick overviews |
| Medium | ~30–80 topic areas | Working analysis, dashboards |
| Specific | Fine-grained with sub-categories | Deep dives, detailed breakdowns |
Each option is described based on your actual data — so you're choosing between your themes, not generic placeholders.
Phase 2 — Full execution. After you pick a level, Querri processes your entire dataset. New columns are added to your data:
- Category label — the discovered theme for each row
- Confidence score — how well the row fits its assigned category (0–1)
- Estimated flag — marks rows that were ambiguous and assigned to the nearest group
- Sub-category (if you chose Specific) — finer-grained detail within each theme
Once categorized, your data is immediately ready for analysis: "Show a bar chart of ticket count by theme" or "What's the average satisfaction score per category?"
Good to Know
The Categorize tool works best when your text column has at least 20 rows of meaningful content — full sentences or paragraphs, not single-word tags. Short labels won't produce useful clusters. If you're working with a large dataset, filtering to the relevant subset first will speed things up and often produce cleaner results.
The Researcher Tool: Extract and Classify When You Know What You Need
What It Does
The Researcher applies row-by-row analysis to your data, adding new structured columns based on your instructions. It understands context — so instead of matching keywords, it reads and interprets each record individually.
Use the Researcher when you already know what information you want to extract or what categories you want to classify into.
When to Use It
The Researcher shines in situations like these:
- Classification: "Classify each company by industry: Technology, Healthcare, Finance, Retail, Other"
- Extraction: "Pull out the main technology mentioned in each job description"
- Sentiment analysis: "Tag each review as positive, negative, or neutral"
- Standardization: "Normalize these company names to their official names"
- Scoring: "Score each customer review on a scale of 1–5"
If you know what the output should look like, the Researcher gets you there.
How It Works
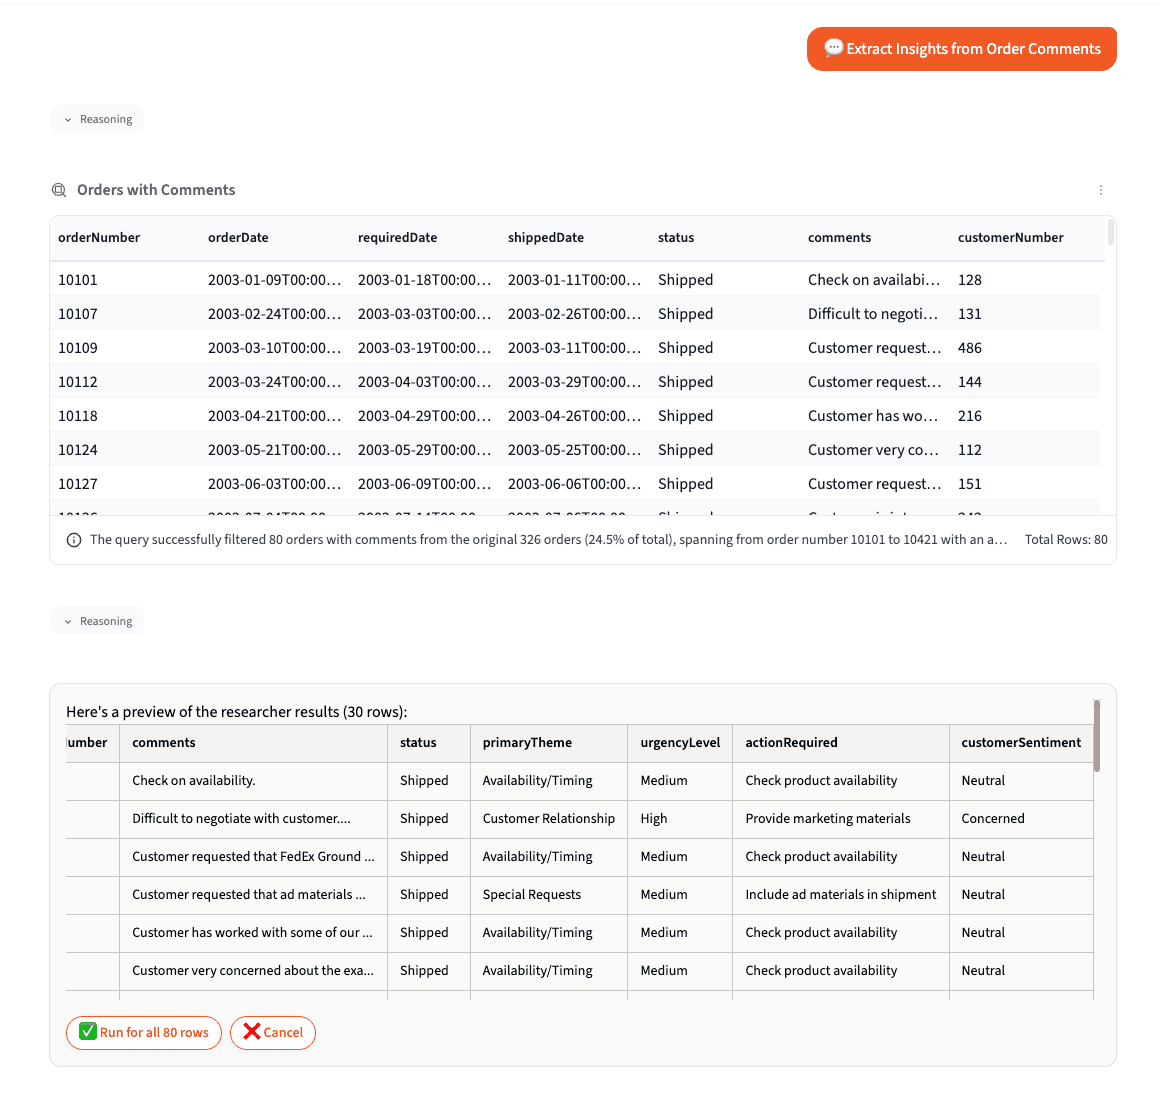
Like the Categorize tool, the Researcher uses a preview-then-execute workflow designed to save you from committing to the wrong approach on thousands of rows:
Phase 1 — Preview (30 rows). Querri processes a sample, builds the new columns, and shows you the results. Review the preview carefully: Are the categories what you expected? Are there misclassifications you want to catch before running the full dataset?
Phase 2 — Full execution. Once you confirm the preview looks right, choose to run on the full dataset. You can also filter first to reduce row count before processing.
Tips for Getting the Best Results
Be specific about output format. The more explicit you are, the better:
Vague: "Analyze these companies" Better: "Add an 'Industry' column classifying each company" Best: "Add an 'Industry' column with one of: Technology, Healthcare, Finance, Retail, Manufacturing, Services, Other"
Extract multiple columns in one pass. Instead of running the Researcher three separate times, ask for everything you need at once:
"Add these columns: Industry (Technology / Healthcare / Finance / Retail / Other), Company Size (Startup / SMB / Mid-Market / Enterprise), and Primary Product (the main product or service offered)."
This is faster and uses less processing capacity.
Reduce your row count first. The Researcher processes each row individually, so filtering or deduplicating before running it makes results faster and often cleaner. A common technique: classify unique values, then join the classifications back to your full dataset.
Categorize vs. Researcher: Which One Should You Use?
This is the most common question when working with unstructured text, so here's a clear answer:
| Question | Use This Tool |
|---|---|
| "What themes exist in my data?" | Categorize |
| "Classify each row into categories I define" | Researcher |
| "I don't know the categories yet — find them" | Categorize |
| "Extract specific information from each row" | Researcher |
| "Discover patterns across thousands of records" | Categorize |
| "Tag, score, or standardize each record" | Researcher |
A common workflow is to use Categorize first to discover what themes exist, then use the Researcher to apply a clean classification to your full dataset using the categories you just discovered.
Real-World Examples
Customer Feedback Analysis
Starting point: 3,000 open-ended survey responses. No idea what customers are talking about.
- Ask Querri: "What are the main themes in these survey responses?"
- Categorize analyzes the data and offers Broad / Medium / Specific levels — choose Medium for a working analysis.
- Querri processes the full dataset and adds a Theme column.
- Ask: "Show the top 10 themes by volume as a bar chart."
You went from 3,000 rows of text to a prioritized theme chart in minutes.
Support Ticket Routing
Starting point: 8,000 support tickets with subject lines and descriptions. You need to classify each one by priority and department.
- Ask Querri: "Add a 'Priority' column (Low / Medium / High / Critical) and a 'Department' column (Billing / Technical / Account / Other) based on the subject and body."
- Researcher previews 30 rows — review for accuracy.
- Confirm to run on the full dataset.
- Ask: "Show ticket count by Department and Priority as a stacked bar chart."
A dataset that previously required manual triage is now fully structured and ready for reporting.
CRM Data Enrichment
Starting point: 5,000 company records with a description field. You need industry and company size for segmentation.
- Ask Querri: "Add 'Industry' (Technology / Healthcare / Finance / Retail / Manufacturing / Services / Other) and 'Company Size' (Startup / SMB / Mid-Market / Enterprise) based on the description column."
- Preview confirms the classifications look right.
- Run on the full dataset.
- Now you can filter, segment, and analyze by industry and company size — fields that didn't exist before.
Frequently Asked Questions
The Bottom Line
Unstructured text data has always been the hardest part of any dataset to work with — not because the insights aren't there, but because the tools to surface them didn't exist for most teams.
The Researcher and Categorize tools are built for exactly this problem. Whether you're trying to understand what your customers are saying, clean up a messy CRM, or make sense of hundreds of survey responses — you now have a ridiculously straightforward way to get there.
Already have text data sitting in Querri? Try asking: "What are the main themes in [your column name]?" — and see what's been hiding in your data.
Related reading:
Tags