How to see which channels actually drive revenue, not just signups
Follow every account from first marketing touch through product activation to money collected, then rank channels by the revenue they truly produce. Built with HubSpot, Amplitude, and Stripe in Querri.
Open QuerriWhat you'll need
Querri (Free trial) to join data across systems, define your rules, and generate the analysis
HubSpot, Amplitude, and Stripe exports (contacts and campaigns, activation events, plus customers with charges and refunds)
A shared key that lines up records across the three systems: an internal account ID (best), or email as a fallback
Free resources
Start your free trial here →Sample data sets
Synthetic demo datasets, not real customer data. Safe to download and explore.
Need help?
If you have any questions, you can request a demo or email our team.
Before we begin
Most channel reports stop at signups. They tell you which channels fill the top of the funnel, but not which ones bring in customers who activate, pay, and stay. So budget flows to whatever produces the most volume, even when that volume never turns into revenue.
So which channels actually pay the bills? This playbook connects three systems into one account-level view: HubSpot for acquisition, Amplitude for activation, and Stripe for revenue actually collected. You'll follow each account from its first marketing touch all the way to realized revenue, then rank every channel by the money it truly produces.
How it works:
- • Connect HubSpot contacts and campaigns, Amplitude activation events, and Stripe customers, charges, and refunds
- • Build an identity bridge that links contacts, product users, accounts, and billing customers on account ID and email
- • Standardize channel names and define the rules: what counts as activation, what counts as realized revenue, and the maturity window
- • Attribute a first-touch channel to each account, then follow it through activation to money collected
- • Build the channel table and let Querri write the executive narrative on which channels over-index on volume and under-index on revenue
Follow the steps
Connect HubSpot, Amplitude, and Stripe
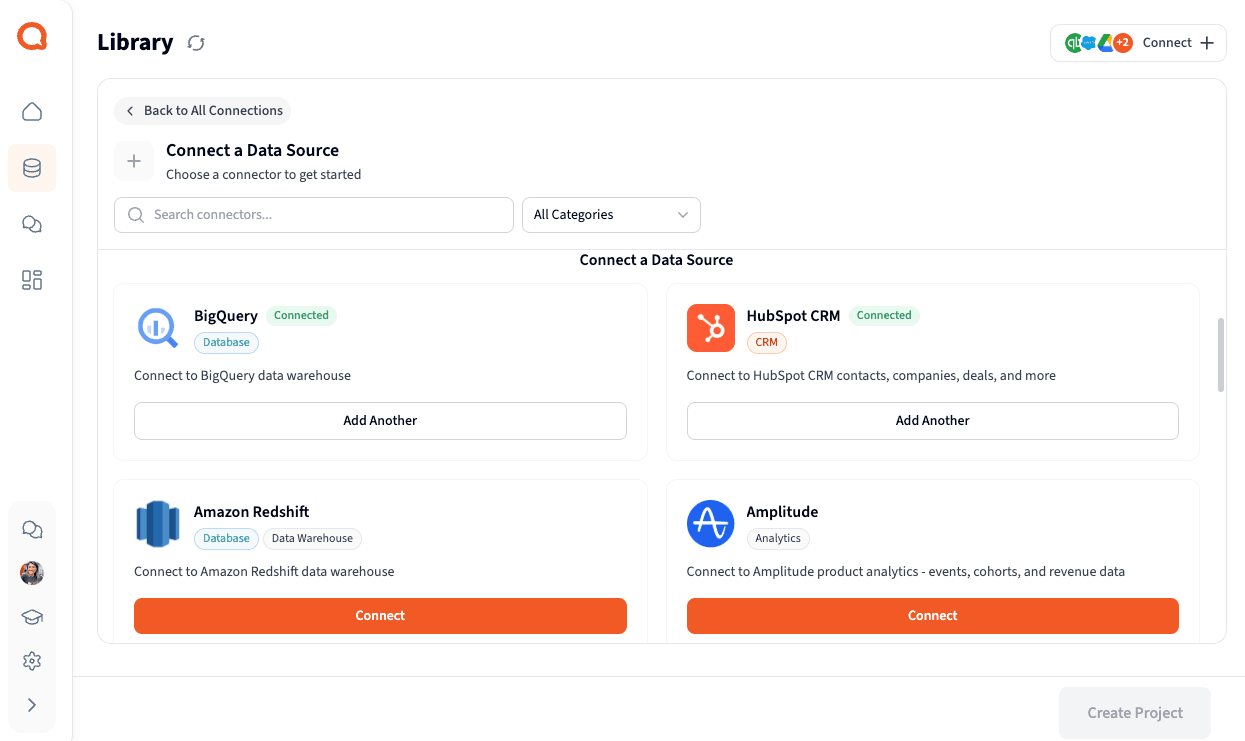
Upload exports from all three systems, or connect them directly. From HubSpot, bring contacts (with original traffic source and campaign fields) and campaigns; from Amplitude, signup and activation events with user and account IDs; from Stripe, customers plus charges and refunds. Querri profiles every file and gets it analysis-ready.
Tip: Pull Stripe Customers, not just charges. The customer record carries the email and any metadata (like your internal account ID) that makes joining back to HubSpot and Amplitude far more reliable.
Build the identity bridge
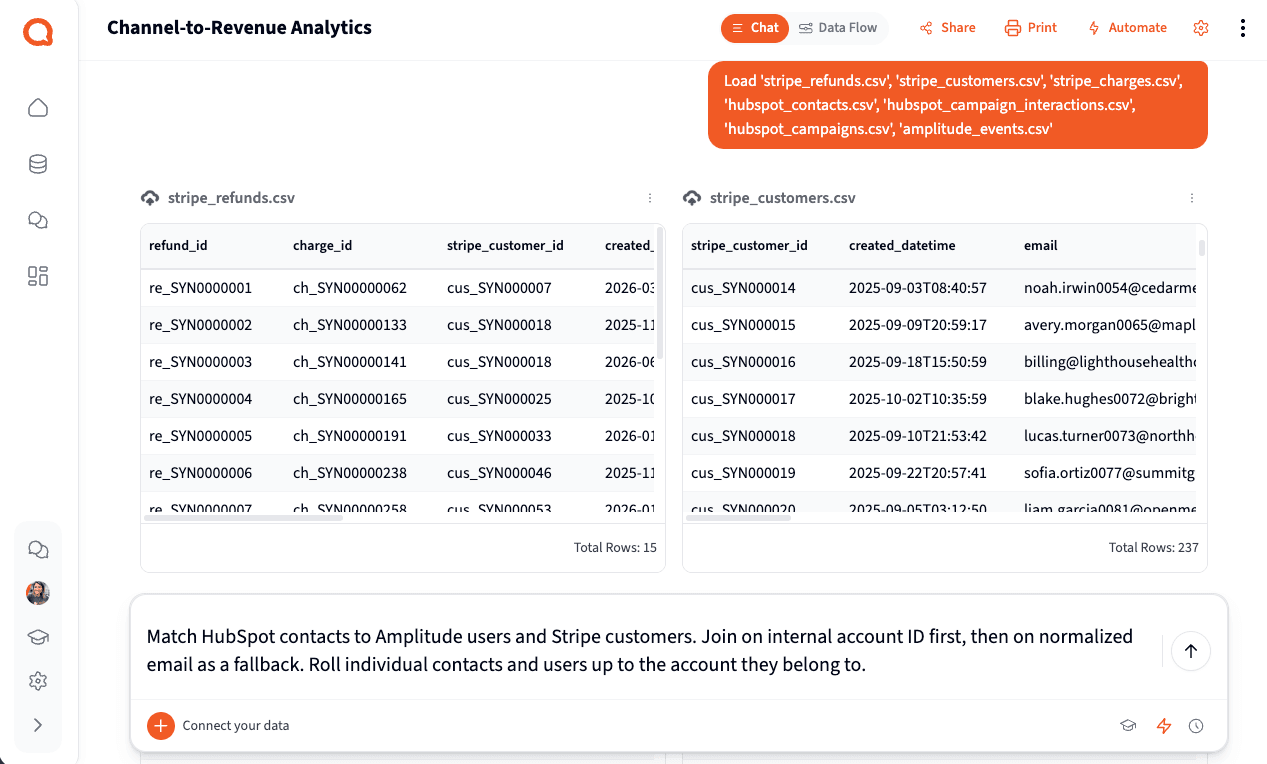
The hardest part of this analysis isn't the math. It's reliably recognizing the same company across three systems. Ask Querri to build one bridge that ties every record to a single account:
"Match HubSpot contacts to Amplitude users and Stripe customers. Join on internal account ID first, then on normalized email as a fallback. Roll individual contacts and users up to the account they belong to."
For B2B software this is an account-level analysis. Multiple contacts and product users belong to one customer, and Stripe usually has a single billing customer, so activation and revenue both roll up to the account.
Standardize channels and define the rules
Raw source values and campaign names are messy, and "revenue" means different things to different teams. Set the rules once so the numbers are defensible:
"Map HubSpot original traffic sources and campaigns into our channel taxonomy. Define activation as an account completing a core action within 14 days of signup, and realized revenue as captured charges minus refunds. Compare each account within 90 days of signup."
Save these as business rules: channel taxonomy, activation event, realized-revenue formula, and a fixed maturity window. That keeps newer channels from looking artificially weak, and keeps everyone measuring the same thing.
Attribute first-touch channel and follow the money
Now connect the path from channel to cash. Assign each account to the channel behind its earliest known marketing touch, then attach activation and realized revenue:
"Attribute each account to its first-touch channel. For every channel, count signup accounts and activated accounts, then attach realized revenue collected within 90 days of signup."
This is deliberately first-touch attribution: each account is credited to the channel that first brought it in. It's simple to explain and hard to argue with. Just state it clearly so no one expects a multi-touch model.
Build the channel table and the executive story
Bring it together into one table that ranks channels by the revenue they actually produce. Then let Querri write the narrative your leadership needs to reallocate budget with confidence.
The narrative Querri writes:
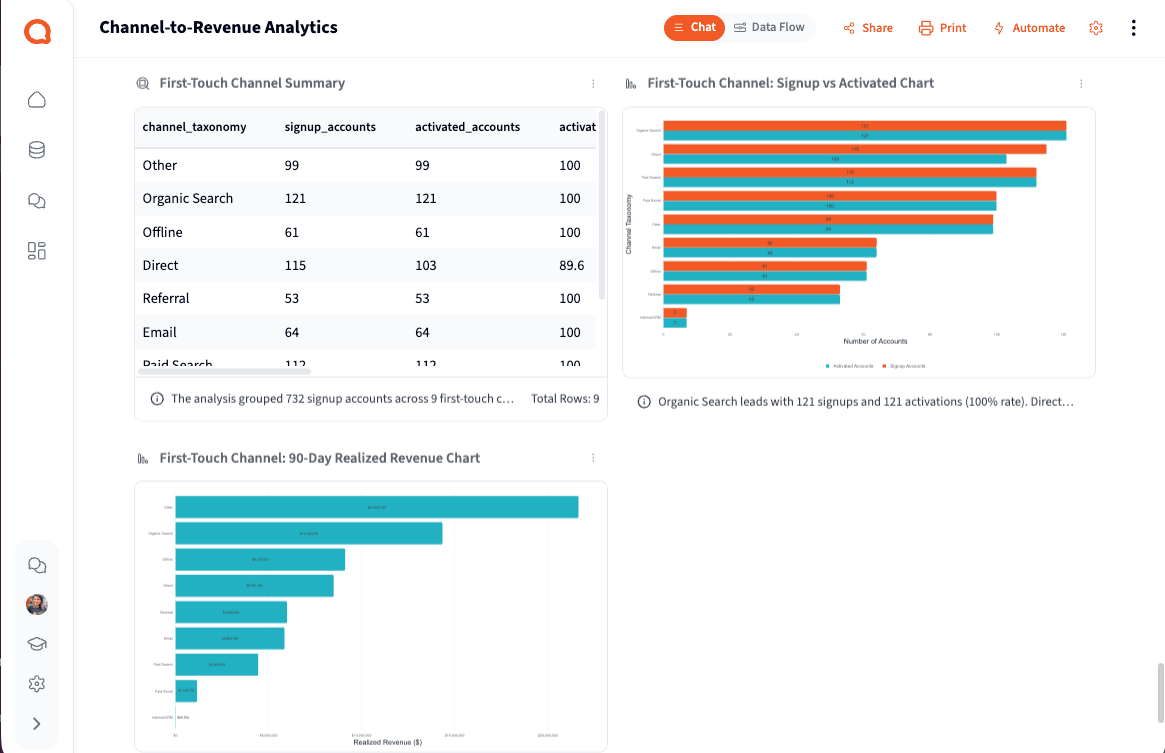
Across the 9 first-touch channels, you have 732 signup accounts and 720 activated accounts for an overall activation rate of 98.4%, with $71,134,225 in realized revenue collected within 90 days of signup (captured charges minus refunds).
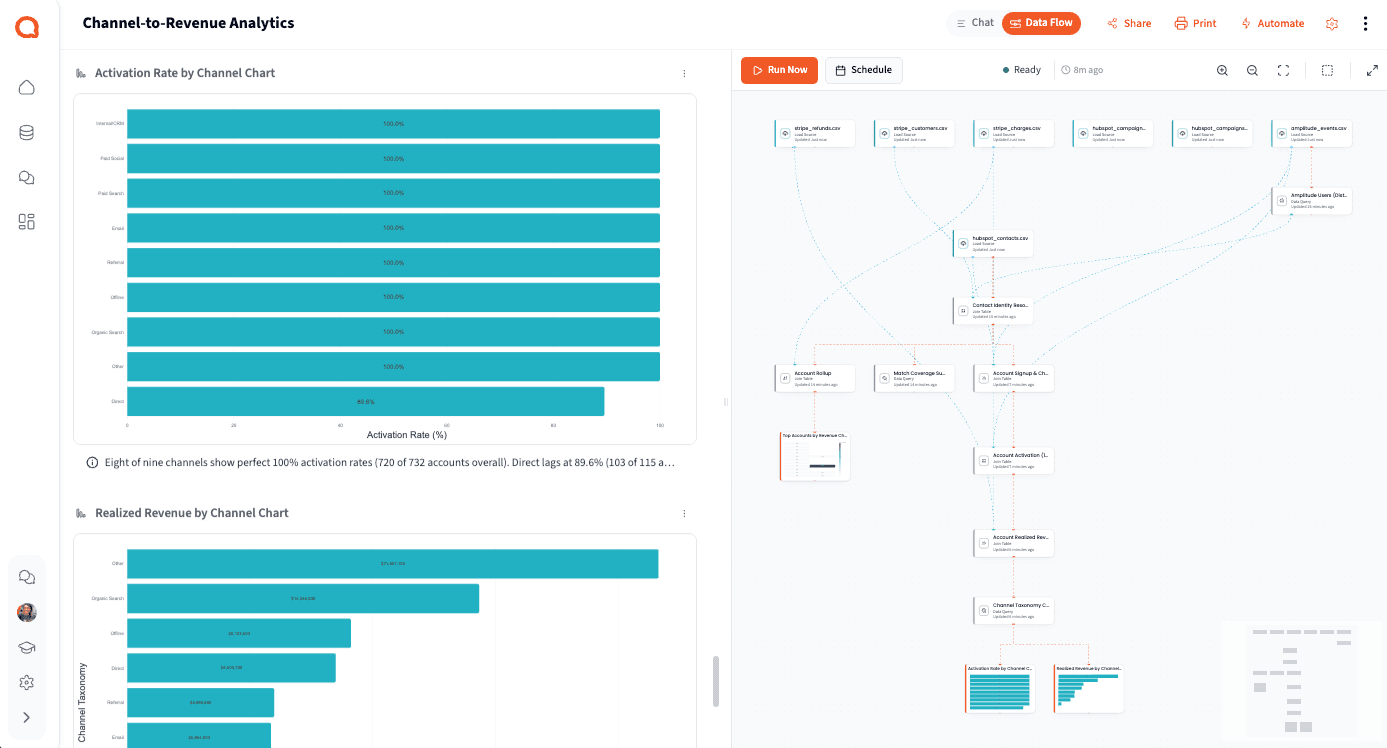
- • Activation is effectively maxed: 8 of 9 channels sit at 100%. Direct is the only exception at 89.6% (103 activated out of 115 signups), so fix the Direct signup path first.
- • Organic Search is the biggest first-touch driver at 121 signups (all activated), followed by Other at 99. These are the highest-volume channels to protect and expand.
- • Revenue concentrates in "Other": it leads 90-day realized revenue at $21,657,125, about 30% of the $71,134,225 total, so break "Other" into sub-sources to find what's really producing the money.
- • Internal/CRM brings in just $29,700 despite 100% activation on 7 signups: reliable for activation, but not yet a meaningful revenue driver in the first 90 days.
What you can create or export:
- A 10-slide executive presentation you can present live, share by link, or download
- The first-touch channel summary and account rollup tables, exportable to Excel, CSV, or Google Sheets
- Channel charts (activation rate, 90-day realized revenue, signups vs activated, top accounts) as PNG or SVG
- A reusable identity bridge that unifies HubSpot, Amplitude, and Stripe into account-level records, with a match-coverage summary
- A saved project you can automate to refresh the analysis as new data lands
| Channel | Signup accounts | Activation rate | 90-day realized revenue | Revenue per signup |
|---|---|---|---|---|
| Other | 99 | 100% | $21,657,125 | $218,759 |
| Organic Search | 121 | 100% | $14,346,200 | $118,564 |
| Offline | 61 | 100% | $9,123,500 | $149,566 |
| Direct | 115 | 89.6% | $8,500,700 | $73,919 |
| Referral | 53 | 100% | $5,990,800 | $113,034 |
| 64 | 100% | $5,864,900 | $91,639 | |
| Paid Search | 112 | 100% | $4,455,600 | $39,782 |
| Paid Social | 100 | 100% | $1,165,700 | $11,657 |
| Internal/CRM | 7 | 100% | $29,700 | $4,243 |
First-touch channels ranked by 90-day realized revenue
Tips for a channel-to-revenue report leadership trusts
Join on account ID, not just email
Email is the easy starting point, but people change addresses, billing emails differ from product logins, and one account has many users. An internal account ID is the reliable long-term key, so treat email as a fallback.
Report realized revenue, not "closed" revenue
A closed-won CRM deal isn't cash. Stripe tells you what was actually collected: captured charges minus refunds. If leadership needs both, show closed-won value and realized revenue side by side.
Fix the maturity window before you compare
A channel that drove signups last week hasn't had time to produce revenue. Compare every account within the same window after signup (say, 90 days) so new and old channels are judged fairly.
Define activation as an action, not a login
"Logged in" isn't activation. Pick a core action, like created a project, connected a data source, or invited a teammate, and roll it up to the account so the metric reflects real product value.
Track your match rate
Report the share of records you successfully joined across HubSpot, Amplitude, and Stripe. A low match rate is a data-quality problem, not a channel result, so surface it before anyone acts on the numbers.
Frequently asked questions
Why not just use HubSpot's attribution reporting?
Is a signup the same as a HubSpot contact?
Should I use first-touch or multi-touch attribution?
Is this an account-level or contact-level analysis?
What if account IDs aren't stored across all three systems?
How do we handle refunds, disputes, and currencies?
How long does this take to build?
Other popular resources
Examples
Browse all use cases
Explore how other teams use Querri for data analysis.
Blog
How agentic AI works
Learn how Querri's AI agents transform your data analysis.
Demo
Request a walkthrough
See Querri in action with your own data.
Pricing
Compare plans
Find the right plan for individuals, teams, or enterprise.