Where do new signups stall before they reach first value?
Reconstruct the journey from signup through onboarding to first value, find the step that loses the most accounts, and rank the fixes that win back the most revenue. Built with Amplitude, HubSpot, and Salesforce in Querri.
Open QuerriWhat you'll need
Querri (Free trial) to join data across systems, define first value, and build the funnel
Amplitude, HubSpot, and Salesforce exports (product events, contact lifecycle and source, plus the converted-account list)
A shared key that lines records up across systems: an internal account ID (best), with email and company domain as fallbacks
Free resources
Start your free trial here →Sample data sets
Synthetic demo datasets, not real customer data. Safe to download and explore. Follow along and you'll get the same numbers you see below.
Need help?
If you have any questions, you can request a demo or email our team.
Before we begin
Most onboarding reports stop at a signup count. They tell you how many people started, but not where those people quietly stall before they ever get value. So teams keep pouring signups into the top of the funnel while the same broken step leaks accounts out the middle.
So where do new signups actually stall? This playbook reconstructs the whole journey (signup, onboarding actions, first value, eventual conversion) by joining three systems into one account-level view: Amplitude for behavior, HubSpot for acquisition source, and Salesforce for the accounts that ultimately became customers. You'll find the biggest stall point, see who it hurts most, and rank the fixes by accounts lost.
How it works:
- • Upload the Amplitude event stream, HubSpot contact lifecycle data, and the Salesforce converted-account list
- • Define first value explicitly, then reconstruct each account's signup-to-first-value funnel
- • Find the step that loses the most accounts, then segment that drop-off by acquisition source
- • Compare time-to-first-value for accounts that converted versus those that went cold
- • Output a prioritized list of onboarding steps to fix, ranked by the accounts each one loses
Follow the steps
Upload Amplitude, HubSpot, and Salesforce
Upload exports from all three systems, or connect them directly. Amplitude gives you the behavior: the event stream for every new signup, with user and account IDs, event name, and event time. HubSpot supplies the acquisition side, so bring contacts with their original source, campaign, and lifecycle stage. Salesforce is the outcome, so bring the converted-account list with company domain and close date. Querri profiles every file and gets it analysis-ready.
Tip: Export at least 12 months of Amplitude events so slow-to-activate accounts aren't cut off, and include the email and company domain on every record. Those fields are what let Querri stitch the same account together across all three systems.
Define first value and build the funnel
First value is the first moment an account actually gets the benefit it signed up for. Declare it explicitly, then ask Querri to reconstruct every account's path from signup to that moment:
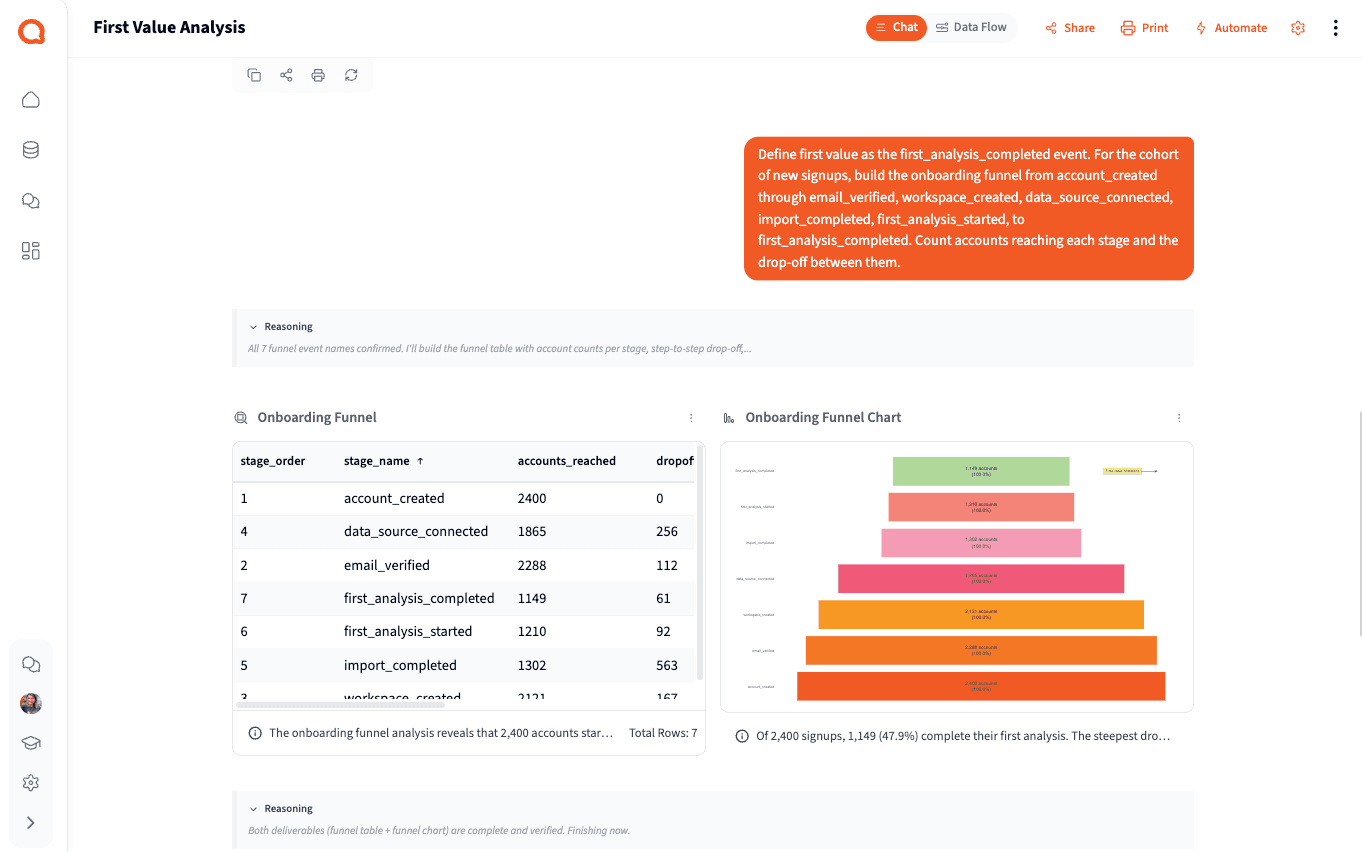
"Define first value as the first_analysis_completed event. For the cohort of new signups, build the onboarding funnel from account_created through email_verified, workspace_created, data_source_connected, import_completed, first_analysis_started, to first_analysis_completed. Count accounts reaching each stage and the drop-off between them."
Notice the definition. First value is first_analysis_completed, a finished and useful result, not merely uploading a file or finishing setup. Of 2,400 new signups, 1,149 reach it. That's an activation rate of 47.9%, and now you can see exactly where the other 1,251 fall out.
Find the drop-off and segment it by source
One step loses far more accounts than any other. Find it, then ask Querri to break that stall down by the HubSpot acquisition source each account came from:
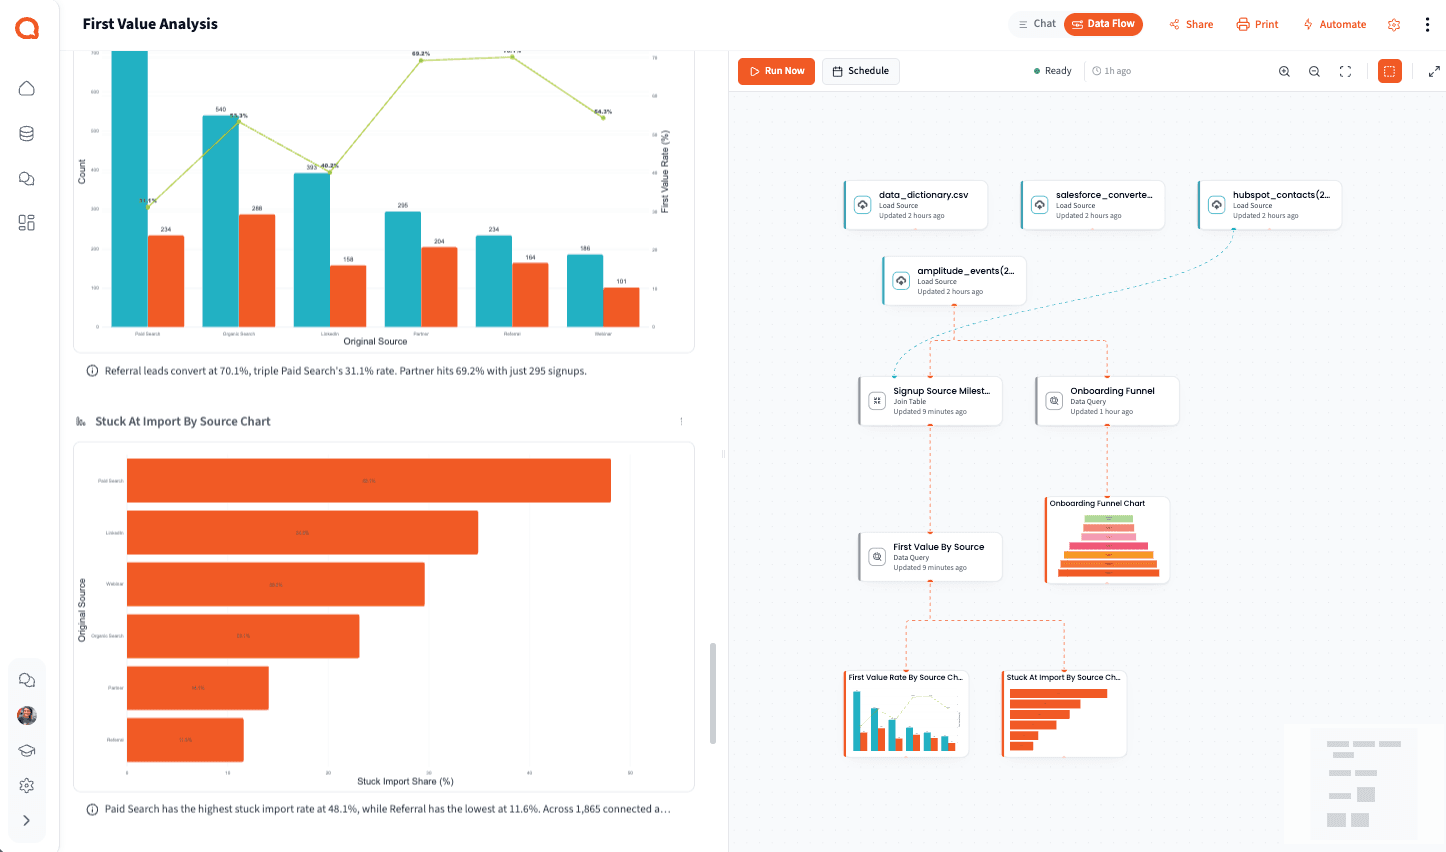
"Identify the funnel step with the largest drop-off. Then join signups to their HubSpot original source and, for each source, show signups, the number reaching first value, the first-value rate, and the share of accounts that connect a data source but never complete their first import."
The biggest stall sits between connecting a data source and completing the first import. 563 accounts, 30% of everyone who gets that far, never make it through. That's more than the next four steps combined. And it isn't even. Paid Search brings the most signups but stalls at import nearly half the time, while Referral and Partner signups sail through.
Compare time-to-first-value: converted vs cold
Now bring in the business outcome. Ask Querri to match signups to the Salesforce converted-account list and compare how the two groups move through first value:
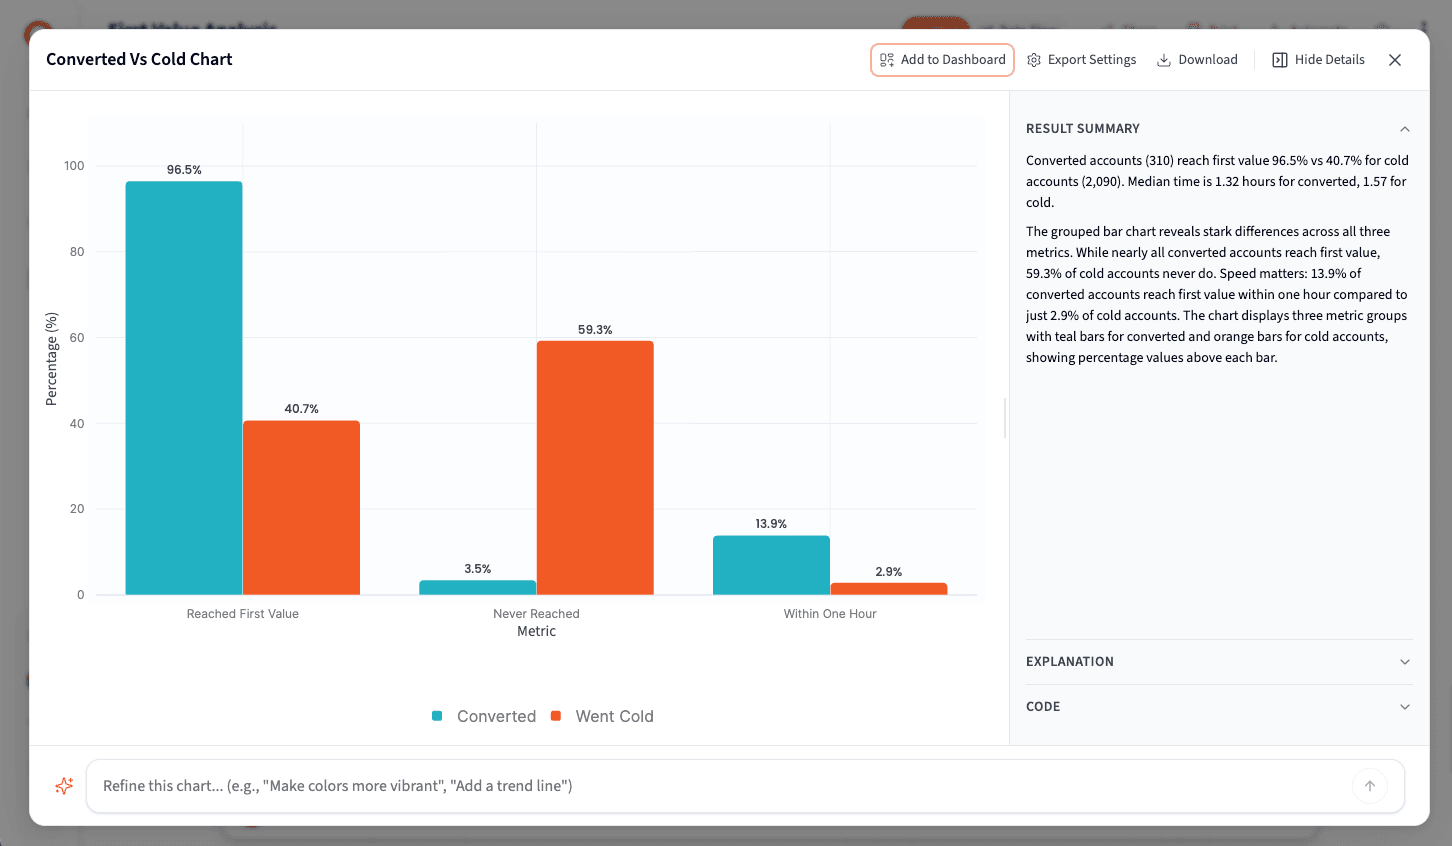
"Match accounts to the Salesforce converted-account list on company domain. Compare converted accounts against accounts that went cold on: share reaching first value, share that never reach it, median time to first value, and share reaching first value within one hour."
Reaching first value is the clearest early signal of a future customer. 97% of converted accounts reached it, versus 41% of the accounts that went cold. Only 3% of customers never reached it, against 59% of non-customers. Converted accounts also get there a little faster. This is association, not proof of causation, but it's a signal worth building onboarding around.
Output the prioritized list of fixes
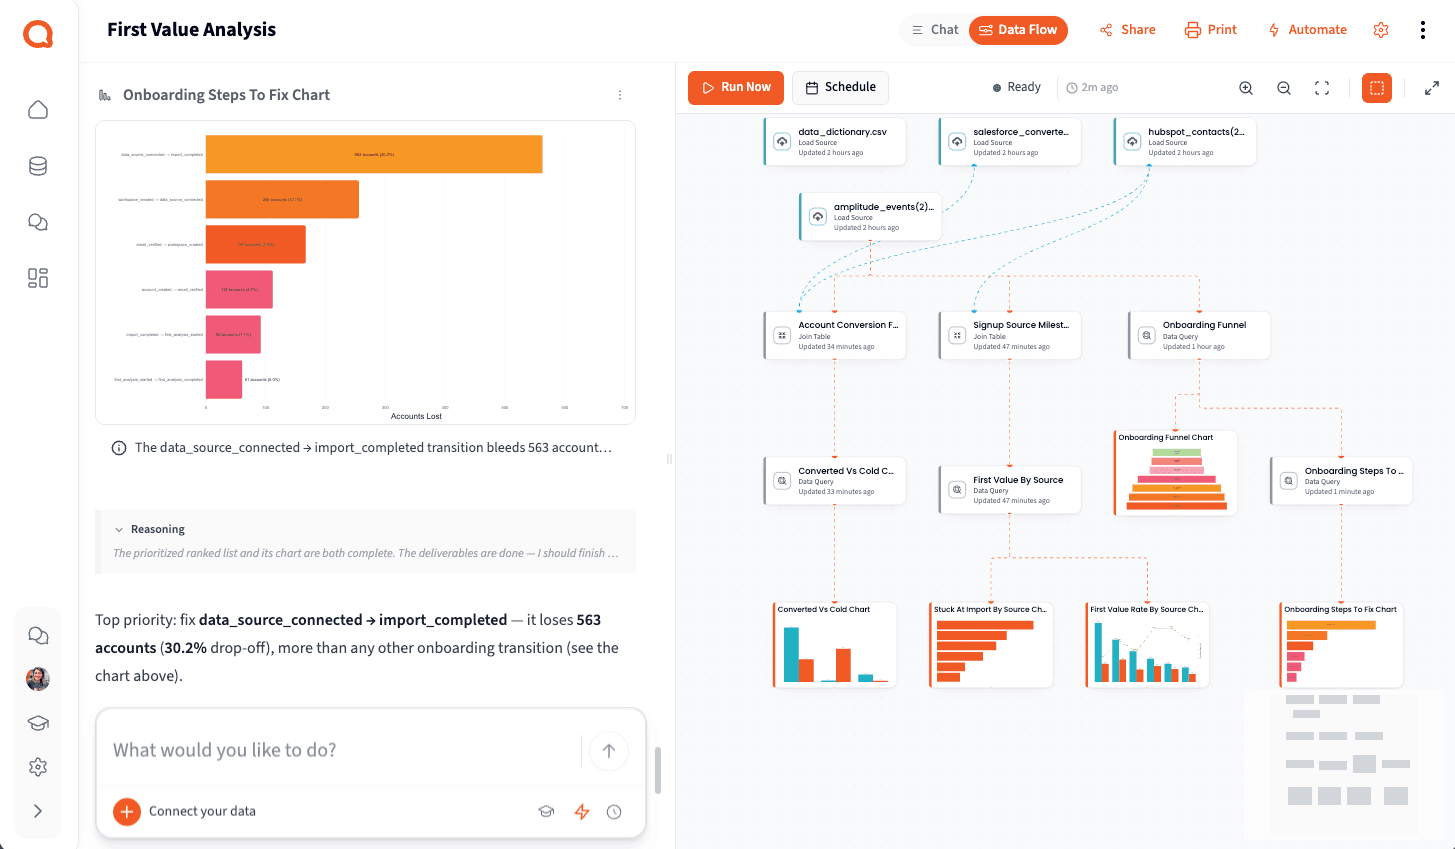
Bring it together into one ranked list: the onboarding steps to fix, ordered by the accounts each one loses. Then let Querri write the narrative your growth and product teams need to decide what to fix first.
The narrative Querri writes:
Of 2,400 new signups, 1,149 reach first value (47.9%). The leaks aren't even, so fix them in order of accounts lost.
- • Import is the bottleneck: 563 accounts connect a source but never finish the first import (30%), usually an import error. Fix it first.
- • Paid Search brings the most signups but the lowest first-value rate (31%); Referral and Partner reach value around 70%.
- • First value predicts revenue: 97% of customers reach it, versus 41% of accounts that went cold.
- • The v2 onboarding already lifted connect-to-import from 66% to 74%.
What you can create or export:
- A 10-slide executive presentation you can present live, share by link, or download
- The funnel, source-segmentation, and prioritized-fix tables, exportable to Excel, CSV, or Google Sheets
- Funnel and cohort charts (stage drop-off, first-value rate by source, time-to-first-value) as PNG or SVG
- A reusable identity bridge that unifies Amplitude, HubSpot, and Salesforce into account-level records, with a match-coverage summary
- A saved project you can automate to refresh the funnel as new signups and events land
Tips for a first-value funnel your team can act on
Define first value as received value, not finished setup
"Completed onboarding" and "logged in" are not first value. Pick the first event where the account actually gets the benefit it came for, here a finished analysis result, and declare it explicitly. That one definition decides everything the funnel measures.
Measure the funnel at the account level
Multiple users belong to one company, and revenue lands on the account. Roll product events up to the account so activation, source, and conversion all line up on the same unit. Use individual users only when you're specifically measuring per-seat adoption.
Rank fixes by accounts lost, not drop-off rate
A 30% loss on a step everyone reaches beats a 50% loss on a step almost no one reaches. Rank by accounts lost, not drop-off rate, and fix in that order.
Always segment the stall by source
An average funnel hides the real story. Here Paid Search stalls at import four times as often as Referral. Break every drop-off down by acquisition source so you can fix the onboarding step and question the spend that feeds it.
Track time-to-first-value as a KPI
Time to first value is simply the first-value timestamp minus the signup timestamp, and it spans both Efficiency and Quality in Querri's Five Dimensions. Track the median, the 25th and 75th percentiles, and the share reaching value within an hour, a day, and a week.
Have a Data Dictionary? Bring it. Don't have one? Build a first draft in Querri.
A Data Dictionary documents what the fields in your data mean, how important business terms are defined, and how different systems relate to one another. In this playbook we included a sample Data Dictionary so Querri has context for what each field represents and how the Amplitude, HubSpot, and Salesforce data should be interpreted. In your own company that context might live in a spreadsheet, an internal wiki, a tracking plan, CRM documentation, or a data catalog.
Show me how to bring or build one
If you already have a Data Dictionary
Upload it alongside the data you want to analyze and tell Querri how you want it used. Querri can work across multiple Sources in one project, investigate their structure and contents, identify data types and relationships, and join Sources when needed.
"Use our Data Dictionary as the reference for interpreting the Amplitude, HubSpot, and Salesforce data in this project. Use its definitions for fields, business terminology, and known relationships between Sources. If the data appears to conflict with the dictionary, flag the conflict rather than making an assumption."
If you don't have a Data Dictionary
Use Querri to create a useful first draft. Upload the Sources you want documented, then ask Querri to inspect them and build a table with everything a good dictionary needs:
- Source name
- Field or column name
- Inferred data type
- Example values
- Likely business meaning
- Possible relationships to fields in other Sources
- Questions or ambiguities that need human clarification
"Review the Sources in this project and create a first-pass Data Dictionary. For every field, show the Source, field name, inferred data type, example values, likely business meaning, and any fields that appear useful for joining Sources. Flag definitions you cannot determine confidently instead of guessing."
Then add the business context only your team knows
Querri can infer a lot from the data itself, but some definitions require human knowledge. Querri might recognize that first_analysis_completed is an Amplitude event, but your team still needs to say that it's the event you use to define first value. Other rules Querri can't learn from the data alone:
- • company_domain is the preferred key for matching HubSpot companies to Salesforce accounts
- • Internal employee accounts should be excluded from customer analysis
- • "Converted" means a Salesforce opportunity reached Closed Won
- • A specific HubSpot field is the source of truth for acquisition channel
Save your standard definitions once
When a definition is a company standard, save it once instead of restating it in every chat. Add organization-wide rules in Context Settings, and Querri applies them automatically to every analysis your team runs. For the bigger picture, the Querri Library is where your company's data context lives: it learns your business and keeps your sources, definitions, and business rules consistent everywhere. Once your dictionary looks right, you can export it to CSV or Excel for use outside Querri.
A good Data Dictionary gets better with human review
Think of Querri's generated dictionary as a starting point, not the final authority. Querri does the tedious part: profiling fields and proposing definitions. Your team confirms the business meaning, corrects ambiguous definitions, and adds the rules that can't be learned from the data. That gives you something far more useful than a list of column names. It gives you a shared reference for how your company actually understands its data.
Frequently asked questions
What exactly is "first value"?
Why join Amplitude, HubSpot, and Salesforce instead of just using an Amplitude funnel?
How do you match records across three systems that don't share one ID?
Should first value be a single event or a whole sequence?
How is this different from a plain onboarding funnel?
Doesn't faster time-to-first-value just correlate with conversion rather than cause it?
How long does this take to build?
Other popular resources
Examples
Browse all use cases
Explore how other teams use Querri for data analysis.
Blog
How agentic AI works
Learn how Querri's AI agents transform your data analysis.
Demo
Request a walkthrough
See Querri in action with your own data.
Pricing
Compare plans
Find the right plan for individuals, teams, or enterprise.