The Data Audit and the Janitor
Automatic data cleaning
It finds what's wrong with your data. Then it cleans it with you.
More than 180 checks on every table as it arrives. The Data Audit ranks what it found by the answers it affects, and the Janitor asks the calls only you can make, then builds a cleaned view every answer uses.
Agentic data cleaning
Meet your janitor
Press Clean this table and the Janitor goes to work. It reads what the Data Audit found, tries each fix on your own rows, and stops only for the calls it can't make alone. That is agentic data cleaning: the agent does the work, and you make the decisions that change a number.
-
Start it on a table or a note
Press Clean this table on a table, or Ask the Janitor on a single note. It already has the evidence the audit measured.
-
It asks the calls only you can make
Month-first or day-first? Which currency column wins? Which duplicate row to keep? Each question arrives as a choice card with its recommendation first.
-
It shows you the plan
A review card lists every fix and what it will leave as is. Nothing is built until you press Build the cleaned view.
-
You get a cleaned view
The result is a new view you can open, and the table's card reads Cleaned as with its name. The original stays exactly as it arrived.
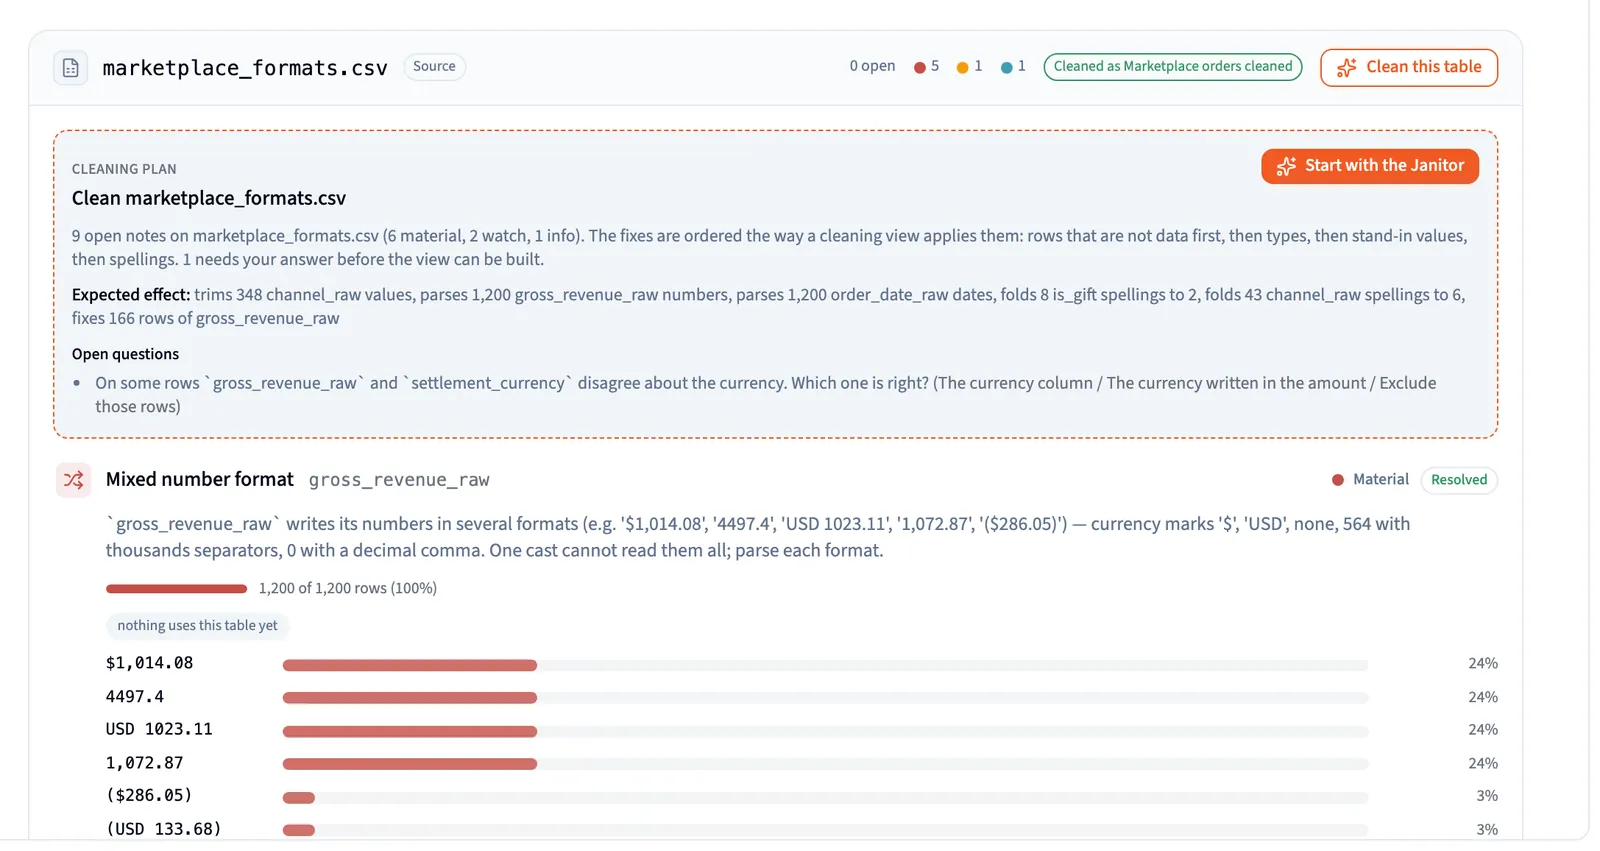
A silent recording. The Janitor is asked to clean a marketplace orders file. It asks three questions as choice cards, each with its recommendation first: month-first or day-first dates, which currency column wins, and which duplicate row to keep. It shows a review card listing every fix, the view is built, and the table then reads Cleaned as Marketplace orders, cleaned.
Automatic data quality
The Data Audit: more than 180 checks on every table as it arrives
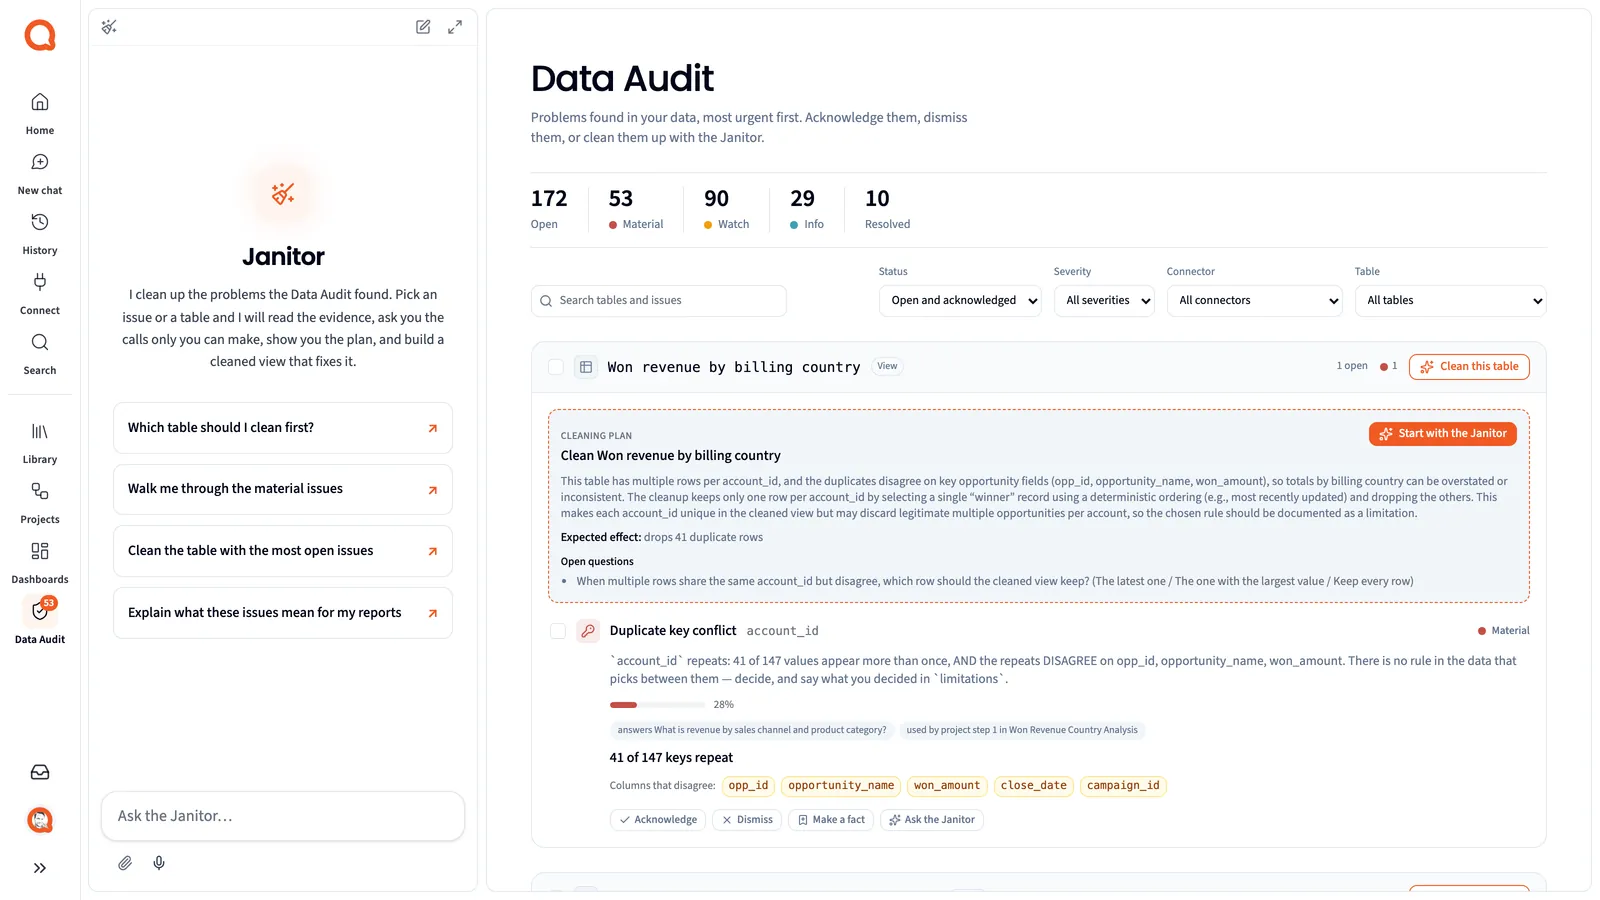
Every table you upload or connect is checked when it lands, before anyone asks a question, and every view is checked as it is built. It looks for the problems people know to look for, and the ones nobody would think to. What it finds goes on one page, the Data Audit, most urgent first, with why each problem matters.
What the checks look for
Missing values in disguise
N/A, a dash or a blank stored as text, 1900-01-01 standing in for an unknown date, 999 standing in for an unknown age.
Numbers and dates stored as text
Amounts with $, € or commas, negatives in brackets, two number formats or several date formats in one column, Excel serials posing as dates.
Spellings and names
Retail, retail and RETAIL counted as three channels, yes/no written six ways, one ID carrying several names.
Duplicates and keys
Rows repeated exactly, keys that repeat, and keys that repeat and disagree about the numbers.
Values that can't be right
Negative quantities, percentages above 100, dates in the future, a total that isn't the sum of its parts.
Spreadsheet structure
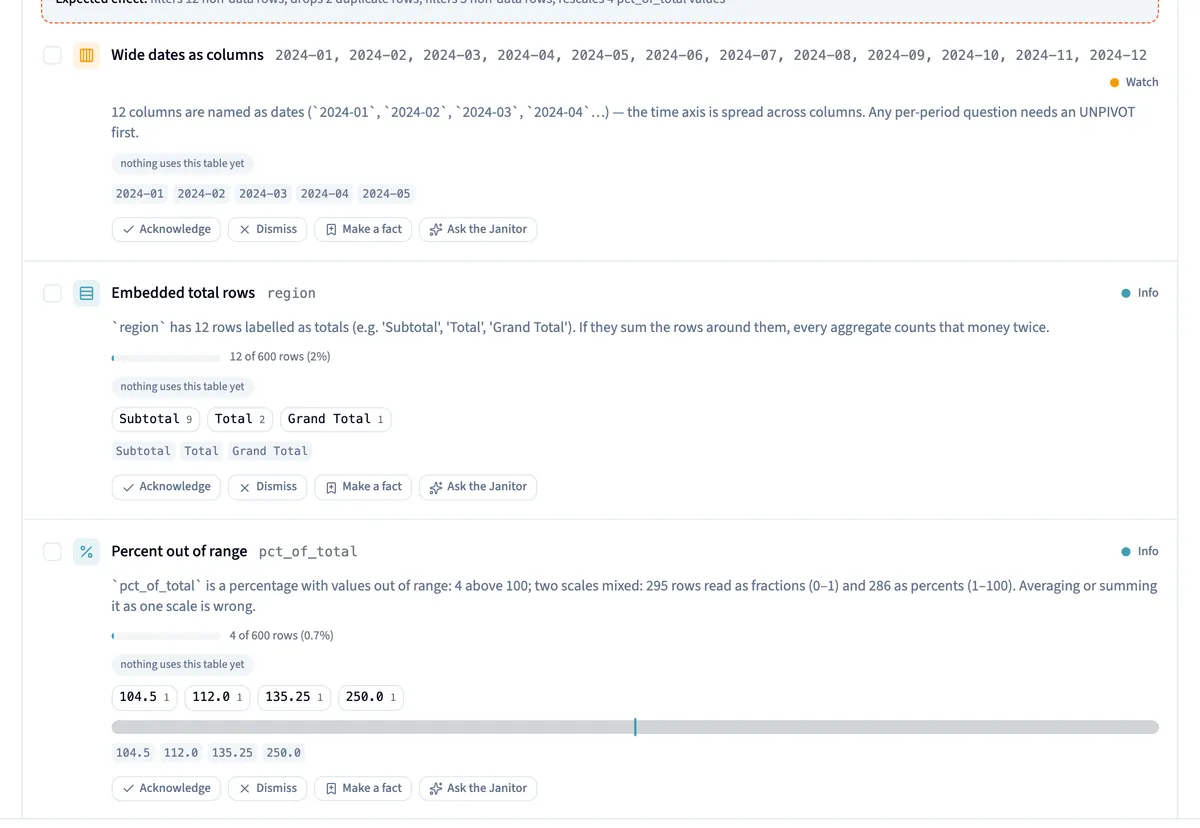
Totals rows inside the data, headers repeated mid-file, months laid out as columns, a file cut off at Excel's last row.
IDs and encoding
Zip codes that lost their leading zero, IDs exported as 1.23E+11, garbled accents, invisible characters inside values.
Time and freshness
A table that stopped updating, a last month only half loaded, gaps in a series, a running balance that must never be summed.
Order of events
An end date before its start, a shipment never delivered, an opportunity closed before its account existed.
Against your data dictionary
Codes in the data that your dictionary doesn't list, and columns documented as numbers but stored as text.
Priority
Ranked by what it does to your answers
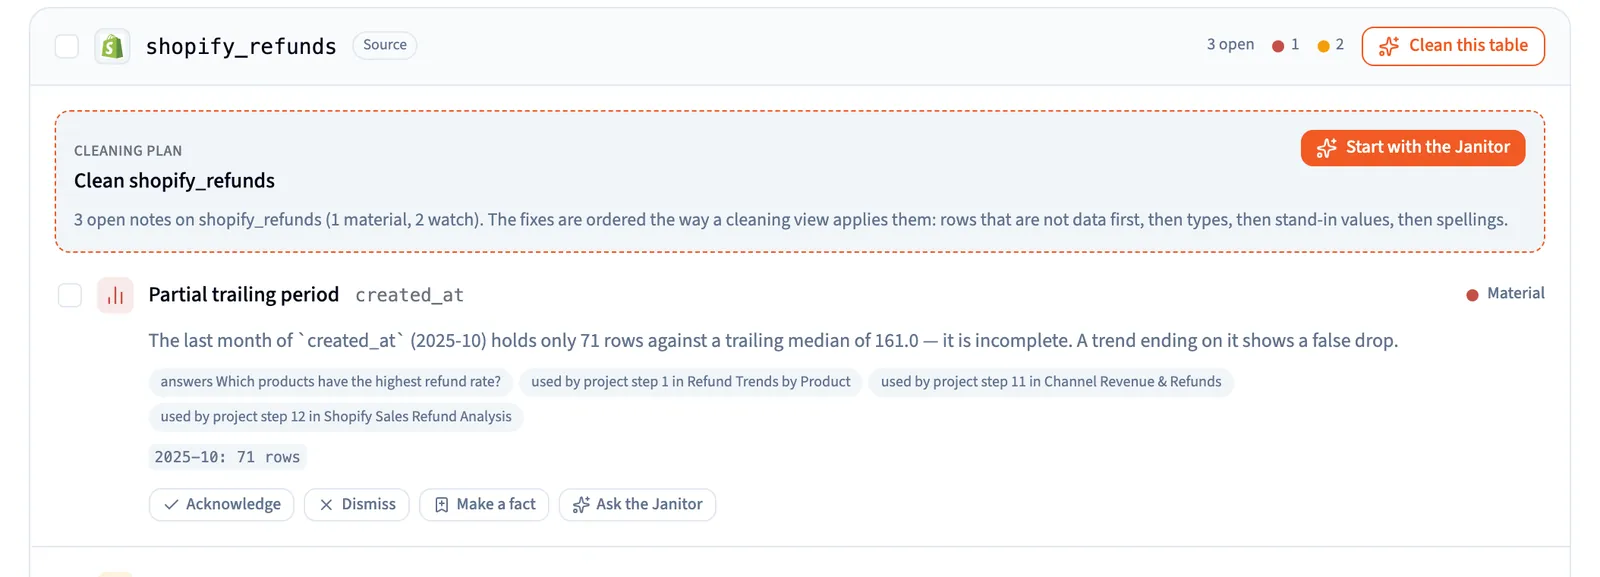
Each note is marked Material, Watch or Info, and ranked by how much your business leans on that column. A problem in a column that feeds a KPI or a saved question comes before a cosmetic one in a table nobody uses, and the note says which questions it affects.
Your call
A finding is something you can handle
Acknowledge what you already know about. Dismiss what isn't a problem here, and the reason is kept. Make a fact of it, and agents read it whenever they use that data. Select a range to handle several notes at once, and search the whole audit as you type.
A silent recording scrolling one table's card in the Data Audit: an Excel serial posing as a date, zip codes that lost their leading zero and duplicate keys, each note with the share of rows it touches, examples and a small chart built from the measurement.
Messy data, caught
Examples of what it catches
Problems like these sit in data for years, until someone says the number is wrong.
One customer, counted as two
An invisible zero-width or trailing space makes "Acme" and "Acme " two customers. Nothing looks wrong on screen, and the total splits in two.
Month-first and day-first in one column
Is 01/08/2024 January 8 or August 1? The check proves the order from values above 12 and flags a column that mixes both. When the data can't settle it, the Janitor asks you.
A Grand Total row inside the data
A totals row left in a spreadsheet export is counted again in every sum built on it.
Currency symbols in a number column
$1,014.08, USD 1023.11 and ($286.05) in one column. A plain conversion drops some values to blank and reads the negative in brackets as positive.
European decimals, a thousand times too low
1.234,56 can come out as 1.23456 with no error at all. Mixed separators are flagged, so the column doesn't pass as clean.
The same order id, two different totals
Two rows for order 5521 that disagree. Nothing in the data says which one is right, so it becomes a call for you, not a silent guess.
A gap in a daily series
No rows for March 3 to 17, or a last month holding 15 rows against a usual 61, so every trend ends in a drop that never happened.
Codes that drifted from the data dictionary
The region column holds 9 where your data dictionary lists 1 to 4. The audit checks coded columns against your own dictionary.
Placeholder dates
34,000 birth dates of 1900-01-01 make the average customer 120 years old.
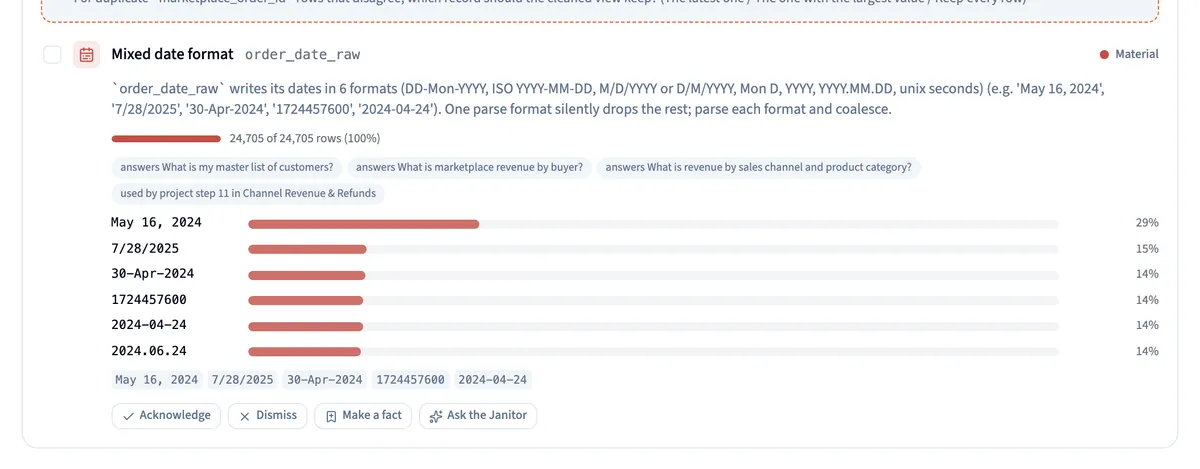
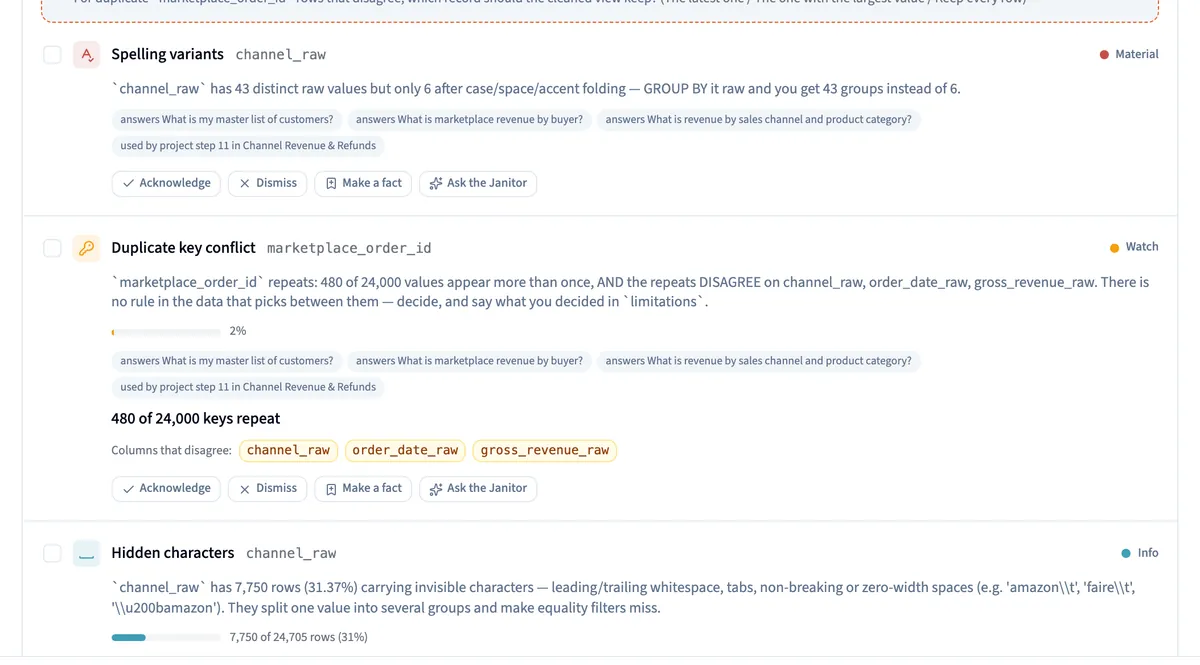
Screens captured in Querri with demo company data.
Nothing silently rewritten
Every fix is a view you can open
Your raw data stays exactly as it arrived. The Janitor's work becomes a cleaned view: SQL you can open, with the source still there to check it against.
Proof the cleaning worked
Querri measures the cleaned view again with the same checks. A note is marked resolved only when its problem no longer shows up. One that still does stays open, and the Janitor says so.
Cleaned once, used everywhere
The source then reads Cleaned as and the view's name, and every answer, dashboard and AI agent reads the cleaned view from then on.
Decisions that stick
Dismiss a note with a reason and it stays settled. The next agent to touch the table reads your decision instead of raising the problem again.
How it fits
From the moment your data arrives
-
Upload or connect
A spreadsheet export, a CSV, or tables from a connected system or database. The Library holds them all.
-
The audit runs as data arrives
The checks run inside the scan Querri already does when a table lands, and again on each view as it is built. Nobody has to ask.
-
Clean with the Janitor
Work through the Data Audit most urgent first, or press Clean this table and answer the calls that are yours.
-
Every answer already knows
Open notes travel with the column into every agent's brief. When the data forced a choice, the answer tells you which one it made.
FAQ
Questions about automatic data cleaning
What is automatic data cleaning?
Automatic data cleaning means the problems in your data are found and fixed without anyone writing rules or scripts first. In Querri, the Data Audit runs more than 180 data quality checks on every table as it arrives, and the Janitor, an AI agent, cleans what it found with you. The result is a cleaned view that answers, dashboards and agents use from then on.
What is a data audit?
A data audit is a systematic check of a dataset for the problems that make its numbers wrong: missing values in disguise, numbers stored as text, duplicates, mixed formats, gaps. In Querri, the Data Audit is a page that runs more than 180 checks on every table as it arrives and lists what it found, most urgent first, with why each problem matters.
What is automatic data quality?
Data quality checks that run without anyone writing a rule or asking for them. Querri checks each table when it is uploaded or connected and each view when it is built, and records every problem it finds as a data quality note you can acknowledge, dismiss or clean.
What does agentic data cleaning mean?
An AI agent does the cleaning work with you instead of handing you a list. The Janitor reads the Data Audit's evidence, tries fixes on your rows, asks you the calls only you can make, shows its plan, and builds a cleaned view when you say so. Querri then measures that view again to prove which problems are gone.
Which data sources can Querri clean?
Any table that reaches Querri, from a file or a connector. That includes Shopify, Stripe, Salesforce, HubSpot, Pipedrive, QuickBooks, NetSuite, Klaviyo, Mailchimp, Intercom, Zendesk, Google Ads, Meta Ads, Amazon Seller, Google Analytics, Mixpanel, Amplitude, warehouses and databases such as Snowflake, BigQuery, Redshift, Postgres, MySQL, SQL Server and Oracle, files in Google Drive, and spreadsheet and CSV uploads. Data cleaning for Shopify orders or Salesforce opportunities works the same way as for an exported CSV.
Can I clean data from several sources before joining them?
Yes. Each table gets its own audit and its own cleaned view, so you clean each source first and then join the cleaned views. Dates end up in one format, currencies are handled the way you chose, spellings are folded and IDs are repaired within each source, which is what lets the join line up. The audit also checks detected join keys across tables, such as child rows whose key has no match in the parent table.
Does it clean Excel and Google Sheets exports?
Yes. Spreadsheet exports get checks of their own: totals and subtotal rows inside the data, header rows repeated mid-file, months laid out as columns, Excel serial numbers posing as dates, IDs turned into 1.23E+11, zip codes that lost their leading zero, and a file that stopped at Excel's last row. Upload the export as it is and the Data Audit lists what it found.
Can it standardize dates and currencies across systems?
Within each table, yes, and that is what makes tables from different systems agree. The audit spots several date formats in one column, proves day-first or month-first from the values where it can, and flags mixed currencies or an amount whose currency disagrees with the currency column. The Janitor asks the calls only you can make, such as whether to convert currencies or keep them separate, and the cleaned view writes every date and amount one way.
How does it handle duplicates?
It separates three cases: rows repeated exactly, keys that repeat with the same values, and keys that repeat but disagree, such as one order id with two totals. The first two can simply be collapsed. When repeats disagree, nothing in the data says which is right, so the Janitor asks you which row to keep, with its recommendation first.
Does it change my original data, or make a copy?
Your raw data stays exactly as it arrived. The fix is a cleaned view, defined in SQL you can open and built from the source rather than written over it. The source stays beside it so you can check one against the other.
What is a cleaned view, and does it keep working when new data arrives?
A cleaned view is a saved view that applies the Janitor's fixes to the source table, and the source then reads Cleaned as with the view's name. Because it is a saved definition rather than a one-off edit, it runs the same way on next month's data. When the view is rebuilt, Querri measures it again, and a problem that comes back reopens its note.
How is this different from a data quality tool or a cleaning script?
Many data quality tools watch pipelines for engineers, or show column statistics and wait for someone to build the fix, and a cleaning script only checks what it was written to check. Querri runs its checks on every table before anyone asks, ranks what it found by the questions and KPIs that read each column, asks you the calls that change a number, and builds the fix as a view it then measures again.
Who sees the data quality notes, and who approves a fix?
Notes follow the same access rules as the tables they describe, and where someone can only see some of the rows, the example values are left out. A fix is never applied on its own: the Janitor shows its plan on a review card and builds the cleaned view only when the person working with it says so.
Can I tell it a rule once?
Yes. Dismiss a note with a reason and it stays settled, so the next agent reads your decision instead of raising the problem again. Use Make a fact to save what you know about the data, and agents read that fact whenever they use it.
Works with the rest of Querri
Clean data, everywhere it's used
No more Monday morning spent fixing the export.
See the Data Audit on your own tables, then clean one with the Janitor.