Every dashboard you'd move to a new tool is a rebuild by hand. So nobody moves.
Your dashboard, rebuilt on your own data in minutes.
Paste a screenshot of the dashboard you use today, from any tool, or a photo of a whiteboard sketch, and Querri rebuilds the layout, charts and calculations on your data. Then you change it by asking.
Dashboards without the project.
Paste a screenshot. Get the dashboard back.
Paste the dashboard you rely on today, from any tool or slide. Querri reads its charts, numbers, layout and colors, lists what it matched in a Replication plan, and builds it. This is Querri rebuilding a sample dashboard we made.
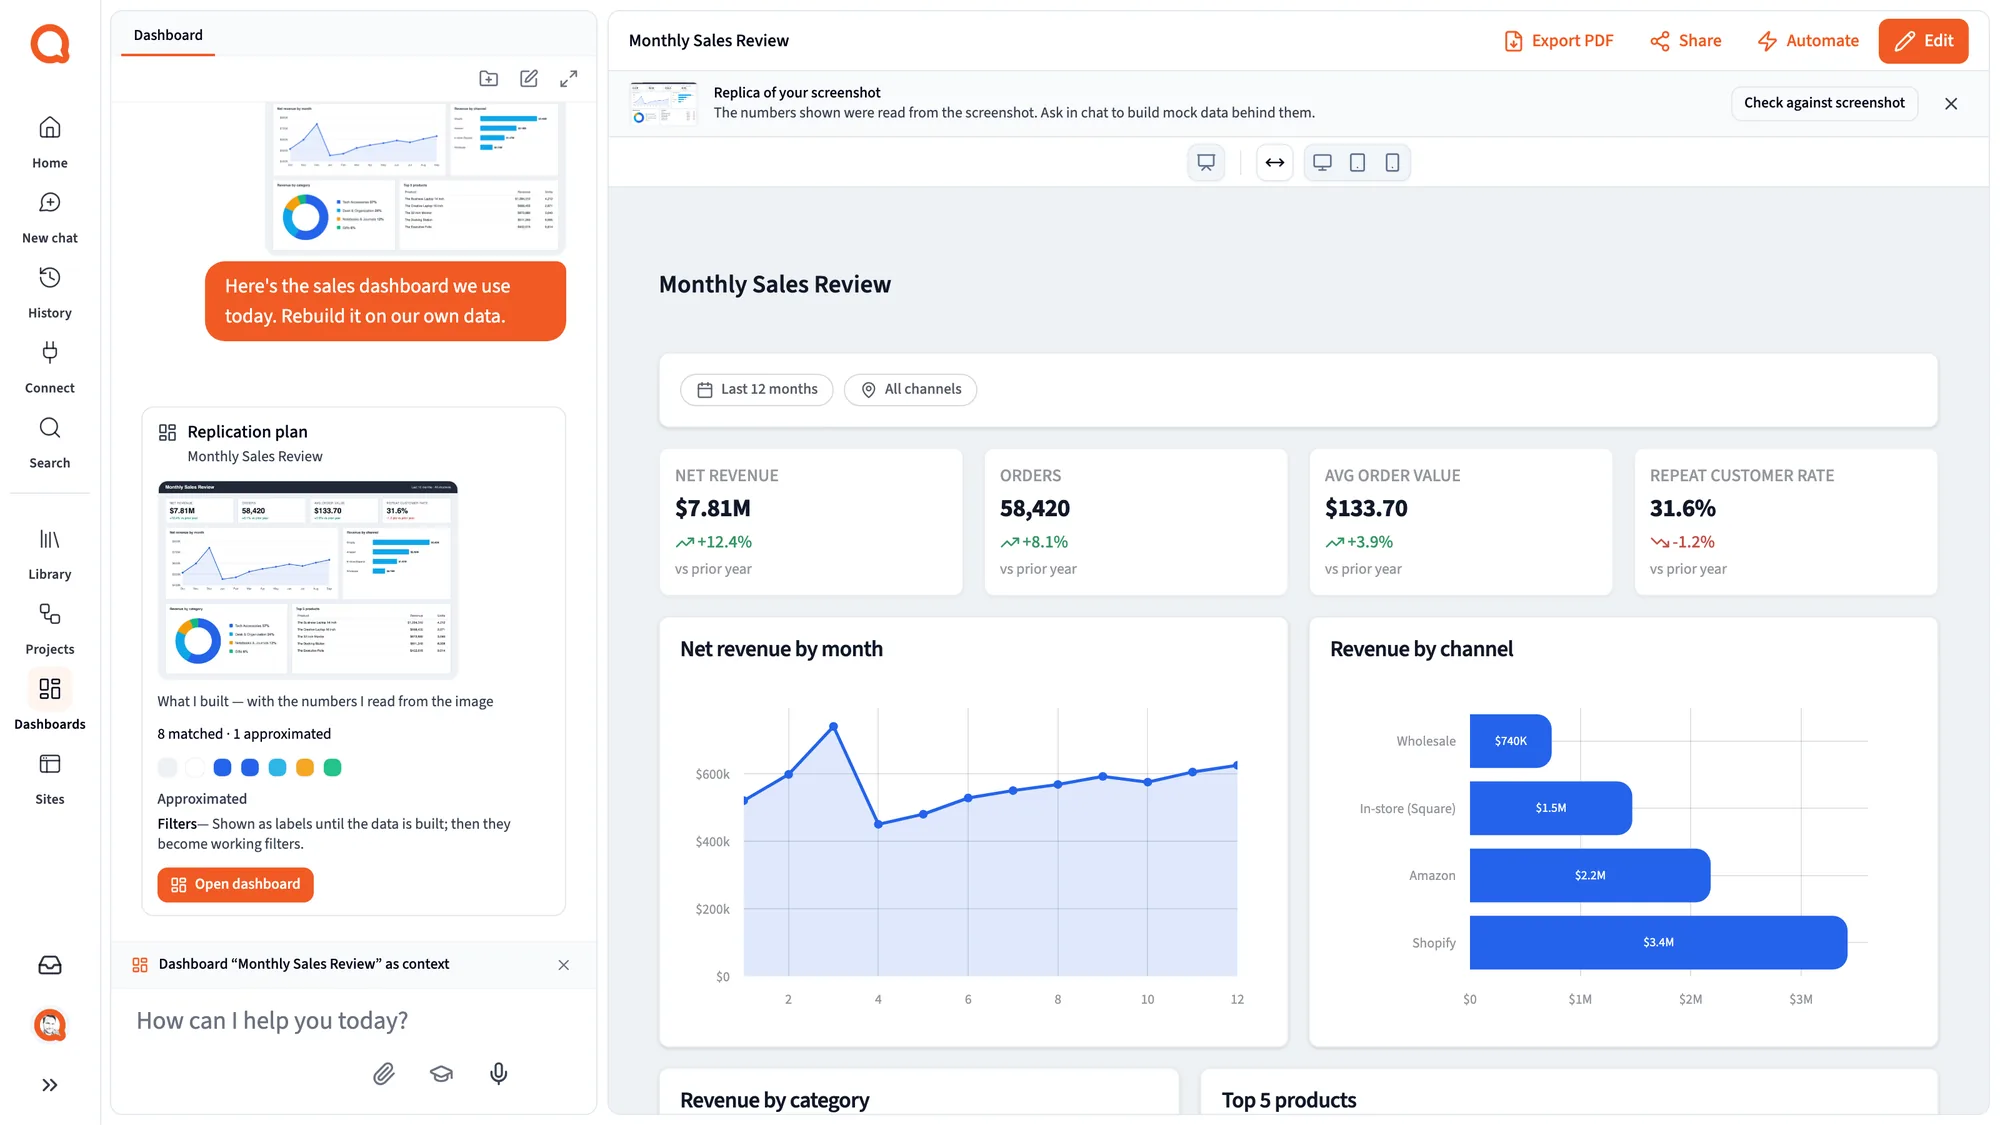
Paste the picture. Get it back on your own data, calculations included.
Querri reads the widgets, numbers, layout and colors, works out the calculation behind each metric and proposes which of your columns feed it. You confirm. Then it writes the SQL and chart code as project steps and binds every widget to them.
- The numbers come from queries you can open, not copied from the image.
- Anything it can't map is generated and labeled.
- Works from a screenshot of any tool or slide, or a photo of a whiteboard sketch.
It tells you what it matched, before you build.
The Replication plan marks every element as matched, approximated or not possible yet, before anything is built. You see the gaps up front and decide what to do about them.
- Revenue KPI Matched
- Orders KPI Matched
- Revenue by month Matched
- Pipeline by stage Matched
- Sales by region map Approximated
- Custom hover card Not possible yet
It checks its copy against your original.
Check against screenshot compares the rebuilt dashboard with the picture you pasted and fixes the styling with the same dashboard tools a person uses. Each fix can be undone.
Then build by saying it. One click undoes it.
The Dashboard tab in the Ask panel adds KPI cards and charts, adds filters, moves and resizes widgets, groups the page into sections and re-themes it. Restyling only touches display settings, so it can never change the data.
- Before it adds a filter, it tells you how many widgets the filter reaches.
- If a filter would quietly give a wrong number, like filtering after a top 10, Querri won't add it without telling you why.
- The assistant's edits are grouped, with one Undo.
In the app
A pasted screenshot, read and rebuilt.
These are screenshots of Querri with a demo company's data. The pasted image is a sample dashboard we made. The first rebuild shows the numbers read from the picture, and a banner says so.
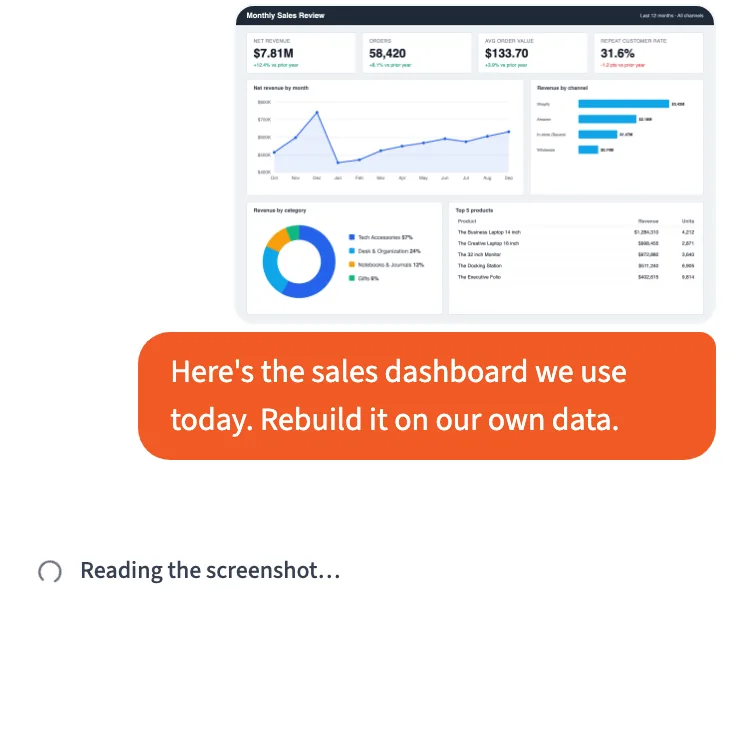
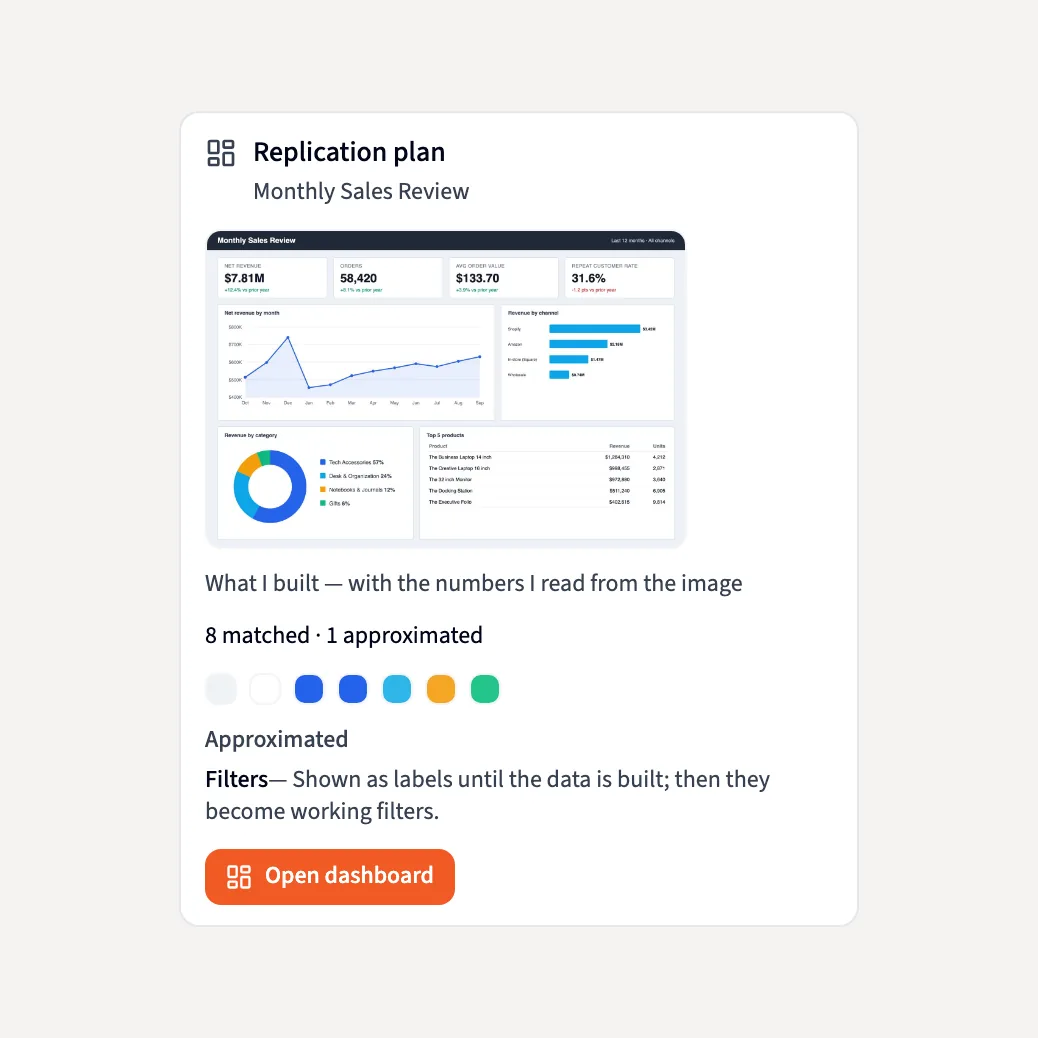
A rebuild you can stand behind, not a look-alike.
On your connected data
Unlike pasting the picture into a chatbot, every number comes from a query you can open, and the dashboard refreshes on schedule.
Only data you can already read
The mapping only offers sources you can read, and the build re-checks access before it runs.
The same numbers everywhere
Every chart reads from project steps on the same Library as chat, so the dashboard matches the answers in chat, Excel and Claude.
Viewers can ask why
Anyone viewing the dashboard can ask what a number means and where it comes from, and sees only their own rows. Only editors can change it.
From picture to working dashboard in three steps.
- 1
Paste a screenshot or a sketch
Drop in a screenshot of a dashboard from any tool or slide, or snap a photo of a whiteboard.
- 2
Review the plan
See what Querri matched, approximated or can't do yet. Choose your connected data and confirm which columns feed each metric.
- 3
Use it, then change it by asking
Querri builds it on your data and checks it against your screenshot. Every later change is a sentence, not a ticket.
Good news for everyone who touches the dashboard.
The people who read it
The dashboard you already know how to read, back in front of you, and now you can ask it why a number moved.
The people who run it
Paste the dashboard people already trust, confirm which columns feed it, and every later change is a sentence instead of a ticket.
The people who support it
Moving off, or alongside, a BI tool stops being a migration project, and the rebuild never reaches data the person couldn't already see.
Questions teams ask before they paste
Which dashboards can I paste?
A screenshot of a dashboard from any tool or slide, or a photo of a whiteboard sketch. Querri reads its widgets, numbers, layout and colors.
Does it just copy the numbers from the picture?
No. It works out the calculation behind each metric and proposes which of your columns feed it. Once you confirm, it writes the SQL and chart code as project steps on your own connected data. Anything it can't map is generated and labeled.
What if it can't match something exactly?
It says so before you approve anything. The Replication plan marks every element as matched, approximated or not possible yet, and Check against screenshot fixes what differs. A business rule the picture can't show, you teach once in plain language.
How long does a rebuild take?
Minutes, on your own connected data.
Do we have to replace our BI tool?
No. Rebuild the dashboards people want to ask questions of and keep the rest where they are.
Can someone break a dashboard by chatting with it?
Only editors can change a dashboard. Restyling can't touch the data, a filter that would give a wrong number is refused with an explanation, and one click undoes everything the assistant did.
Can the rebuild reach data I shouldn't see?
No. The mapping only offers sources you can already read, and the build re-checks access before it runs.
Bring the dashboard. Skip the migration project.
Paste one you use today and see it working on your own data.