Which lanes should our sales effort go to?
Join your Tai load export to HubSpot. Rank lanes by loads and net revenue per load, find the markets that take in more loads than they send, and see which shippers your best lanes come from.
Open QuerriWhat you'll need
Querri (Free trial) to join the exports and run the checks
A Tai load export and HubSpot: Step 1 says what each adds
Your lane rules: so every lane is ranked the same way
Free resources
Start your free trial here →Sample data sets
Synthetic data for a made-up freight brokerage. Not real shipper data.
Need help?
If you have any questions, you can request a demo or email our team.
Before we begin
Sales effort tends to follow the busiest lanes. Busy and profitable aren't the same thing, and a market that takes in far more loads than it sends is a sales opportunity in the other direction. The lanes and rates are in the TMS and the shipper profiles are in the CRM, so a lane plan usually rests on whichever report someone pulled last.
This playbook ranks October's lanes by loads and net revenue per load, finds the markets that need outbound freight, and profiles the shippers behind the strongest lanes.
How it works:
- • Upload the Tai export and connect HubSpot
- • Rank lanes by loads and net revenue
- • Find markets that take in more than they send
- • Profile the shippers on strong lanes
- • Build the lane focus list
Follow the steps
Upload the Tai export and connect HubSpot
Two systems, one project:
- •
Tai load export (or your TMS load report): every load with origin, destination, equipment, customer total and carrier total.
- •
HubSpot: each shipper's industry, region and Tai customer code.
HubSpot connects directly and syncs on a schedule. The Tai export comes in as a file; upload next month's over the old one and every view rebuilds.
Tip: Pull at least seven months of loads, so every lane has a six-month average to compare with.
-
 Tai load export
-
 HubSpot companies
 One project
Rank lanes by loads and net revenue per load
Start with volume, and put each lane's earnings next to it:
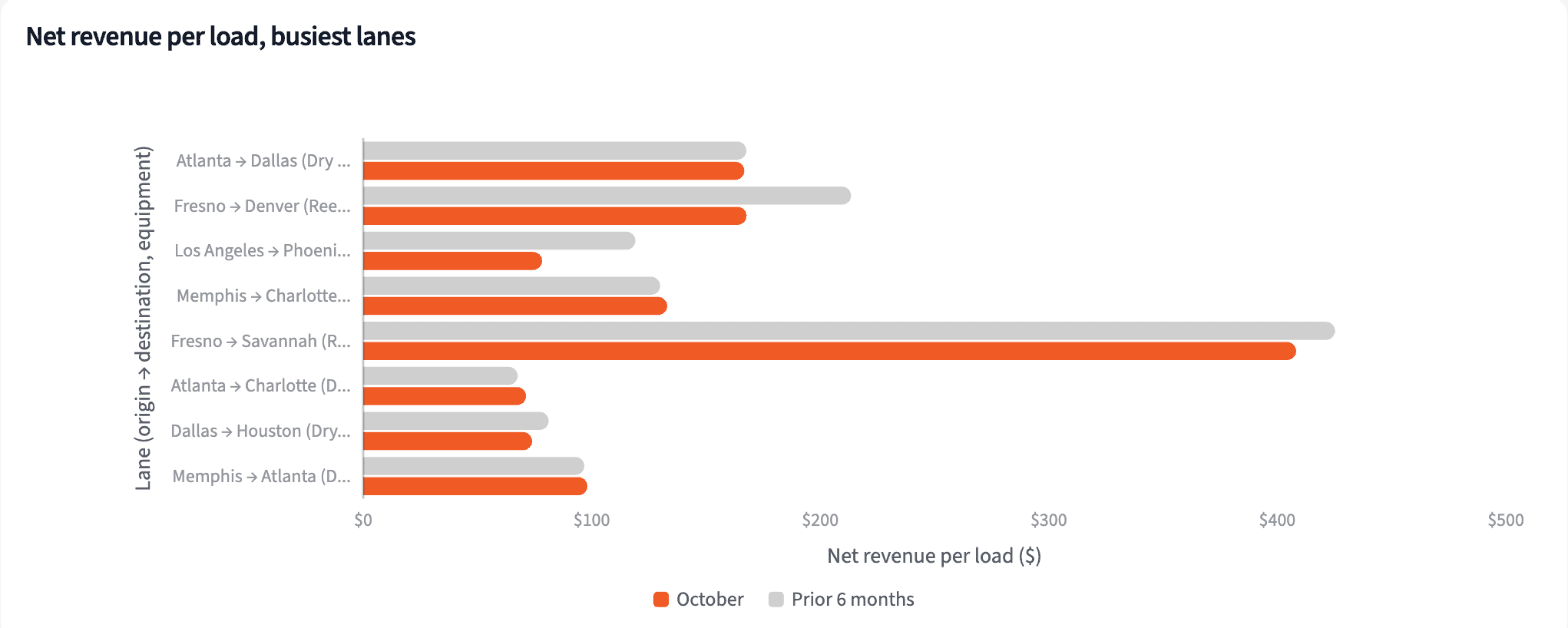
"Rank October's lanes by loads, with net revenue per load against April to September. Which busy lanes slipped?"
Atlanta to Dallas is the busiest lane by far and holding steady. Los Angeles to Phoenix earns 34.3% less a load than its April to September average, the largest drop among lanes with 30 or more October loads. Six of the top 10 lanes are down.
| Lane | October loads | Per load, usual to October | Change |
|---|---|---|---|
| Atlanta to Dallas (Dry Van) | 249 | $168 to $167 | -$1 |
| Fresno to Denver (Reefer) | 169 | $213 to $168 | -$46 |
| Los Angeles to Phoenix (Reefer) | 115 | $119 to $78 | -$41 |
| Memphis to Charlotte (Dry Van) | 85 | $130 to $133 | +$3 |
Busiest lanes, October 2026, net revenue per load against April to September.
Find the markets your loads deliver into most
Compare loads in and loads out for every city:
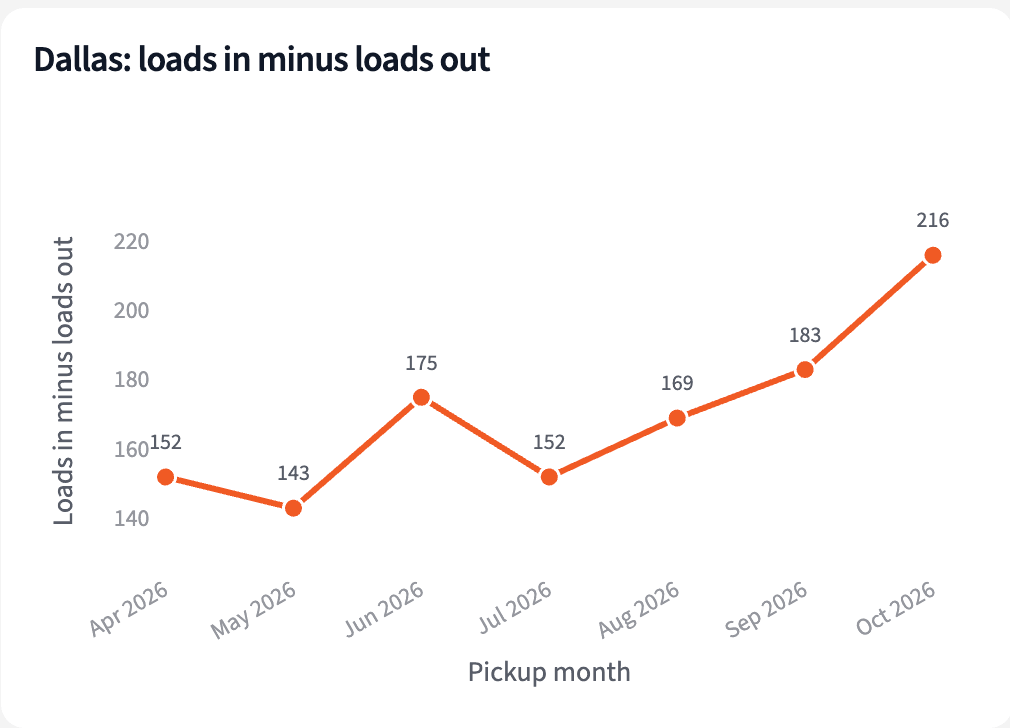
"Which cities take in far more of our loads than they send out, and how has Dallas moved since April?"
Dallas takes in 216 more loads than it sends out, its widest gap since April; from April to September it ran 143 to 183. Atlanta sent 250 of the 306 loads into Dallas. That makes outbound Dallas worth exploring for backhaul freight.
| City | In | Out | Imbalance |
|---|---|---|---|
| Dallas | 306 | 90 | 216 |
| Denver | 229 | 41 | 188 |
| Charlotte | 177 | 38 | 139 |
| Phoenix | 151 | 14 | 137 |
| Columbus | 89 | 19 | 70 |
Loads in and out by city, October 2026.
Match strong lanes to shipper region and industry
Find the lanes that earn the most, then the shippers who send them:
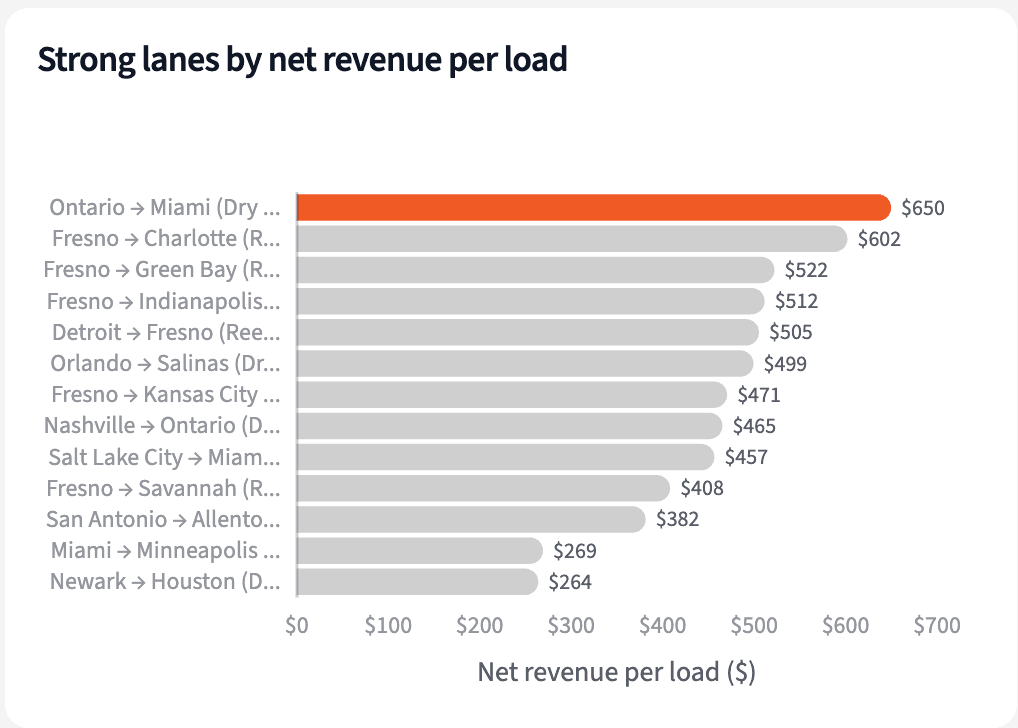
"Which lanes earn the most per load, and which shipper industries and regions do they come from?"
13 lanes clear the top-quarter bar of $261 a load, on 242 October loads. 58.7% of those loads come from Food & Beverages shippers and 56.2% from shippers in the West: the profile to look for in new accounts.
| Lane | October loads | Net revenue per load |
|---|---|---|
| Ontario to Miami (Dry Van) | 11 | $650 |
| Fresno to Charlotte (Reefer) | 17 | $602 |
| Fresno to Green Bay (Reefer) | 22 | $522 |
| Fresno to Indianapolis (Reefer) | 29 | $512 |
| Detroit to Fresno (Reefer) | 14 | $505 |
Strong lanes, October 2026: top quarter by net revenue per load, 10 or more loads.
Build the lane focus list for sales operations
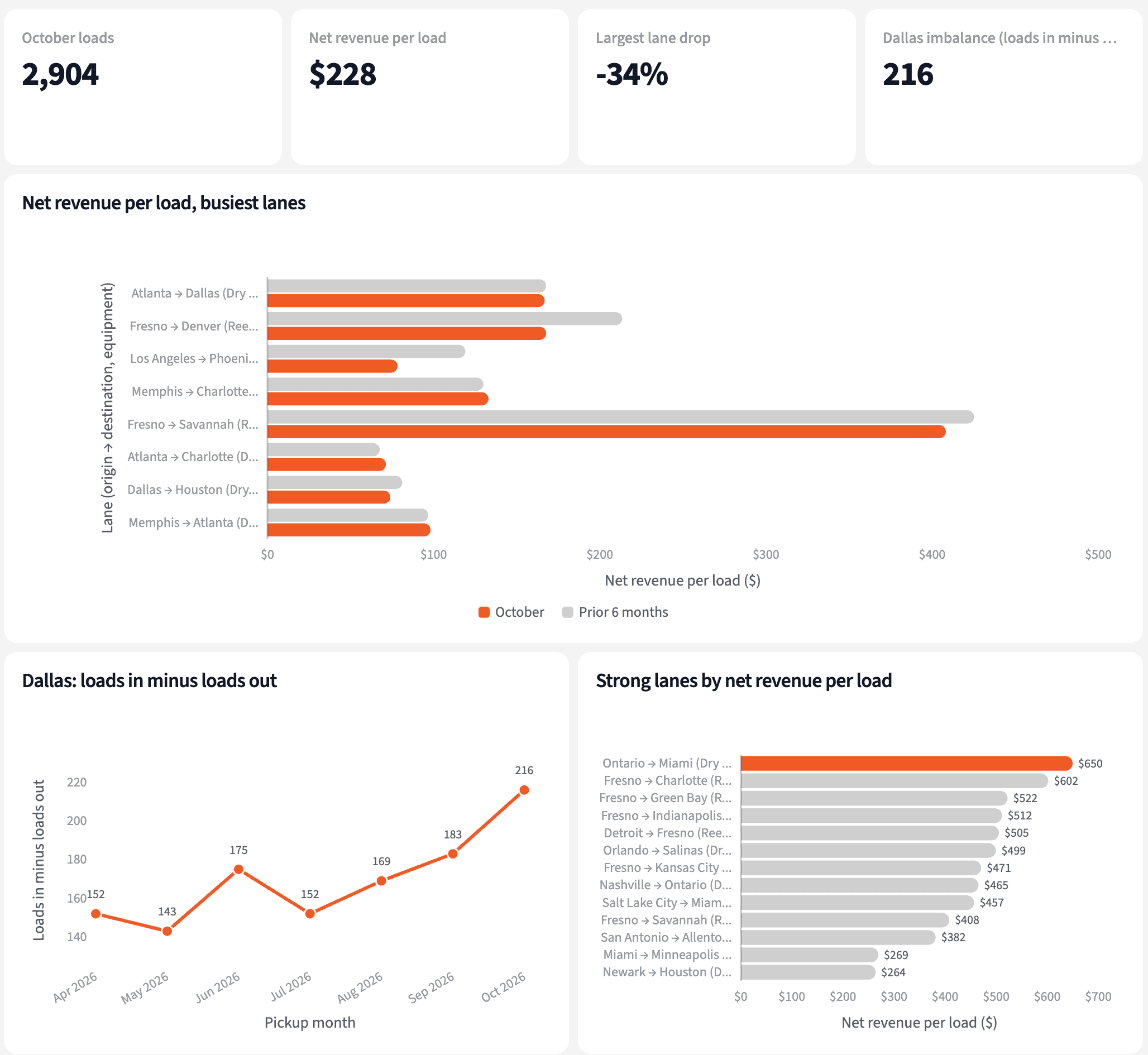
Four numbers for the planning meeting, and where to point the reps.
The narrative Querri writes:
October's busiest lane is steady, two western reefer lanes earn far less a load than usual, and Dallas takes in far more loads than it sends.
What you can create or export:
- The list, to Excel, CSV or Google Sheets
- A live dashboard that refreshes with each HubSpot sync and Tai upload
- A presentation for the meeting, to PDF or PowerPoint
| Lane or market | October | Focus |
|---|---|---|
| Outbound Dallas | 216 more in than out | Sell freight out of Dallas |
| Los Angeles to Phoenix (Reefer) | $78 a load, down 34% | Review rates first |
| Fresno to Denver (Reefer) | $168 a load, down 21% | Review rates first |
| Fresno to Charlotte, Green Bay, Indianapolis (Reefer) | $512 to $602 a load | Find similar shippers |
The lane focus list, November 2026.
Point the sales team at lanes that pay, and markets that need freight.
Try it on your own dataTips for a lane plan built on the loads
Rank by earnings, not only volume
The busiest lane can earn less a load than a dozen smaller ones. Put net revenue per load next to every count before deciding where to sell.
Sell into the imbalance
A market that takes in far more than it sends has trucks looking for freight. Shippers there can get capacity, and the brokerage cuts empty miles.
Teach Querri your rules once. Every answer after that follows them.
What a lane is, what counts as strong, how the imbalance is measured: say each rule once and Querri applies it to every question on that data.
Show me how
Say it in chat
Settle a rule in conversation and the Librarian records it as a fact under Facts & Rules, attached to the table it governs. Every later question on that data applies it, whoever asks, and every view built afterwards carries it.
"A lane is origin city to destination city plus equipment type. Save that as a rule for the Tai loads table."
Or bring the document that already says it
Upload your sales plan or territory document like any other file. Querri files a From a document card in the Inbox with the statements it found, each with its page and exact words; tick the ones to keep and they become facts. The rules this playbook depends on:
- Lane: origin city to destination city, with equipment
- Net revenue: Tai Customer Total less Carrier Total
- Usual: the prior six months, April to September
- Strong lane: top quarter by net revenue per load, 10 or more loads
- Imbalance: loads in less loads out, by city
- Matching: Tai to HubSpot through the Tai customer code
"Read our sales plan and propose the rules it states about target lanes, regions and industries. I'll review them in the Inbox."
Where the rules reach
A rule is attached to the data, not to one person's chat, so it follows the data everywhere:
- • Every question asked in chat, by anyone in sales operations
- • Every view the Librarian builds on that data
- • Every step of a project, including the code it writes
- • Dashboards and scheduled runs, each time they refresh
- • Claude and ChatGPT, when they ask Querri
You stay in control
Every rule is listed under Facts & Rules next to the data it governs, where you can edit or remove it. Rules from a document wait for your tick in the Inbox, and a Worth remembering card is how Querri offers one it noticed itself. Workspaces and roles decide who can change what. Company-wide rules go in Settings → Customize; the Library is where the rest lives.
The payoff at sales planning
Planning starts with the lanes that pay, the lanes to review and the market that needs freight. Changing the bar for a strong lane is a sentence.
Frequently asked questions
What is a lane?
What is net revenue per load?
What is the imbalance?
Why only lanes with 10 or more loads?
How are Tai shippers matched to HubSpot?
Do I need a TMS connector?
Does Querri change anything in HubSpot?
How often should this run?
Other popular resources
Playbook
Margin by rep and shipper
Which reps and shippers are pulling margin per load down?
Playbook
Rep commissions
What commission does each rep earn on this month's loads?
Demo
Request a walkthrough
See Querri in action with your own data.
Pricing
Compare plans
Find the right plan for individuals, teams, or enterprise.