Which reps and shippers are pulling margin per load down?
Join your Tai load export to HubSpot. See net revenue per load by team, rep and shipper against the prior six months, and which shippers each rep has been in touch with.
Open QuerriWhat you'll need
Querri (Free trial) to join the exports and run the checks
A Tai load export, HubSpot and your commission sheet: Step 1 says what each adds
Your margin rules: so every rep is measured the same way
Free resources
Start your free trial here →Sample data sets
Synthetic data for a made-up freight brokerage. Not real shipper data.
Need help?
If you have any questions, you can request a demo or email our team.
Before we begin
A company margin that moves by ten dollars a load looks like noise. Underneath it, one team can be down twenty dollars a load while the other is up, and one rep's book can be down forty. Loads and rates live in the TMS, the accounts and the calls live in the CRM, and the team each rep sits on lives in a spreadsheet, so the monthly sales review usually gets the total and not the reasons.
This playbook breaks October's net revenue per load down by team, rep and shipper, and checks which shippers each rep actually reached.
How it works:
- • Upload the Tai export and connect HubSpot
- • Net revenue per load by team and rep
- • Find the shippers behind the drop
- • Check who each rep has contacted
- • Build the monthly sales review
Follow the steps
Upload the Tai export and connect HubSpot
Three sources, one project:
- •
Tai load export (or your TMS load report): every load with its shipper, rep, customer total and carrier total.
- •
HubSpot: each shipper's record, owner and Tai customer code, and every call, email and meeting.
- •
Commission plan (Excel): the team each rep belongs to.
HubSpot connects directly and syncs on a schedule. The Tai export comes in as a file; upload next month's over the old one and every view rebuilds.
Tip: Pull at least seven months of loads, so October has six months to be compared with.
-
 Tai load export
-
 HubSpot companies and activities
- Commission sheet
 One project
Show net revenue per load by team and rep
Start with the company, then split it until the change has a name:
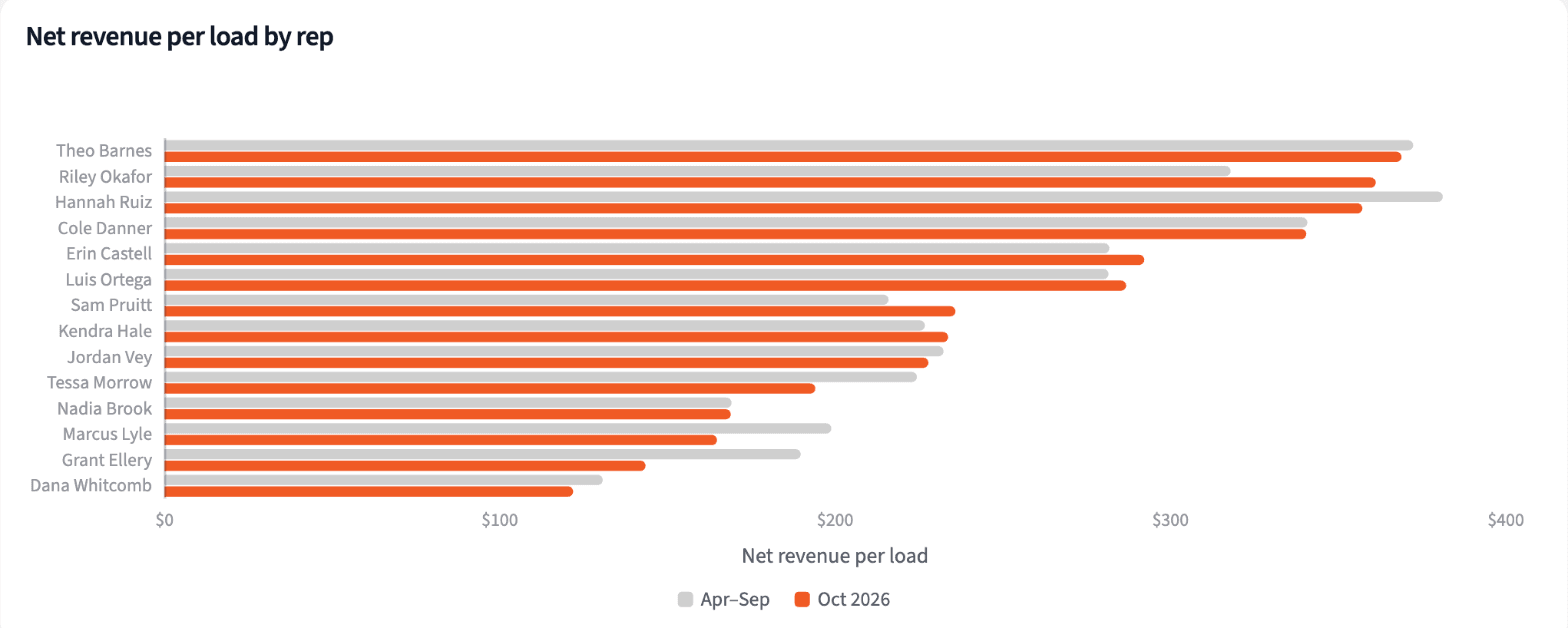
"Show October's net revenue per load for the company, each team and each rep, against April to September. Who dropped the most?"
The company slipped $10.32 a load. National accounts carried all of it, down $23.64, while Regional rose $2.16. Grant Ellery dropped the most of any rep, $46.26 a load on 193 loads.
| Team or rep | April to September | October | Change |
|---|---|---|---|
| National accounts | $183.46 | $159.82 | -$23.64 |
| Regional | $295.98 | $298.14 | +$2.16 |
| Grant Ellery | $189.76 | $143.50 | -$46.26 |
| Company | $238.59 | $228.27 | -$10.32 |
Net revenue per load, October 2026 against April to September.
Find the shippers behind the drop
Hold each of the rep's shippers against its own usual net revenue per load:
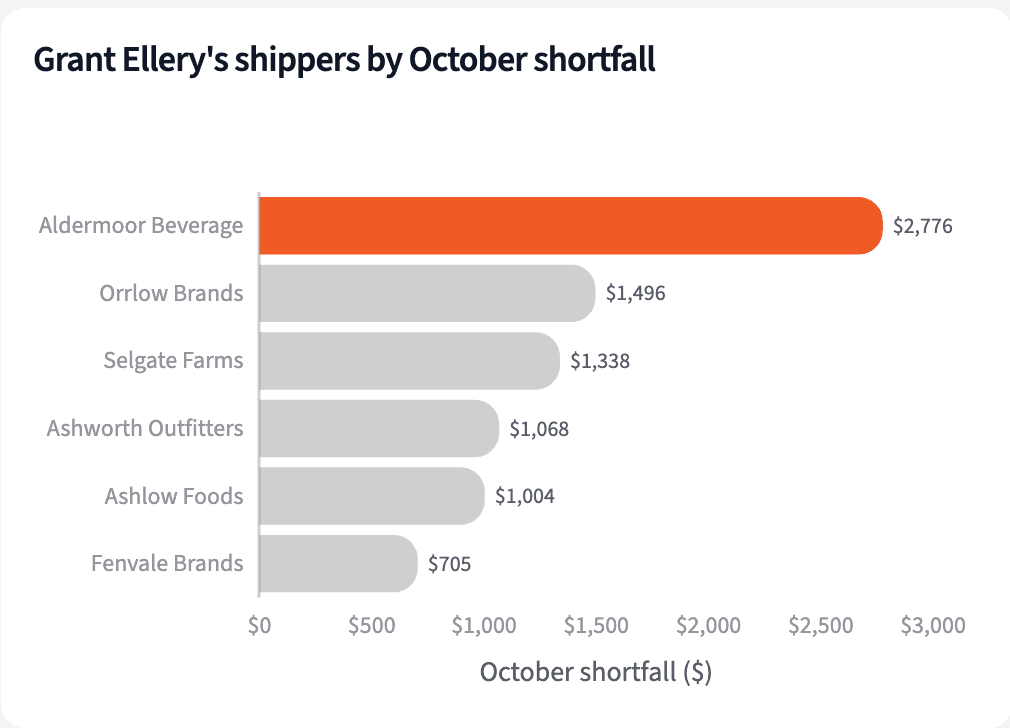
"For the rep with the biggest drop, which shippers cost the most in October against their usual net revenue per load?"
All eight of Grant's shippers earned less a load in October. Aldermoor Beverage costs the most, $2,776 on 78 loads, 31% of his shortfall; its margin fell from 9.71% to 5.71%.
| Shipper | October loads | Per load, usual to October | Shortfall |
|---|---|---|---|
| Aldermoor Beverage | 78 | $89 to $54 | $2,776 |
| Orrlow Brands | 21 | $263 to $192 | $1,496 |
| Selgate Farms | 20 | $190 to $123 | $1,338 |
| Ashworth Outfitters | 11 | $345 to $248 | $1,068 |
| Grant Ellery, all loads | 193 | $190 to $144 | $8,928 |
Grant Ellery's shippers, October 2026 against April to September.
Check which shippers each rep has contacted
Bring HubSpot in, matched on the Tai customer code:
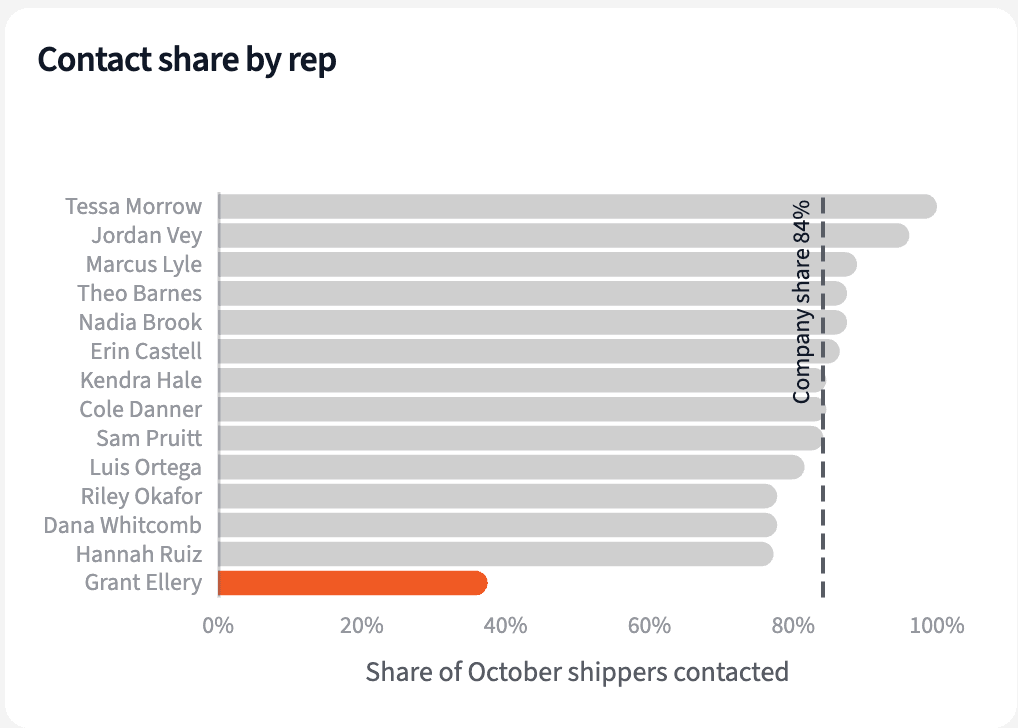
"For each rep, what share of the shippers they loaded in October had a call, email or meeting from them in HubSpot in the last 30 days?"
Grant Ellery reached 37.5% of the shippers he loaded in October; every other rep reached 77% or more. Across the other 13 reps, contact and margin don't move together, so it's a question for the review, not the answer.
| Rep | Contact share | Change per load |
|---|---|---|
| Grant Ellery | 37.5% | -$46.26 |
| Hannah Ruiz | 77% | -$23.98 |
| Marcus Lyle | 89% | -$34.09 |
| Tessa Morrow | 100% | -$30.28 |
| Company | 83.8% | -$10.32 |
Share of October shippers with a call, email or meeting from their rep in the last 30 days.
Build the monthly sales review for sales operations
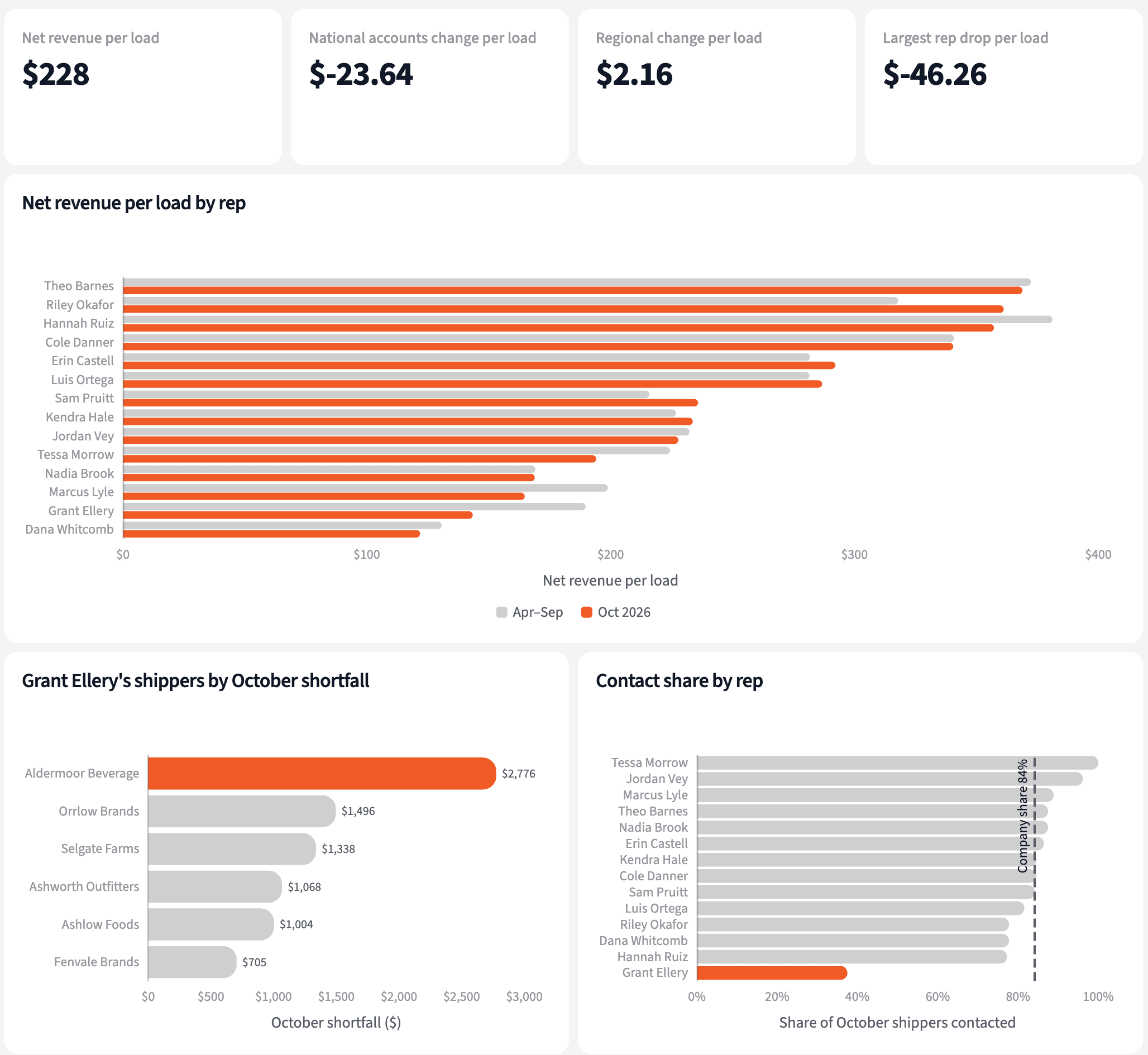
Four numbers for the review, and the reps and shippers to talk about.
The narrative Querri writes:
Margin per load slipped in October because National accounts slipped, and one rep's book holds the largest single drop.
What you can create or export:
- The list, to Excel, CSV or Google Sheets
- A live dashboard that refreshes with each HubSpot sync and Tai upload
- A presentation for the meeting, to PDF or PowerPoint
| Rep | Per load (usual) | Contact share |
|---|---|---|
| Grant Ellery | $144 ($190) | 37.5% |
| Marcus Lyle | $165 ($199) | 89% |
| Tessa Morrow | $194 ($224) | 100% |
| Hannah Ruiz | $357 ($381) | 77% |
Reps with the largest drops, October 2026.
Bring the reps and shippers behind the number to the sales review.
Try it on your own dataTips for a sales review that gets past the total
Split by team before you split by rep
A company number can hide two teams moving in opposite directions. Find the team first and the rep conversation gets shorter.
Compare each shipper with itself
A shipper that always runs thin isn't news. One that earned $89 a load and now earns $54 is the one to talk about.
Teach Querri your rules once. Every answer after that follows them.
What net revenue means, which team a rep is on, what counts as contact: say each rule once and Querri applies it to every question on that data.
Show me how
Say it in chat
Settle a rule in conversation and the Librarian records it as a fact under Facts & Rules, attached to the table it governs. Every later question on that data applies it, whoever asks, and every view built afterwards carries it.
"Net revenue on a load is Customer Total less Carrier Total in the Tai export. Save that as a rule for the Tai loads table."
Or bring the document that already says it
Upload your commission plan or sales compensation policy like any other file. Querri files a From a document card in the Inbox with the statements it found, each with its page and exact words; tick the ones to keep and they become facts. The rules this playbook depends on:
- Net revenue: Tai Customer Total less Carrier Total
- Usual: the prior six months, April to September
- Team: from the commission sheet
- Jordy Vey in Tai is Jordan Vey
- Contact: a call, email or meeting from the rep in the last 30 days
- Matching: Tai to HubSpot through the Tai customer code
"Read our sales compensation policy and propose the rules it states about teams, territories and how margin is measured. I'll review them in the Inbox."
Where the rules reach
A rule is attached to the data, not to one person's chat, so it follows the data everywhere:
- • Every question asked in chat, by anyone in sales operations
- • Every view the Librarian builds on that data
- • Every step of a project, including the code it writes
- • Dashboards and scheduled runs, each time they refresh
- • Claude and ChatGPT, when they ask Querri
You stay in control
Every rule is listed under Facts & Rules next to the data it governs, where you can edit or remove it. Rules from a document wait for your tick in the Inbox, and a Worth remembering card is how Querri offers one it noticed itself. Workspaces and roles decide who can change what. Company-wide rules go in Settings → Customize; the Library is where the rest lives.
The payoff at the sales review
The review starts with the team that moved, the rep behind it and the shippers to discuss. Changing the comparison window is a sentence.