What share of store revenue comes from each email flow?
Join Klaviyo's flow and campaign reports to Shopify orders. See Klaviyo-attributed revenue as a share of store sales, which flow moved, and how repeat purchase is trending.
Open QuerriWhat you'll need
Querri (Free trial) to join Klaviyo and Shopify week by week
Klaviyo and Shopify: Step 1 says what each adds
Your retention rules: so repeat purchase is counted the same way
Free resources
Start your free trial here →Sample data sets
Synthetic data for Curio Supply, a made-up home goods brand. Not real customer, retailer or marketplace data.
Need help?
If you have any questions, you can request a demo or email our team.
Before we begin
Email's share of store revenue is the number that gets reported, and month to month it barely moves. A steady total can hide a flow that is fading while campaigns send more. Klaviyo knows what each flow and campaign is credited with; Shopify knows store sales and who came back, so seeing both means lining up two systems' weeks by hand.
This playbook works out Klaviyo-attributed revenue as a share of store sales, ranks flows across successive eight-week periods, and tracks repeat purchase by first-order month as its own check.
How it works:
- • Connect Klaviyo and Shopify
- • Work out email's share of store revenue
- • Compare flow revenue and recipients
- • Track repeat purchase by first-order month
- • Build the monthly retention view
Follow the steps
Connect Klaviyo and Shopify
Two sources, one project:
- •
Klaviyo: weekly flow performance and campaign performance: recipients and attributed revenue.
- •
Shopify: the orders export: store sales each week, and each customer's first and later orders.
Both connect directly and sync on a schedule. Querri lines up Klaviyo's send weeks with Shopify's order dates.
Tip: Pull a year of orders, so first-order months have had time to show their 60-day repeat rate.
-
 Klaviyo flows and campaigns
-
 Shopify orders
 One project
Work out email's share of store revenue
Start with the number that gets reported, then split it:
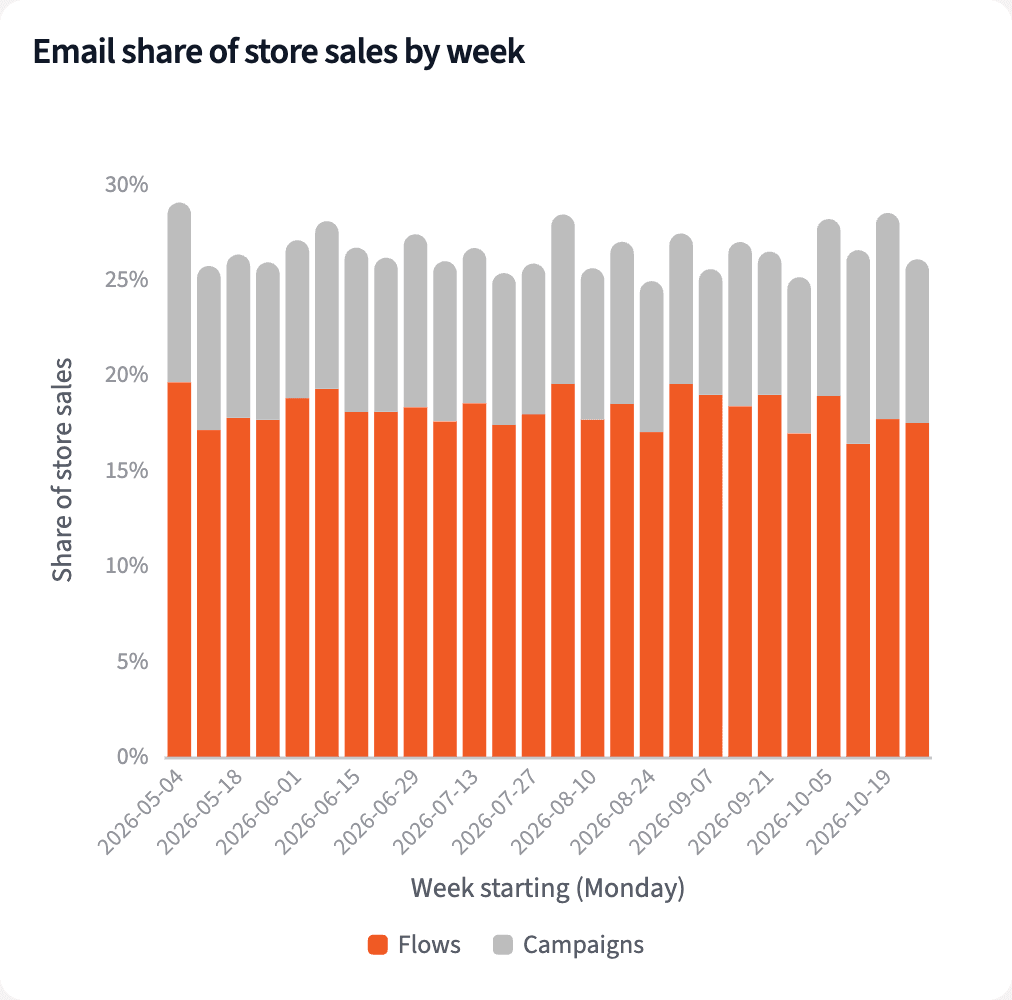
"What share of store sales does Klaviyo attribute to email, week by week and by month?"
Klaviyo-attributed revenue represents 27.3% of store sales in October, against 26.6% for April to September. Underneath, flows slipped and campaigns rose.
| Source | October | April to September |
|---|---|---|
| Flows | 17.6% | 18.3% |
| Campaigns | 9.7% | 8.3% |
| All email | 27.3% | 26.6% |
Klaviyo-attributed revenue as a share of store sales, October 2026 reporting weeks against April to September 2026.
Compare flow revenue and recipients
Rank the flows across two eight-week periods:
"Rank our flows by share of store sales and revenue per recipient, last 8 weeks against the 8 before. Which one moved?"
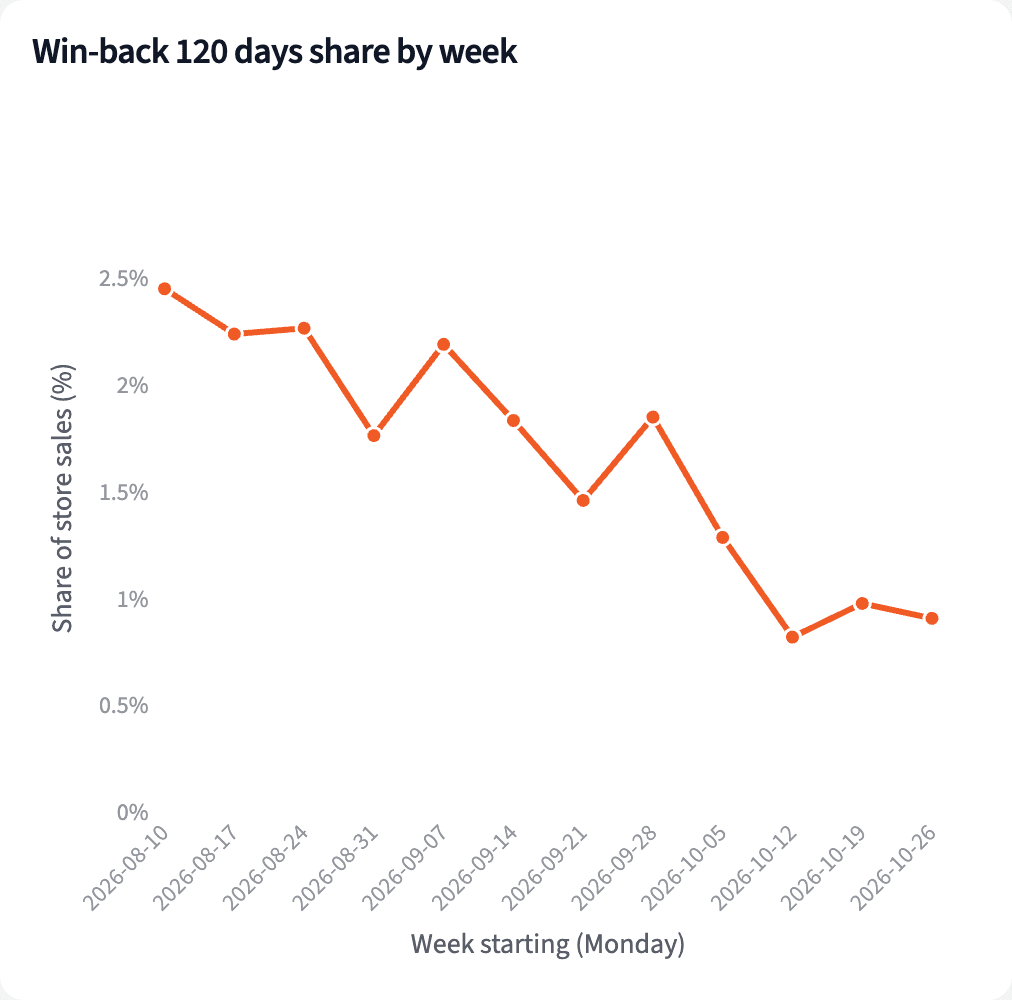
Win-back 120 days fell from 2.2% to 1.4% of store sales. Its recipients fell from 103,053 to 68,561, while revenue per recipient held.
| Flow | 8 weeks before | Last 8 weeks |
|---|---|---|
| Welcome | 5.5% | 5.7% |
| Abandoned cart | 5.3% | 5.4% |
| Win-back 120 days | 2.2% | 1.4% |
| Browse abandonment | 1.8% | 1.9% |
Share of store sales by flow, weeks of 2026-09-07 to 2026-10-26 against the 8 weeks before.
Track repeat purchase by first-order month
Separately, check whether new customers are coming back:
"Of each month's new customers, how many ordered again within 60 days?"
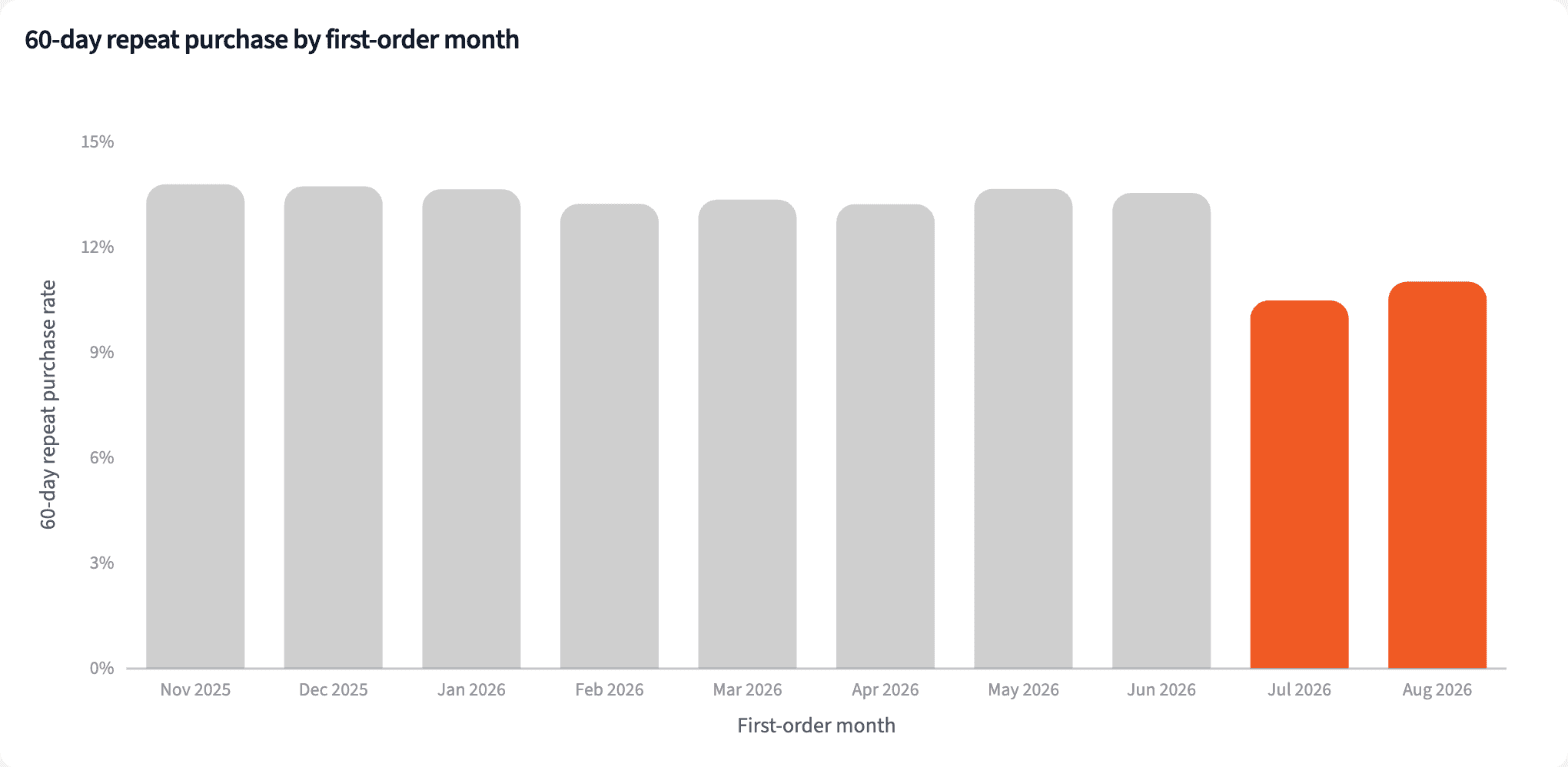
Customers whose first order came in July or August 2026 repeated within 60 days at 10.7%, against 13.5% for November 2025 to June 2026. This is a separate finding from win-back.
| First-order month | New customers | 60-day repeat |
|---|---|---|
| May | 10,213 | 13.6% |
| June | 9,776 | 13.5% |
| July | 9,675 | 10.5% |
| August | 10,487 | 11.0% |
Repeat purchase within 60 days, by first-order month, 2026.
Build the monthly retention view
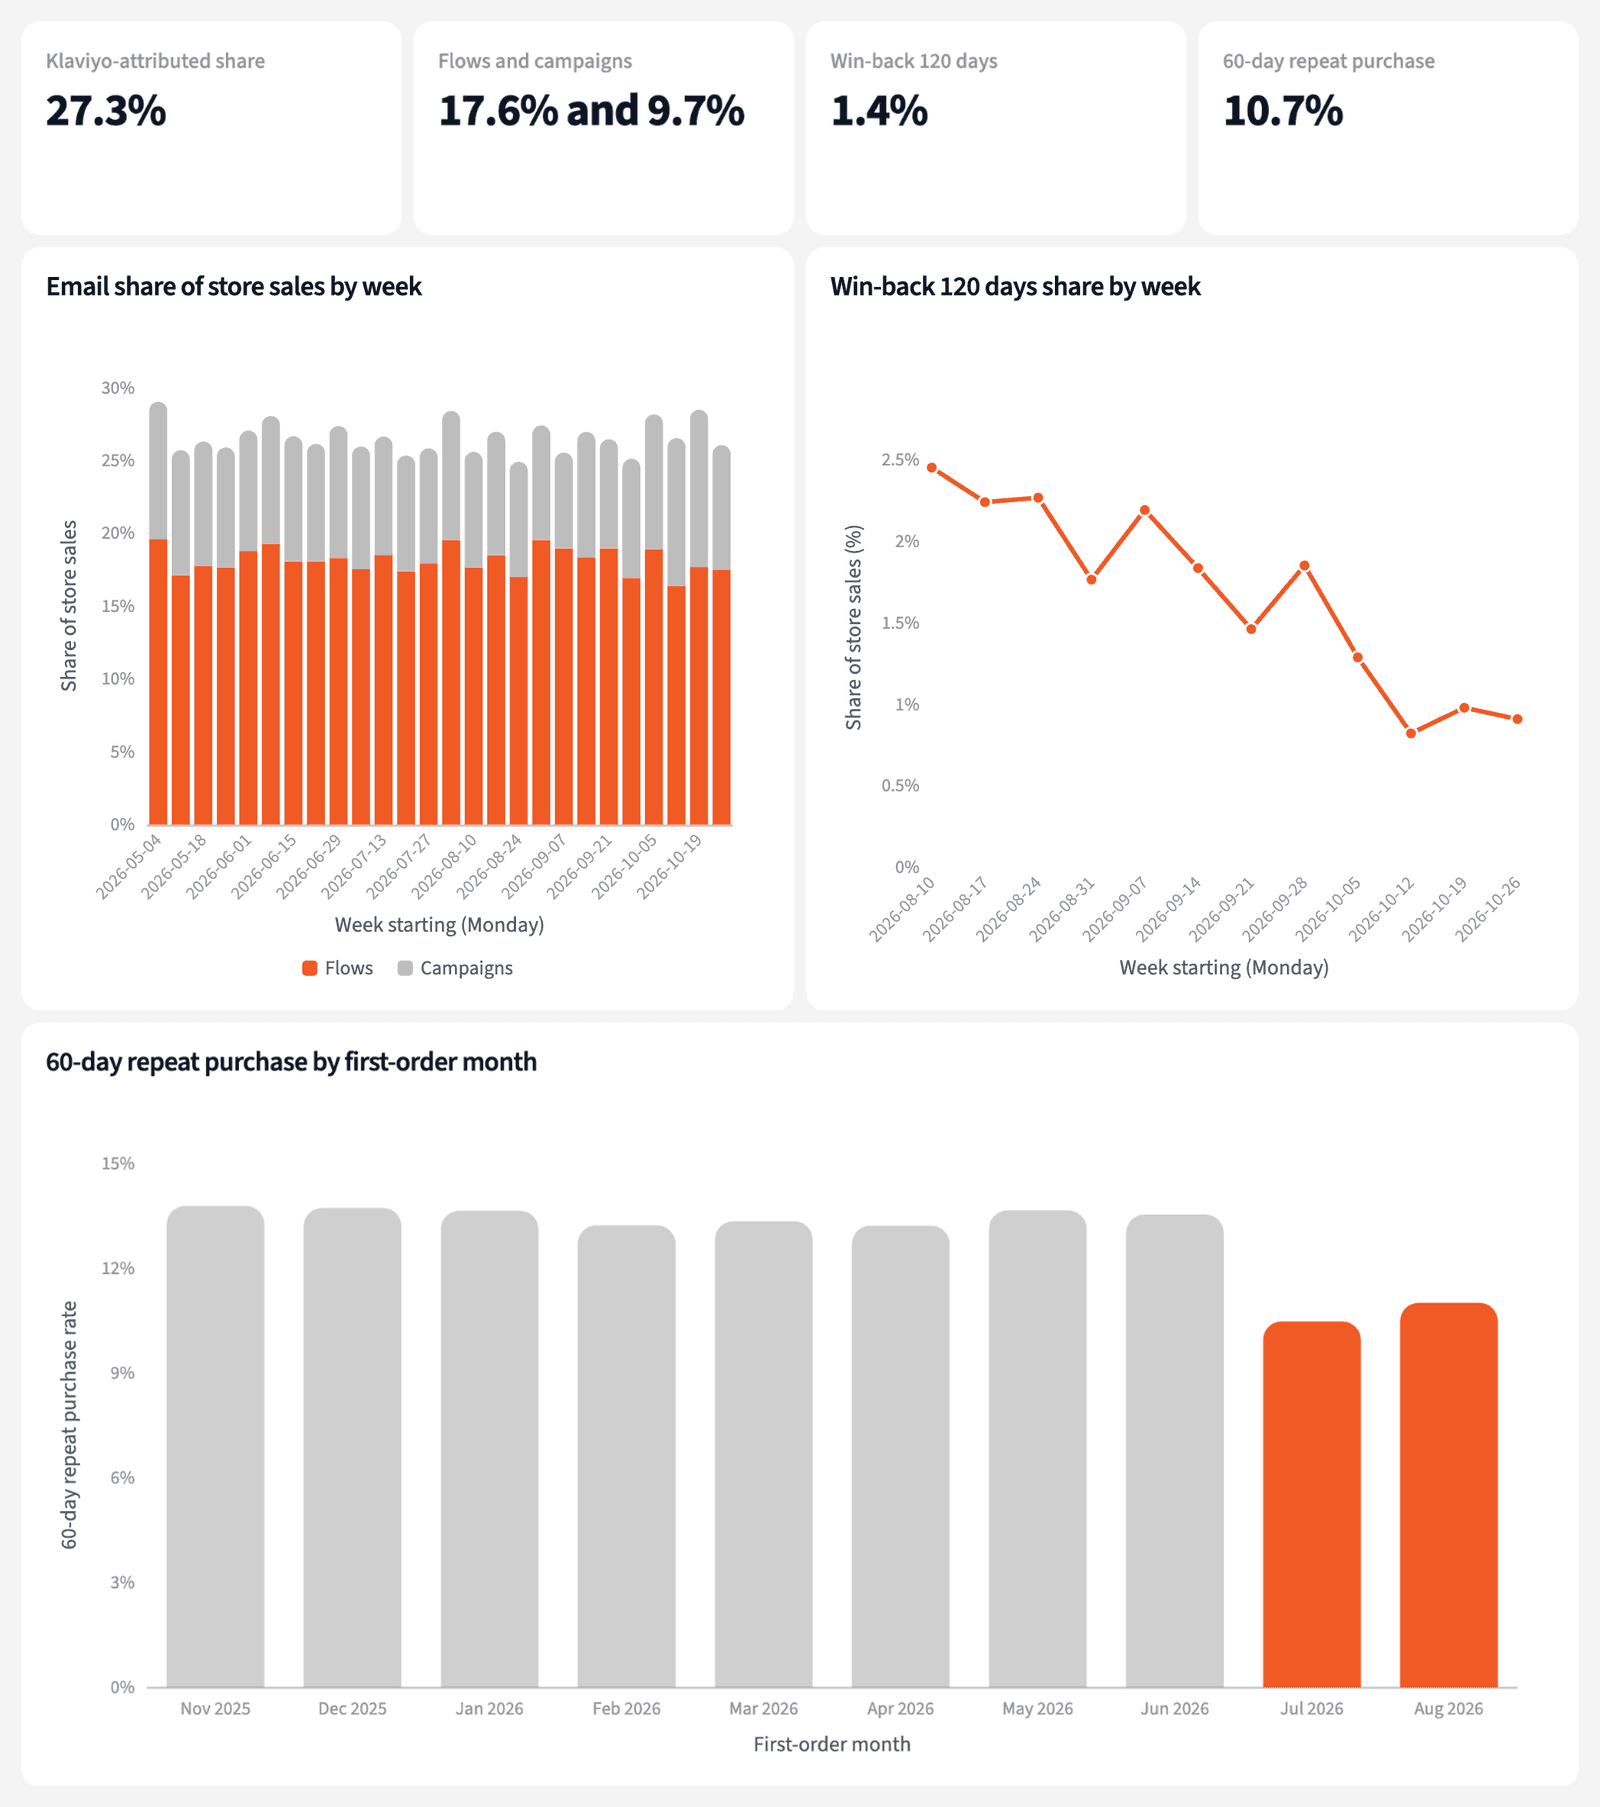
Four numbers for the retention review, each with its period.
The narrative Querri writes:
Klaviyo-attributed revenue represents 27.3% of store sales, steady, while the win-back flow's share fell by about a third between successive eight-week periods.
What you can create or export:
- The table, to Excel, CSV or Google Sheets
- A live dashboard that refreshes with each sync
- A presentation for the meeting, to PDF or PowerPoint
| Item | Change | Next step |
|---|---|---|
| Win-back 120 days, share of store sales (8-week periods) | 2.2% to 1.4% | Check the flow's audience |
| Campaign sends (8-week periods) | 16 to 23 | Review send volume |
| 60-day repeat, July and August first orders | 13.5% to 10.7% | Track next months |
What moved, with each measure's period.
Know which flow to open first.
Try it on your own dataTips for a retention review people trust
Split the total before you trust it
Flows and campaigns can move in opposite directions under a steady total. Look at each before calling the month flat.
Compare cohorts at the same age
A first-order month needs 60 full days before its 60-day rate means anything. Compare months that have all had the same time.
Teach Querri your rules once. Every answer after that follows them.
What counts as store sales, how a repeat is counted, which orders to leave out: say each rule once and Querri applies it to every question on that data.
Show me how
Say it in chat
Settle a rule in conversation and the Librarian records it as a fact under Facts & Rules, attached to the table it governs. Every later question on that data applies it, whoever asks, and every view built afterwards carries it.
"Repeat purchase within 60 days means another order within 60 calendar days of the customer's first. Save that as a rule for the Shopify orders table."
Or bring the document that already says it
Upload your retention KPI definitions like any other file. Querri files a From a document card in the Inbox with the statements it found, each with its page and exact words; tick the ones to keep and they become facts. The rules this playbook depends on:
- Store sales: Shopify order totals, by week from Monday
- Email share: Klaviyo-attributed revenue over store sales
- Flows and campaigns reported apart, never netted
- First order: the customer's earliest order in the export
- Repeat: another order within 60 days, by calendar date
- Reship orders are not purchases
"Read our retention KPI definitions and propose the rules they state about repeat purchase and email share. I'll review them in the Inbox."
Where the rules reach
A rule is attached to the data, not to one person's chat, so it follows the data everywhere:
- • Every question asked in chat, by anyone on the ecommerce team
- • Every view the Librarian builds on that data
- • Every step of a project, including the code it writes
- • Dashboards and scheduled runs, each time they refresh
- • Claude and ChatGPT, when they ask Querri
You stay in control
Every rule is listed under Facts & Rules next to the data it governs, where you can edit or remove it. Rules from a document wait for your tick in the Inbox, and a Worth remembering card is how Querri offers one it noticed itself. Workspaces and roles decide who can change what. Company-wide rules go in Settings → Customize; the Library is where the rest lives.
The payoff in the review
The review opens on the flow that moved and the cohorts that slowed, each with its period. Changing the repeat window is a sentence.
Frequently asked questions
What does Klaviyo-attributed mean?
Why compare 8-week periods for flows?
Why did win-back fall?
What happened with campaigns?
Is lower repeat purchase caused by win-back?
How is repeat purchase counted?
Does Querri change anything in Klaviyo?
How often should this run?
Other popular resources
Playbook
Contribution margin by channel
What does each channel earn after fees, ads and product cost?
Playbook
In-stock rate and aged SKUs
Which SKUs are out of stock or aging, by channel?
Demo
Request a walkthrough
See Querri in action with your own data.
Pricing
Compare plans
Find the right plan for individuals, teams, or enterprise.