Real profit by channel and campaign,not platform-reported revenue.
Every platform claims the sale. Querri joins Shopify, Amazon, every ad platform, Klaviyo and product cost into one profit number by channel and campaign, defined once, so ecommerce, finance and the founder all trust it. Ask in plain words and click any number to see where it came from.
One minute: profit by campaign on Shopify's numbers, the Channel profit and growth blueprint, and what else your data answers.
One view of every channel
Four sources. One profit number, by channel.
Orders live in Shopify and Amazon, spend in each ad platform, email in Klaviyo, and product cost in the books. Querri joins them by order and SKU, and checks for gaps and duplicates before it queries, so ecommerce and finance start from the same margin.
Orders, refunds and feesShopifyAmazon
Ad spendMeta AdsGoogle AdsAmazon Ads
Email and SMSKlaviyo
Product costNetSuiteQuickBooksExcel
Defined once
What each channel kept, April to September
Channel
Net sales
After fees
After ads
Online store
$48.1K
55%
37%
Wholesale
$27.2K
18%
18%
Amazon
$12.5K
36%
9.5%
Sample data: Marigold Supply Co., a fictional multichannel brand. Amazon has the best gross margin, 76%, but keeps 36% after referral and FBA fees and 9.5% after Amazon Ads.
Where ecommerce and growth teams start
Three questions no single platform can answer
These are good first jobs, not the whole list. Once your store, Amazon, the ad platforms and Klaviyo are in, the same definitions answer whatever you ask next.
What each channel and campaign really earned.
“What did each channel and campaign earn after product cost, fees and ad spend, and which revenue number do we report?”
How it's done today
Meta, Google and Amazon Ads each claim the sale, Shopify reports a subset, and someone pastes it all into a spreadsheet with a cost tab.
In Querri
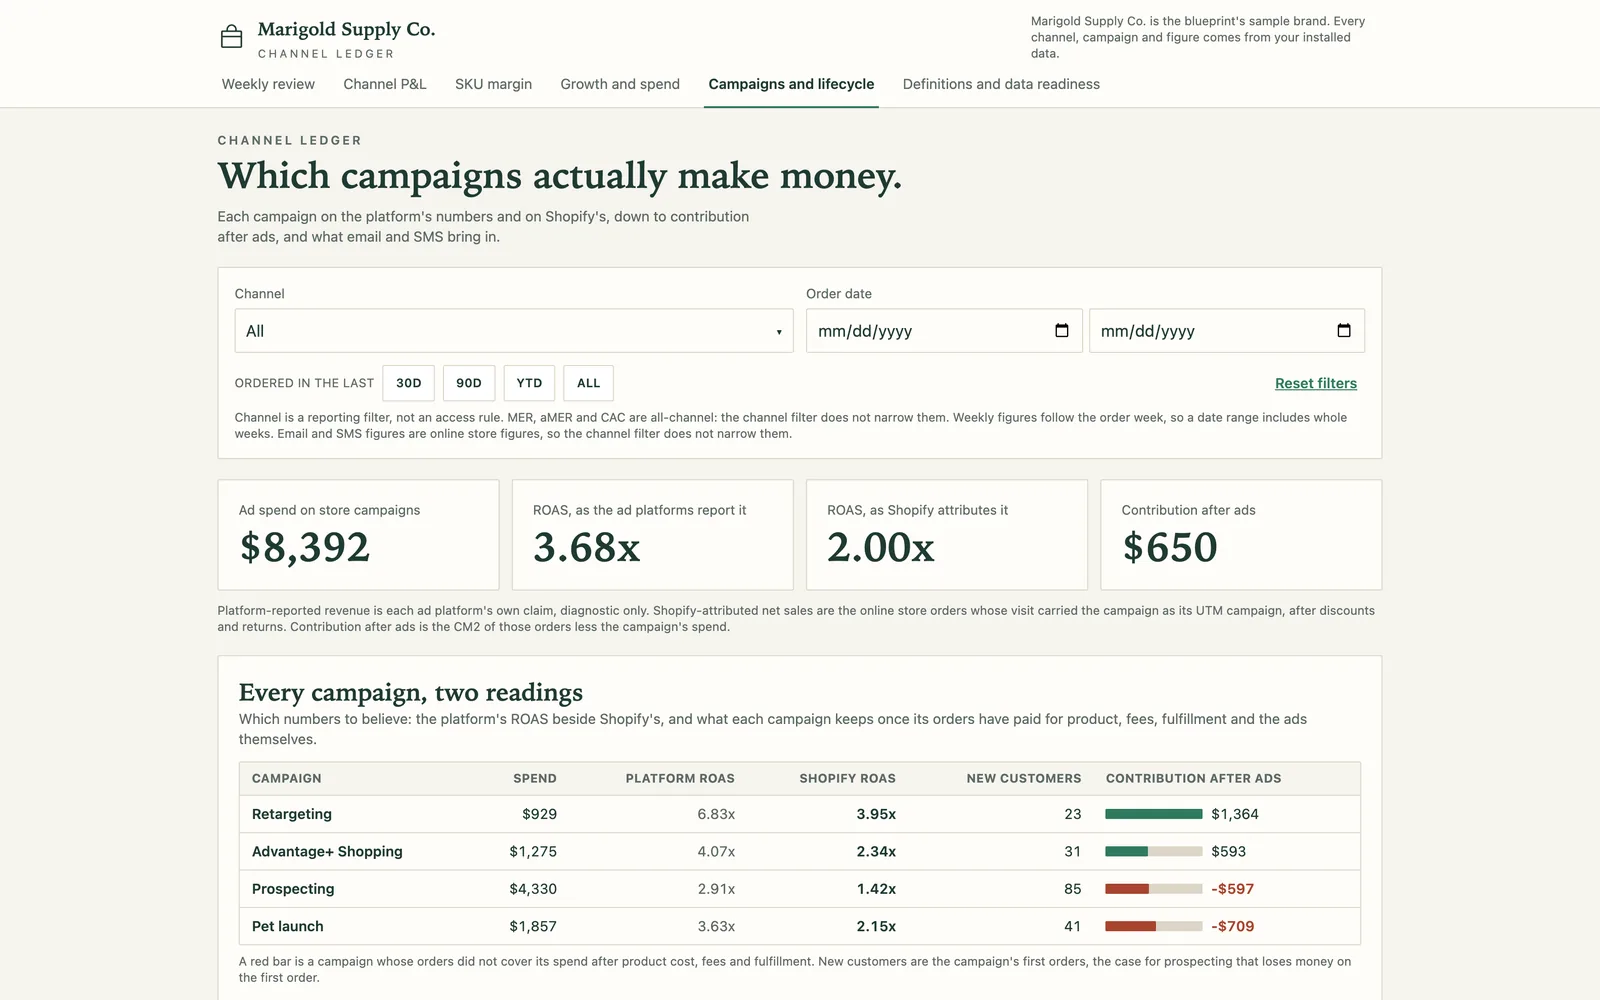
Querri joins Shopify and Amazon orders with spend from Meta, Google and Amazon Ads and product cost from the books. Each campaign shows platform-reported revenue beside the orders Shopify ties to it, and contribution after ads, on the margin finance uses.
Sample data. The ad platforms reported $30.9K of revenue; Shopify ties $16.8K of net sales to the same campaigns. Two of four campaigns lost money after product cost, fees and spend.
Which SKUs really earn, after fees.
“Which SKUs earn after fees and fulfillment, and which sell well but keep little?”
How it's done today
Shopify and Seller Central sales by SKU in two tabs, a cost sheet in a third, and fees spread by hand when someone has the time.
In Querri
Querri joins Shopify and Amazon order lines with product cost from the books, channel fees and fulfillment, so every SKU shows gross margin beside what it keeps, on any channel. SKUs sold without a cost are listed, not counted at zero.
SKU margin after fees and fulfillment, April to September
SKU
Net sales
Gross margin
CM2 %
MG-SUP-MAG
$16.3K
71%
50%
MG-SKN-VITC
$7.1K
78%
64%
MG-PET-BED
$5.9K
55%
24%
MG-PET-CHEW
$4.1K
51%
18%
Sample data. Pet chews hold a 51% gross margin and keep 18% once fees and fulfillment land. Magnesium, the best seller, keeps 50%. Two SKUs sold without a cost are listed, not counted at zero.
Where repeat customers come from.
“Where do repeat customers come from, and what does email add on top of paid?”
How it's done today
Klaviyo's attributed revenue in one report, Shopify's returning customers in another, and ad spend in a third, each on its own window.
In Querri
Querri joins Klaviyo flows and campaigns with Shopify customers and orders and the spend that bought each first order, so you see which flows bring buyers back and what a customer costs before email takes over.
Sample data. Email and SMS carried 32% of online store sales. Paid search and social brought in each new customer for $23.65.
Campaign profit is one question. Ask next about MER against breakeven, new against returning revenue, or which SKUs lose money on Amazon. See how asking works →
More than an attribution report
One profit number, for every report and every AI agent
The three jobs run on the same foundation as everything else in Querri. Define a number once, and every dashboard, spreadsheet export, board pack and AI answer uses it.
The Library
Teach it once. It stays right.
Say what counts as net sales, product cost and contribution after ads, and every answer after that uses it. Ecommerce, finance and the founder finally show one margin.
Click a campaign's profit to see the orders, spend and costs behind it, and when each refreshed. Before it queries, Querri checks the data for gaps and duplicates, and when it can't answer, it says what's missing.
Ask in plain language, whatever your skill with data. Build a dashboard by asking, or from a screenshot of the one you use now. Send the weekly numbers to Excel or slides, or ask from your AI assistant, under each person's own access.
Monitors judge each channel's margin and MER against its own history, and say which one moved, not just that the total did. Every night Querri works through your data and leaves what it found in your Inbox. Nothing changes without your OK.
Four steps from sign-up to your own channel profit desk. No warehouse, BI build or data hire first.
1
Sign up free
No credit card. Your own workspace is ready in about a minute.
2
Install Channel profit and growth
Open Blueprints, pick the card and install it. Sample data comes with it, so every page has numbers right away.
Channel profit and growth22 pieces
3
Keep the sample, or connect your data
Connect Shopify, Amazon, your ad platforms and Klaviyo, then add product cost. An agent sets up each connection with you.
4
Open your channel profit desk
Margin by channel, campaign profit, MER against breakeven and email's share, on one site.
Open your channel profit desk
Campaign profit, two readings side by side (Marigold Supply Co. sample data).
Everything that installs
6 Site pages
Channel profit ledger
Weekly review
Channel P&L
SKU margin
Growth and spend
Campaigns and lifecycle
Definitions and data readiness
3 Dashboards
Channel margin
Growth efficiency
Campaign profit
6 Views
Sales
Contribution
Channel P&L
Campaigns
Stores
Lifecycle
3 KPIs
Net sales
CM2 %
MER
3 Skill and monitors
Weekly business review
CM2 % by channel
MER watch
CM2 is net sales less product cost, channel fees and fulfillment, plus shipping charged. CM3 subtracts the ad spend bought for the channel. Monitors compare each channel with its own history.
How Querri compares with the other ways ecommerce teams get these numbers
Most ecommerce teams already have platform dashboards, an attribution tool, a spreadsheet, or all three. Here is where each fits, where it stops, and how Querri works alongside it.
Querri
Each platform's own reports
An attribution tool
A warehouse, BI and a data hire
Time to the first answer
Minutes on sample data from the blueprint, then on your own
Already there, one platform at a time
Days to weeks: pixel, tagging, onboarding
Months: pipelines, models, then dashboards
Store, Amazon, ads, email and cost together
One Library, from 125+ connectors and file uploads
Each stops at its own platform's edge
Store and ads; Amazon, wholesale and cost often sit outside
Once each source is piped in and modeled
A question nobody built a report for
Ask it in plain words
A new export, every time
Inside the tool's own reports
Joins the data team's queue
What revenue and margin mean
Defined once; every answer, dashboard and AI agent uses it
Each platform's own window and credit, so they disagree
The tool's model, which finance rarely signs off
In a semantic layer the data team maintains
Where a number came from
Click any number to see its source tables and refresh time
Inside each platform
Inside the tool's model
In the SQL, for whoever can read it
Watching for changes
Monitors on any KPI, each channel against its own history
Alerts inside each platform
Alerts on the tool's own metrics
Through a BI or alerting tool on top
Running and bidding the campaigns
Not Querri's job. Keep your ad platforms
Its core strength
Some tools push budgets back
Not its job
How it works with Querri
Reads from all three, plus product cost and the books
Keep them for buying media. Querri adds cost and the other channels
Keep it if you like its model. Querri adds Amazon, wholesale and the books
Querri connects to the warehouse and puts answers in front of ecommerce
The right call on its own when
Your profit crosses the store, Amazon, ads and the books
You sell on one channel and buy on one platform
You only need ad credit on store orders
A staffed data team already models commerce data and has time for you
Approaches, not products: what each typically looks like in late 2026.
Ecommerce profit by channel and campaign: common questions
How do ecommerce teams see real profit by channel and campaign, not platform-reported revenue?
Querri joins Shopify and Amazon orders with spend from Meta, Google and Amazon Ads and product cost from NetSuite, QuickBooks or a cost sheet. Each campaign shows what the platform reported beside the orders Shopify ties to it, and contribution after product cost, fees and spend. Margin is defined once, so ecommerce and finance report the same number. See every connector →
Which revenue number should an ecommerce brand report when Meta, Google, Klaviyo and Shopify disagree?
Report net sales from your orders, and keep each platform's number as a diagnostic. Querri puts them side by side by campaign: platform-reported revenue, the Shopify net sales tied to that campaign, and contribution after ads. You choose the definition once in the Library, and every dashboard and answer uses it. The Library →
Can Querri show contribution margin for Shopify, Amazon and wholesale side by side?
Yes. Querri lines up net sales, product cost, channel fees, fulfillment and ad spend for each channel, from gross sales down to CM3. Amazon referral and FBA fees come from your settlements and retailer deductions from the books, so a channel with a high gross margin shows what it really keeps. KPIs →
How can I see which SKUs make money after Amazon and Shopify fees?
Connect Shopify and Amazon and add product cost from NetSuite, QuickBooks or a cost sheet. Querri runs every SKU from net sales to gross margin and contribution after channel fees and fulfillment, on any channel, so a best seller that keeps little shows up next to one that earns. SKUs sold without a cost are listed, not counted at zero. Views →
Why use Querri instead of an attribution tool for ecommerce?
An attribution tool credits ad spend on store orders. Querri answers the wider question: what each channel and campaign earns after product cost, fees and spend, across Shopify, Amazon and wholesale, on the margin finance uses. Keep your attribution tool if you like its model; Querri can read its numbers next to everything else. How Querri gets to an answer →
Is Querri secure enough for our store, customer and ad data?
Yes. Querri is SOC 2 Type II, HIPAA and ISO 27001:2022 certified. Each organization has its own database and storage, encrypted with AES-256 at rest, and your data, prompts and results never train any model. Connectors are read-only, so Querri never changes an order, a listing or a campaign, and an agent sets up each connection without ever seeing your passwords. Visit the Trust Center →
Which systems does an ecommerce team connect first to get started with Querri?
To get started with Querri, connect Shopify and Amazon first, then Meta, Google and Amazon Ads, then Klaviyo, and add product cost from NetSuite, QuickBooks or a spreadsheet. An agent sets up each connection with you. The Channel profit and growth blueprint opens on sample data first, with margin by channel, campaign profit and MER, then runs on your own data. Sign up and open the blueprint →
How much does Querri cost for an ecommerce team?
Querri is free to start, and no credit card is required, so an ecommerce team can try it before any budget conversation. When you sign up, the Channel profit and growth blueprint opens on sample data with margin by channel and campaign profit, ready before you connect your store. Current plans and prices are on the Querri pricing page. See pricing →
Playbooks
Three questions ecommerce answers across platforms
Step by step, with sample data, for the person who builds the report.
Playbook coming
Contribution margin and MER by channel
What does each channel earn after product cost, shipping, fees and ad spend, with Shopify, Amazon and wholesale side by side?
Playbook coming
Platform-reported revenue against Shopify orders, by channel and campaign
When your ad platforms, Klaviyo and Google Analytics each report different revenue, which number do you report?
Playbook coming
SKU margin after fees, by channel
Which SKUs sell well but keep little once fees and fulfillment land?
From the blog
For the founder and the head of ecommerce
What to do once you have the answer.
Article coming
Where to put the next dollar of spend
Once margin reads the same way for Shopify, Amazon and wholesale, which channel earns it.
Article coming
Why Shopify, Klaviyo and Google Analytics report different revenue
Where the numbers part ways, and which one to report.
Article coming
What email adds on top of paid
Which flows bring customers back, and what a customer costs before email takes over.
Start with what each campaign really earned.
The channel profit blueprint opens when you sign up. Connect Shopify, Amazon, your ad platforms and Klaviyo, add product cost, and ask which campaigns made money.
 Shopify
 Amazon
 Meta Ads
 Google Ads
 Amazon Ads
 Klaviyo
 NetSuite
 QuickBooks
 Excel