Which new customers are falling behind in their first 90 days?
Compare every customer that went live in the last 90 days with how your healthy accounts ramped. See who is behind, and whether most of their seats have never been used or an onboarding question is waiting for an answer.
Open QuerriWhat you'll need
Querri (Free trial) to join the exports and build the view
Salesforce, weekly product usage and Intercom exports: Step 1 says what each adds
Your usage target: the same one your renewal review uses
Free resources
Start your free trial here →Sample data sets
Synthetic data for a made-up software company. Not real customer data.
Need help?
If you have any questions, you can request a demo or email our team.
Before we begin
Most CS teams can tell you how a new customer is doing by logging into its account and looking around. That works for five accounts, not for a quarter's worth. A slow start is easy to miss in week three and hard to fix in month nine. Usage sits in the warehouse, go-live dates in the CRM and onboarding questions in the support inbox, so a weekly review means stitching them together by hand.
This playbook lines every new customer up against the accounts that ramped well, flags who is behind, and shows what those accounts have in common.
How it works:
- • Upload Salesforce, weekly usage and Intercom
- • Chart how healthy accounts ramped
- • Place every new customer on that curve
- • See what the slow starters share
- • Build the call list for each CSM
Follow the steps
Upload Salesforce, BigQuery and Intercom
Three exports, one project:
- •
Salesforce (or HubSpot): go-live date, licensed seats, ARR and CSM for each account.
- •
BigQuery (or Amplitude, Mixpanel): who used which core feature, week by week since go-live.
- •
Intercom: onboarding and integration conversations, and who replied last.
Add your usage target in a small sheet, so it's easy to change. Prefer live data? Querri connects to Salesforce, BigQuery and Intercom directly.
Tip: Include accounts that went live last year too. They're the yardstick for the new ones.
-
 Salesforce accounts
-
 Weekly usage
-
 Intercom
 One project
Chart how healthy accounts ramped in their first 90 days
Pick the accounts that reached your usage target, and chart their first 13 weeks:
"For accounts that went live in the second half of 2025 and reached our 33% usage target by their third month, show the median and 25th percentile share of seats active each week after go-live."
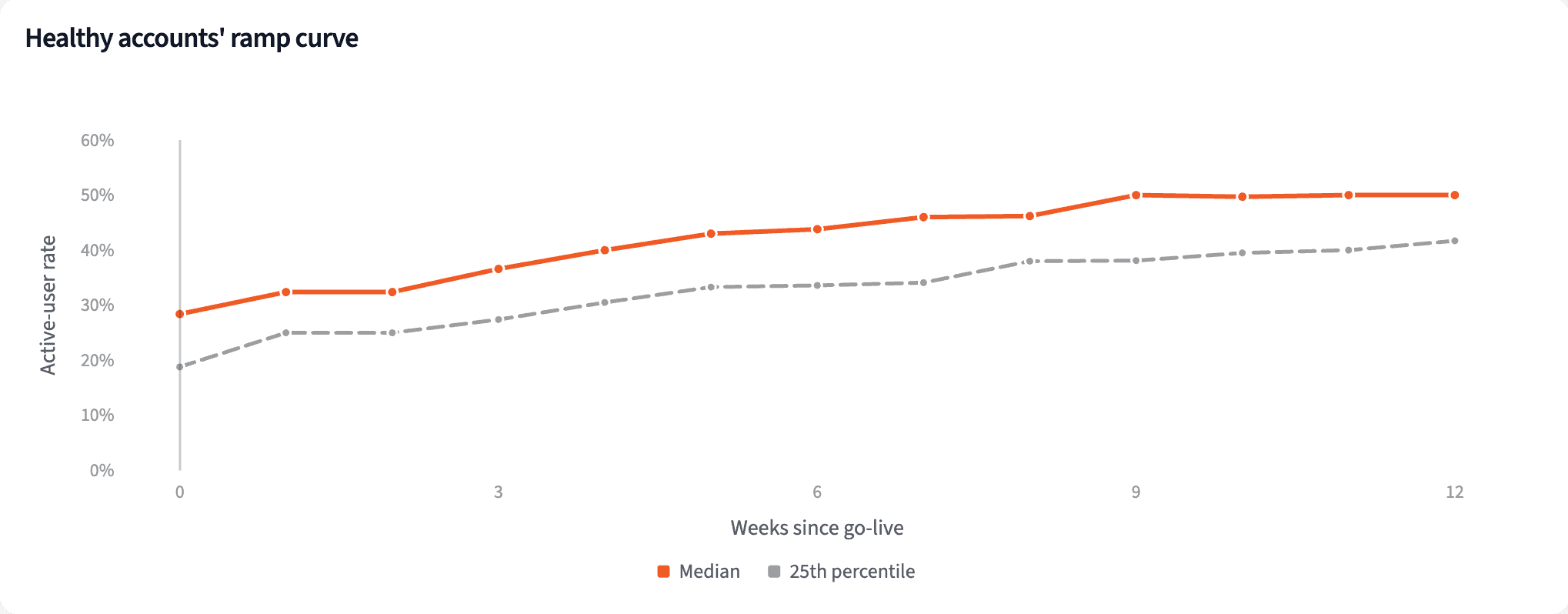
92 of the 117 accounts that went live last half-year count as healthy. Their median climbs from 28% of seats in week 0 to 50% by week 9.
| Week | Median | 25th percentile |
|---|---|---|
| Week 0 | 28.4% | 18.8% |
| Week 4 | 40.0% | 30.5% |
| Week 8 | 46.2% | 38.0% |
| Week 12 | 50.0% | 41.7% |
Healthy accounts' share of seats active, by week since go-live.
Place every new customer on that curve
Judge each account at its own week, against the healthy accounts at the same week:
"Compare every customer that went live from March 31 to June 28, 2026 with the healthy accounts at the same week, and mark each one on the curve, behind it, or far behind, by CSM."
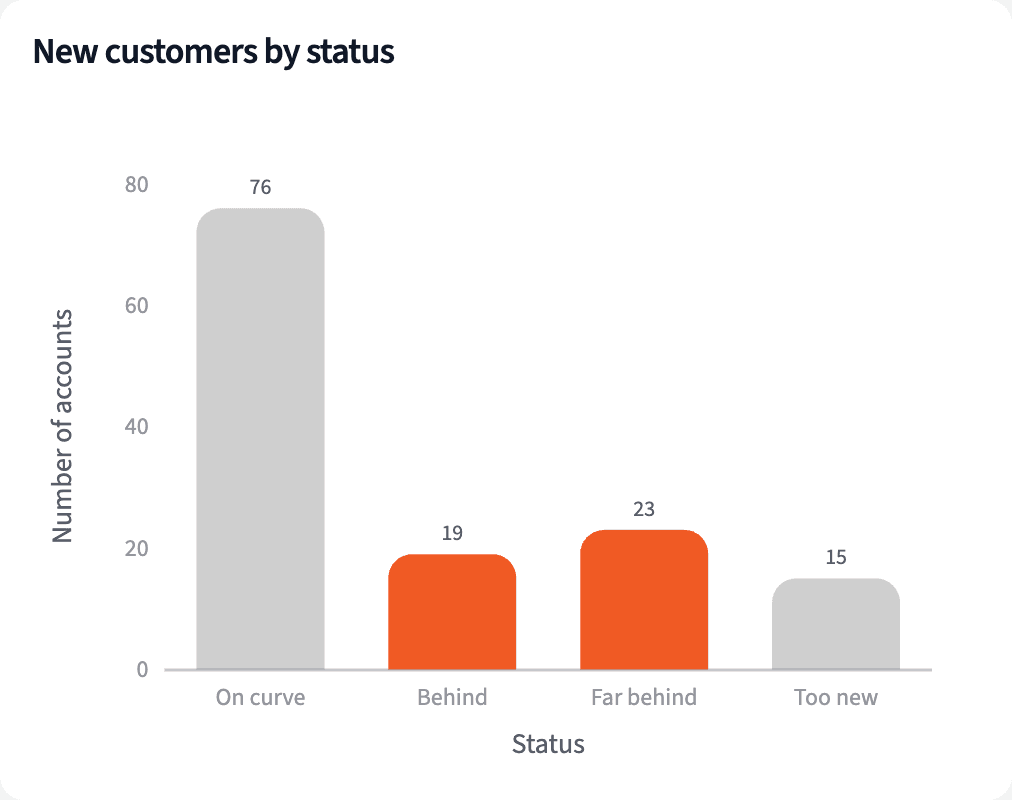
42 of the 133 customers that went live in the last 90 days are behind the curve, with $2.33M of ARR. 23 of them are far behind.
| Status | Accounts | ARR |
|---|---|---|
| On curve | 76 | $3,740,994 |
| Behind | 19 | $1,126,350 |
| Far behind | 23 | $1,203,525 |
| Too new (under 2 weeks of usage) | 15 | $782,300 |
Customers that went live March 31 to June 28, 2026, by status at their latest full week.
See what the accounts behind the curve have in common
Test the usual suspects side by side before you pick a fix:
"For the accounts behind the curve, how many of their seats have ever been active, is an onboarding or integration conversation waiting on us, and how long did go-live take, against the accounts on the curve?"
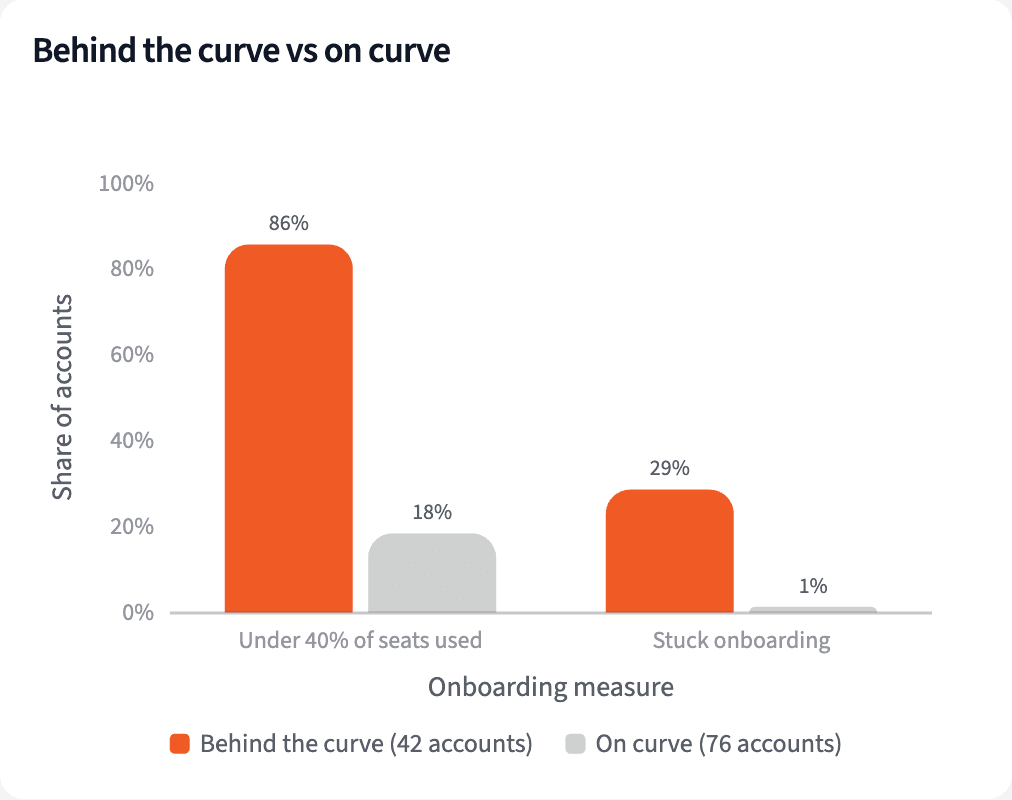
In most slow starters, under 40% of seats have ever been active. Accounts behind the curve and on it took about the same time to go live.
| Signal | Behind the curve | On curve |
|---|---|---|
| Under 40% of seats ever active | 86% | 18% |
| Onboarding question unanswered 7+ days | 29% | 1% |
| Median days to go-live | 31.5 | 34.5 |
Accounts behind the curve against accounts on it.
Produce the onboarding view
Four numbers for the weekly review, and a call list for each CSM.
The narrative Querri writes:
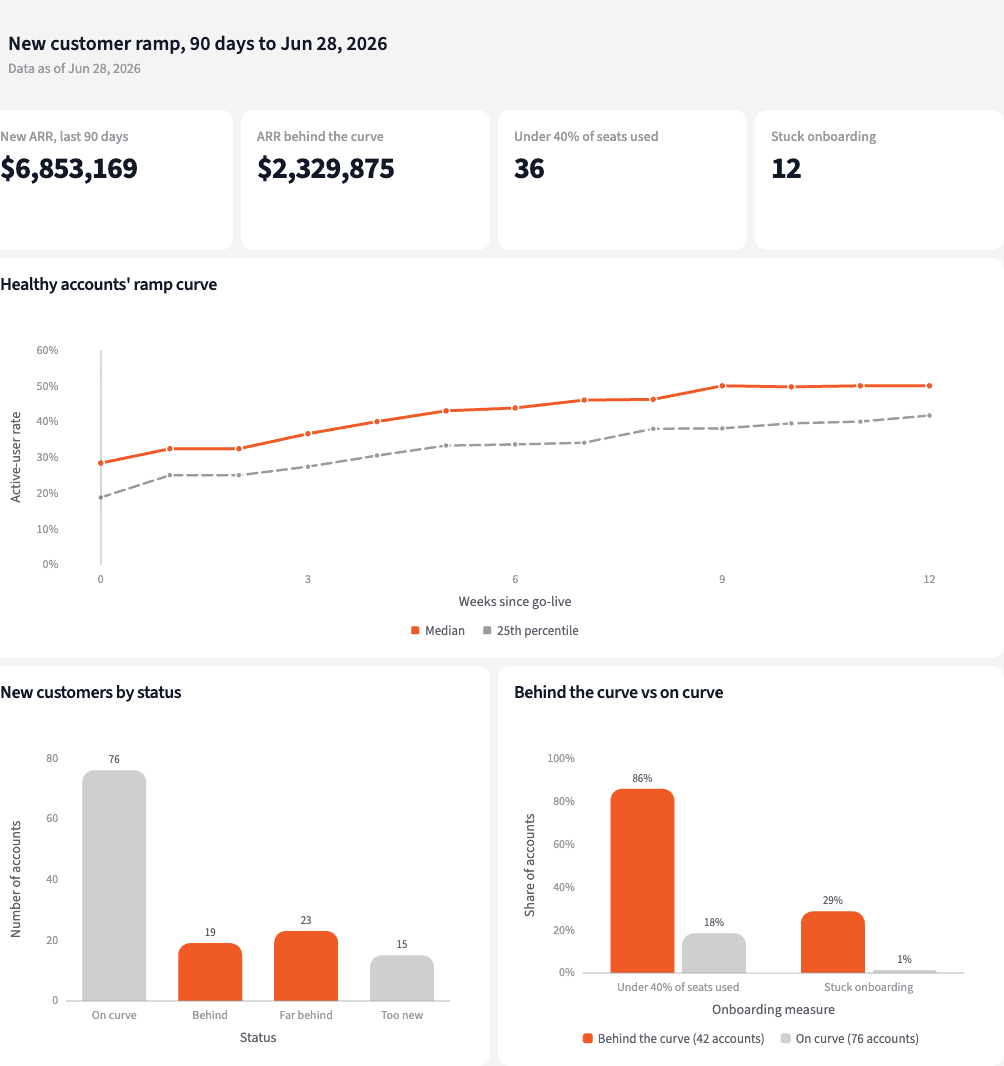
About a third of the new ARR from the last 90 days is behind the curve, and most of it shares one gap: under 40% of seats have ever been used.
What you can create or export:
- The call list, to Excel, CSV or Google Sheets
- A live dashboard that refreshes every week
- A presentation, to PDF or PowerPoint
| Account | Seats ever active | ARR |
|---|---|---|
| Scott-Mcgee | 15% | $157,500 |
| Nelson, Mercado and Anderson | 23% | $151,500 |
| Simpson Ltd | 16% | $127,100 |
| Jones-King | 27% | $120,000 |
The four largest of the 42 accounts behind the curve.
Catch the slow starts in week three, not at renewal.
Try it on your own dataTips for a new-customer review that catches slow starts
Count seats, not logins
A champion logging in every day can hide a team that never started. The share of licensed seats ever active is the number that moved first here.
Judge every account on its own clock
Line accounts up by week since go-live, not by calendar month, so a three-week-old customer isn't held to a three-month standard.
Teach Querri your rules once. Every answer after that follows them.
What counts as active, which accounts are healthy, when an account is behind: say each rule once and Querri applies it to every question on that data.
Show me how
Say it in chat
Settle a rule in conversation and the Librarian records it as a fact under Facts & Rules, attached to the table it governs. Every later question on that data applies it, whoever asks, and every view built afterwards carries it.
"Week 0 is the week that contains the Go-Live Date, and a seat is active in a week when its user ran Builder, Approvals or Reports. Save that as a rule for the weekly usage table."
Or bring the document that already says it
Upload your onboarding playbook or success plan template like any other file. Querri files a From a document card in the Inbox with the statements it found, each with its page and exact words; tick the ones to keep and they become facts. The rules this playbook depends on:
- Active seat: a user who ran Builder, Approvals or Reports that week
- Usage target: 33% of licensed seats active
- Week 0: the week (Monday start) that contains the Go-Live Date
- Healthy account: live in the second half of 2025, 33% or more of seats active in weeks 9 to 12
- Behind the curve: below the healthy 25th percentile at the same week; far behind is below half of it
- Low seat use: under 40% of seats ever active since go-live
- Onboarding question waiting: open, tagged onboarding or integration, no team reply for 7 days
"Read our onboarding playbook and propose the rules it states about go-live, the first 90 days and what a healthy rollout looks like. I'll review them in the Inbox."
Where the rules reach
A rule is attached to the data, not to one person's chat, so it follows the data everywhere:
- • Every question asked in chat, by anyone on the team
- • Every view the Librarian builds on that data
- • Every step of a project, including the code it writes
- • Dashboards and scheduled runs, each time they refresh
- • Claude and ChatGPT, when they ask Querri
You stay in control
Every rule is listed under Facts & Rules next to the data it governs, where you can edit or remove it. Rules from a document wait for your tick in the Inbox, and a Worth remembering card is how Querri offers one it noticed itself. Workspaces and roles decide who can change what. Company-wide rules go in Settings → Customize; the Library is where the rest lives.
The payoff every Monday
The weekly review starts on the accounts behind the curve, not on logging into each one. Moving the target or the window is a sentence.
Frequently asked questions
What counts as behind the curve?
Which accounts count as healthy?
Why compare by week since go-live?
Why the 25th percentile and not the median?
Does a fast go-live mean a customer will ramp?
What does under 40% of seats used tell you?
Does this say these customers will churn?
What if go-live dates are entered late?
How often should this run?
Other popular resources
Playbook
Renewals below target
Which accounts renewing next quarter are below our usage target?
Playbook
Booked to billed
Did last quarter's closed-won deals start billing and get used?
Demo
Request a walkthrough
See Querri in action with your own data.
Pricing
Compare plans
Find the right plan for individuals, teams, or enterprise.