Which orders are turning into support tickets this week, and is it the warehouse, the carrier, or the product?
Join your helpdesk, Shopify, Amazon and warehouse exports in Querri. See which of this week's tickets were caused by late shipping rather than the product, what they cost in support hours, and the lanes and warehouse days to fix first.
Open QuerriWhat you'll need
Querri (Free trial) to join the exports and build the Monday view
Helpdesk, Shopify, Amazon and warehouse exports: Step 1 lists what to pull from each
Your shipping promises and support cost assumptions: to define "late" and turn tickets into hours
Free resources
Start your free trial here →Sample data sets
Synthetic datasets for a made-up consumer brand. Not real customer data. Safe to download and explore.
Need help?
If you have any questions, you can request a demo or email our team.
Before we begin
Monday morning, the ticket count is up, and the first question is always the same: is it us? The helpdesk knows what customers asked. It doesn't know whether the order shipped late, which carrier had it, or whether it was ever going to arrive on time. That lives in three other systems, and lining them up by hand has been a weekly job for a lot of support leads.
This playbook ties every ticket to its order, rebuilds each order's journey, and attributes the ticket to the warehouse, the carrier, the product, or customer impatience. Then it gives you the Monday view: four numbers, what they cost, and what to fix.
How it works:
- • Upload helpdesk tickets, Shopify and Amazon orders, and the warehouse exports
- • Tie every ticket to its order
- • Rebuild each order's journey and flag what went wrong
- • Find what predicts a ticket, then attribute each one
- • Produce the Monday view
Follow the steps
Upload your helpdesk, Shopify, Amazon and warehouse exports
Four exports, one project:
- •
Helpdesk (Gorgias here; Zendesk works the same way): the ticket export, including tags, customer email and the order-number field.
- •
Shopify: the Orders export. Keep the shipping method; it's the promise the customer saw.
- •
Amazon Seller Central: the All Orders report, with Amazon's promised dates and who fulfilled the order.
- •
Warehouse or 3PL: the shipments export and the carrier tracking events.
Add a small table of your support cost assumptions (handle time by ticket type, agent cost per hour). Querri profiles every file and works out how they relate.
Tip: Pull at least twelve weeks, so a bad week and a bad lane look different.
-
 Gorgias
-
 Shopify
-
 Amazon Seller Central
-
 3PL / ShipStation
 One project
Tie every ticket to its order, and say how many you couldn't
Tickets rarely arrive with a clean order number. Match in priority order: the order-number field, then the subject line, then the customer's email against orders from the last 30 days. The unmatched tickets are part of the answer. Then classify each ticket by its first tag:
"Tie every ticket to its order: match on the order-number field first, then an order number in the subject, then the customer's email against Shopify orders in the last 30 days. Report the match rate by method, the unmatched tickets by type, and all tickets by type."
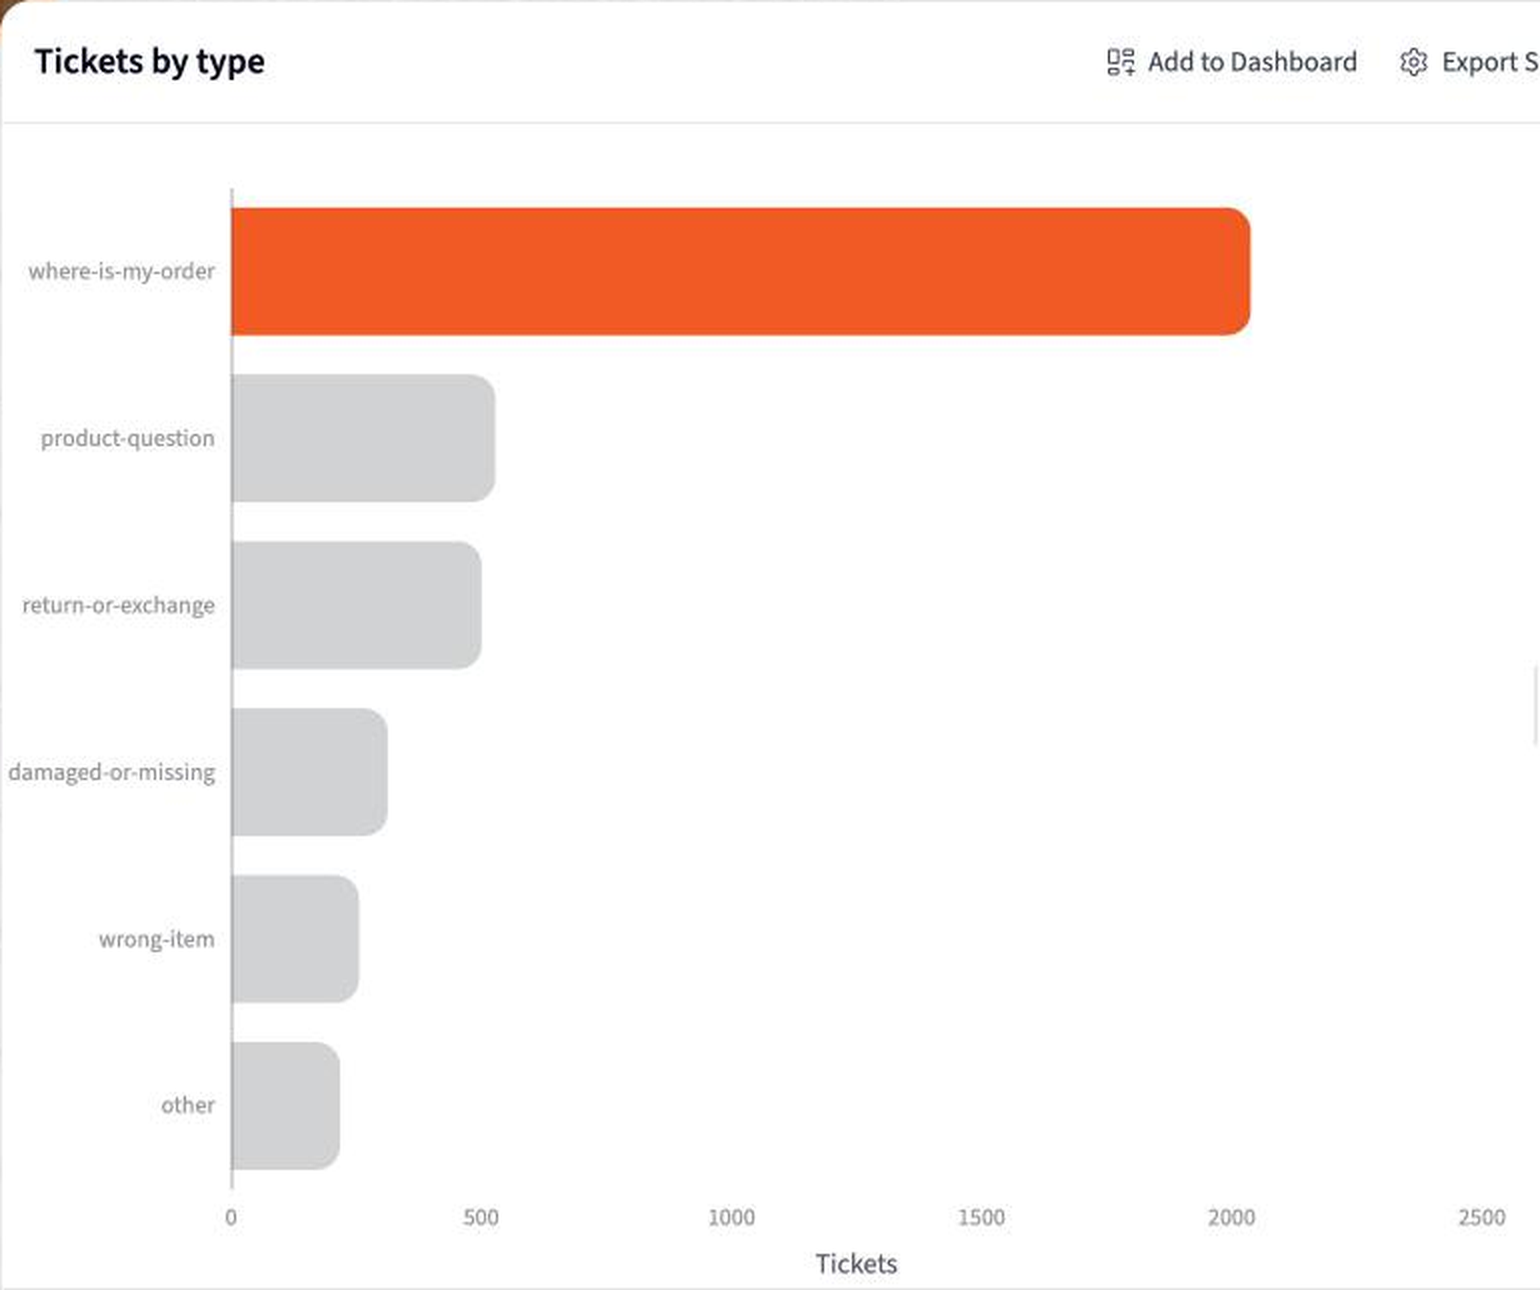
3,392 of 3,854 tickets tie to an order (88%). One in five needed the subject line or the email. Where-is-my-order is already 52.9% of everything the team handled.
| Match method | Tickets | Share |
|---|---|---|
| Order-number field | 2,130 | 55.3% |
| Order number in subject | 782 | 20.3% |
| Email, 30-day window | 480 | 12.5% |
| Unmatched | 462 | 12.0% |
Ticket-to-order matching across 3,854 tickets.
Rebuild each order's journey and flag what went wrong
For every order the warehouse shipped, work out when it should have left, when it should have arrived, and when it actually did. Flag late from the warehouse, late in transit, and lost or stuck. Amazon-fulfilled orders have no warehouse row and sit this step out:
"For every order the warehouse shipped, work out when it should have shipped and arrived, when it actually did, and flag late-from-warehouse, late-in-transit, and lost or stuck. Show late rates by carrier service and by lane, and the warehouse's late-ship rate by week."
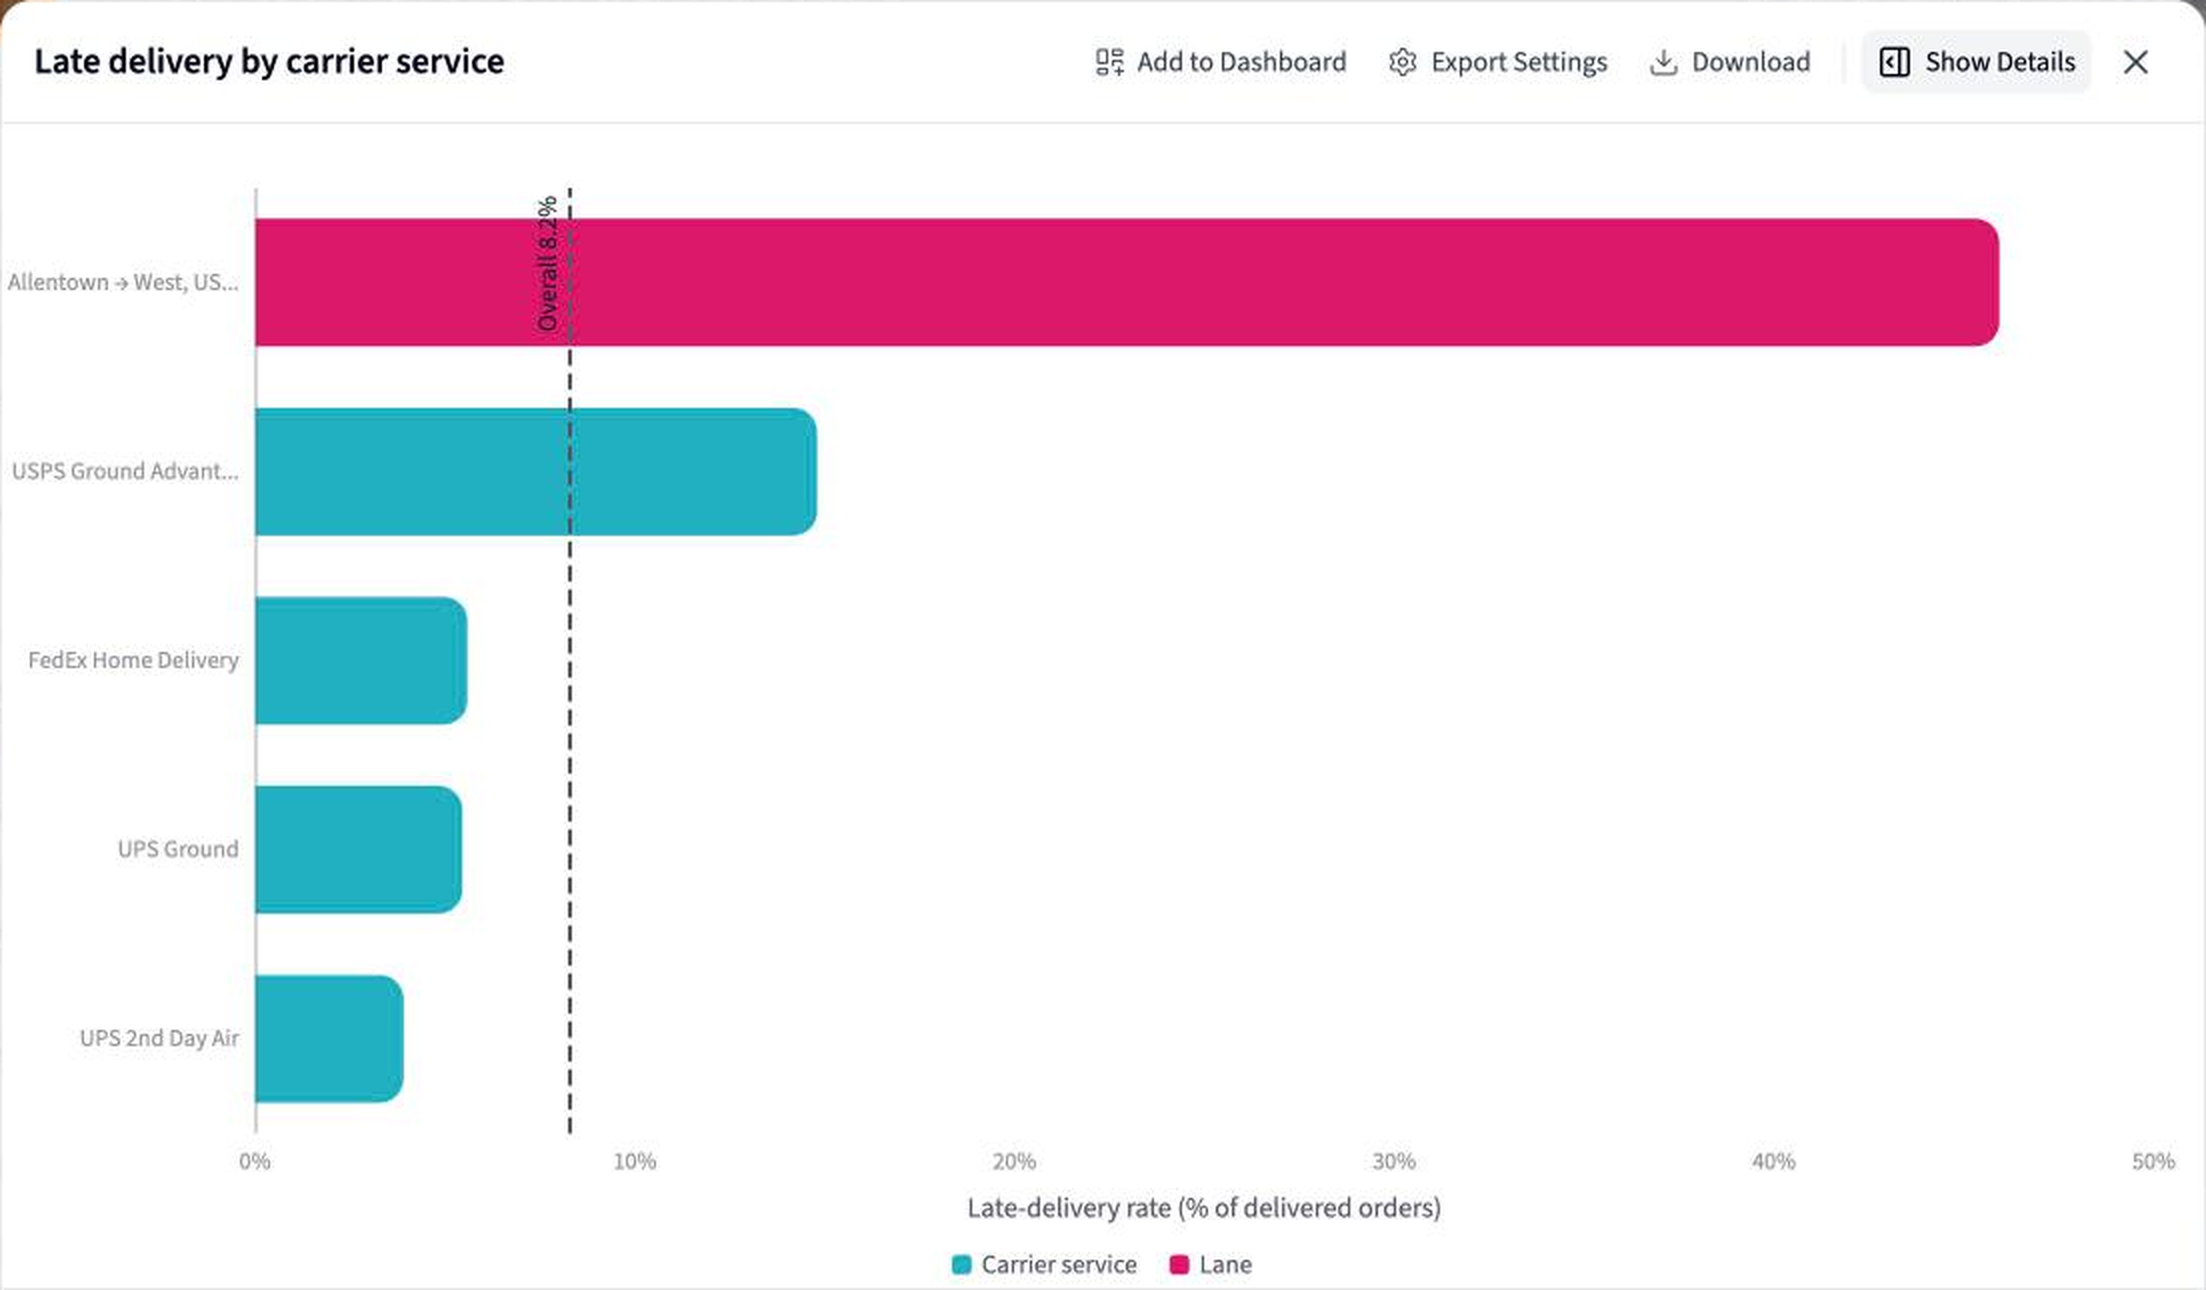
8.2% of orders missed the promise, but the average hides the pattern. USPS Ground Advantage runs 14.8% late against 5.5% for UPS Ground, and over 40% on the long lanes out of Allentown. Allentown's own late-ship rate jumped from 6% to 40.6% in the week of October 12.
| Carrier service | Delivered late |
|---|---|
| USPS Ground Advantage | 14.8% |
| UPS Ground | 5.5% |
| FedEx Home Delivery | 5.1% |
| Allentown → West, USPS Ground Advantage | 45.9% |
Late-delivery rate by carrier service, 41,391 delivered orders.
Work out what actually predicts a ticket, then attribute each one
Before you blame anyone, test the candidates: ticket rate per 100 orders by days late, by product category, by carrier service, and by fulfilment type. Then give every matched ticket one owner:
"Show tickets per 100 orders by how late the order was, by product category for on-time orders, by carrier service, and by fulfilment type. Then attribute each matched ticket to the warehouse, the carrier, the product, or customer expectation."
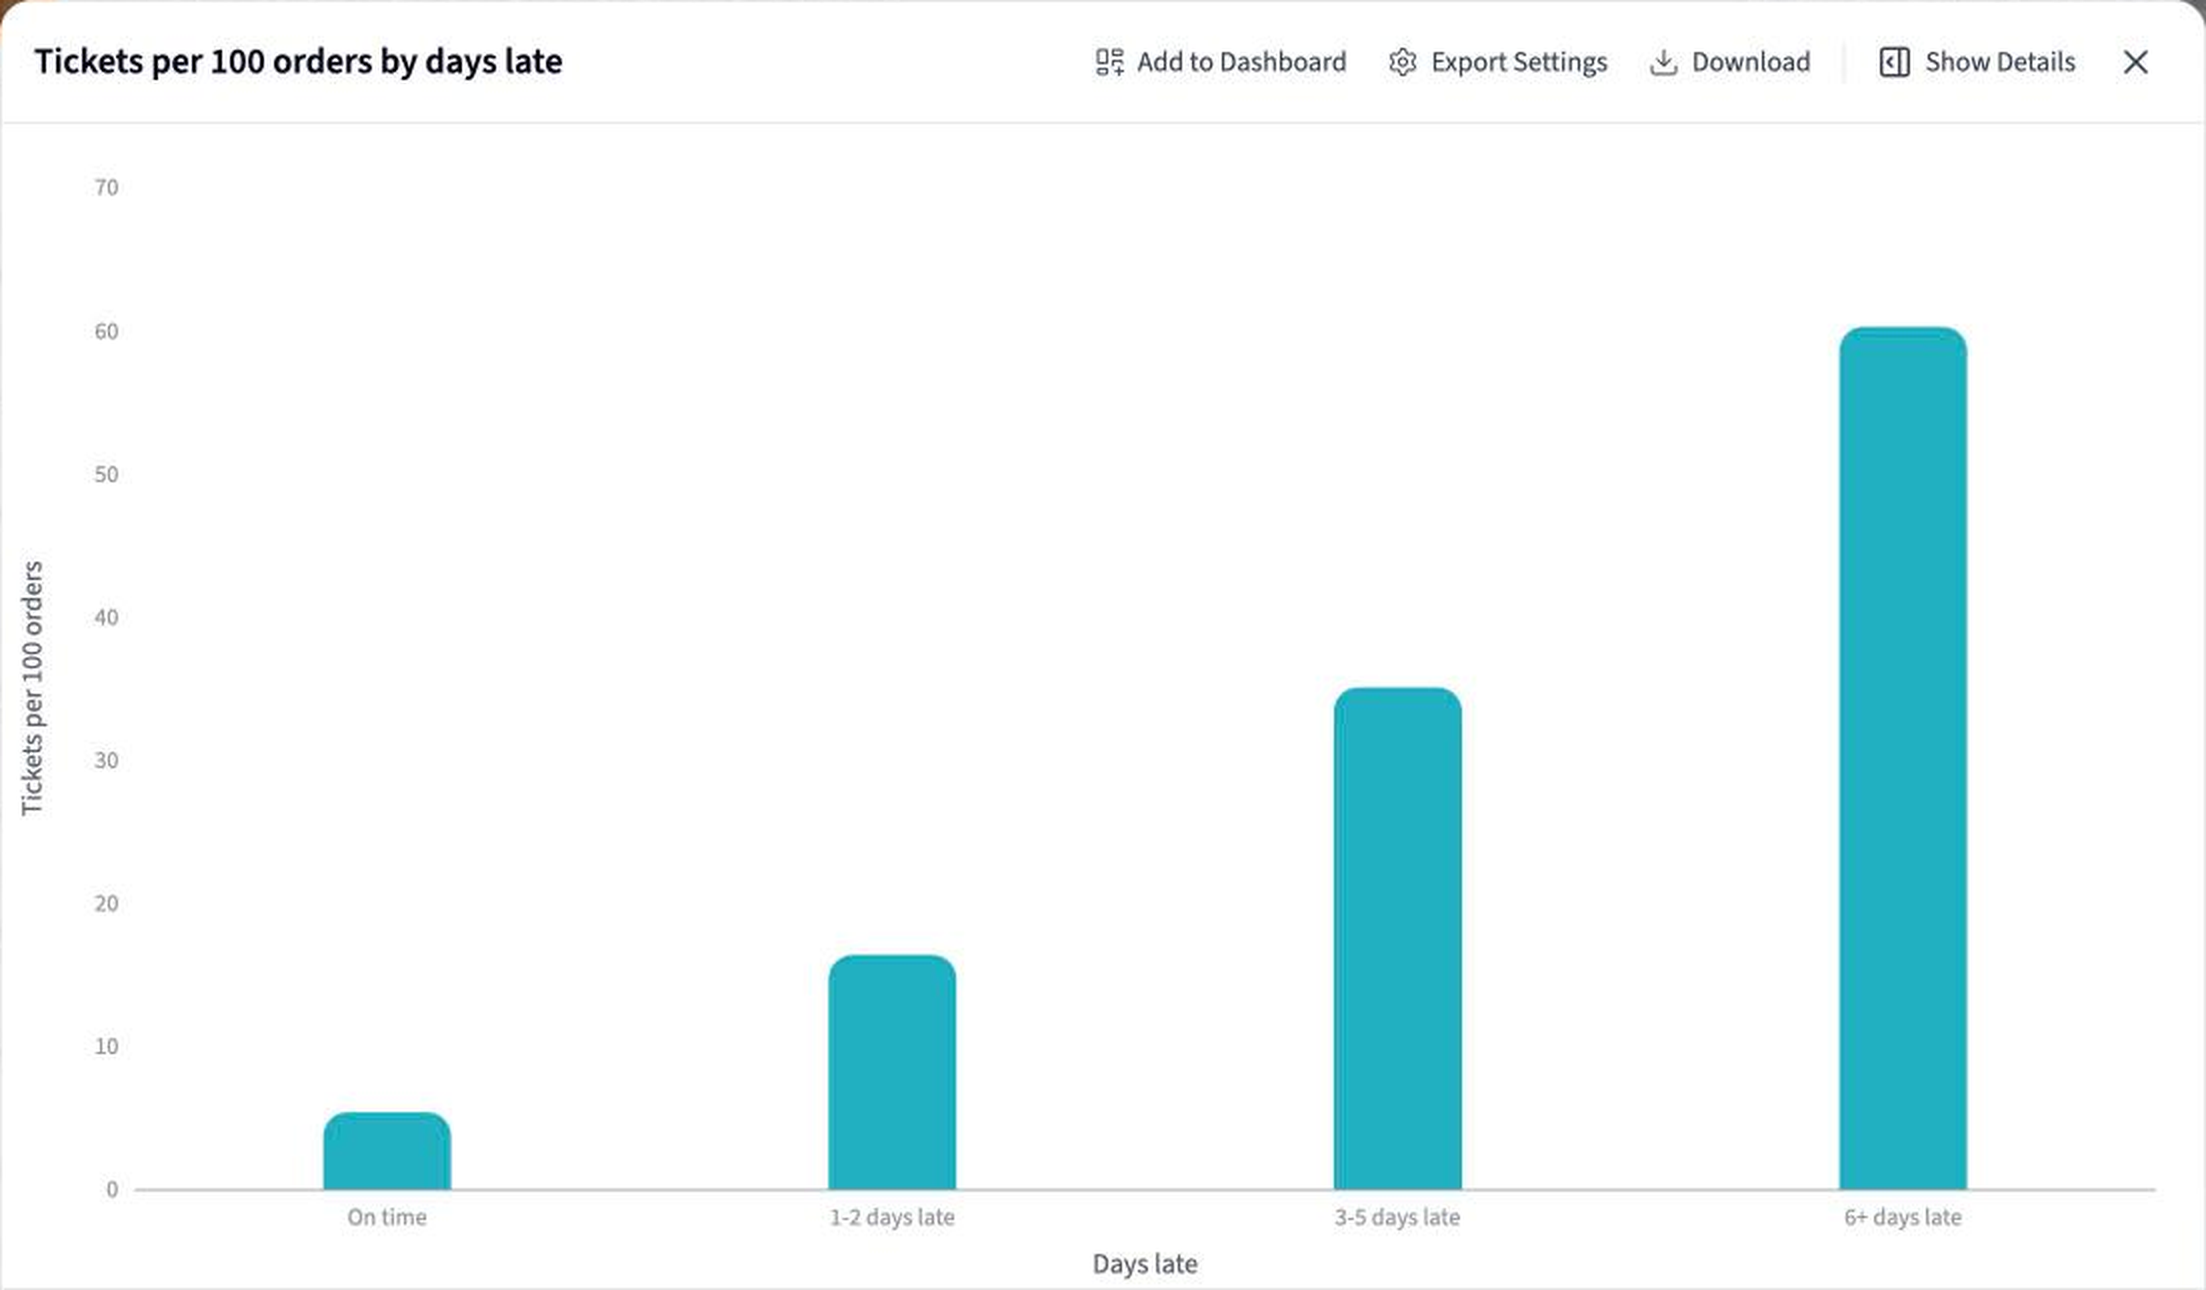
Days late is the whole story: 5.4 tickets per 100 on-time orders, 60.3 at six or more days late. Product category doesn't separate at all. Amazon-fulfilled orders barely register, because Amazon is answering those customers.
| Delivery | Tickets per 100 orders |
|---|---|
| On time | 5.4 |
| 1 to 2 days late | 16.4 |
| 3 to 5 days late | 35.1 |
| 6 or more days late | 60.3 |
Tickets per 100 delivered orders, by days past the promised date.
Produce the Monday view
The attribution becomes the four numbers your Monday meeting needs, the hours behind them, and the lanes and warehouse days to fix.
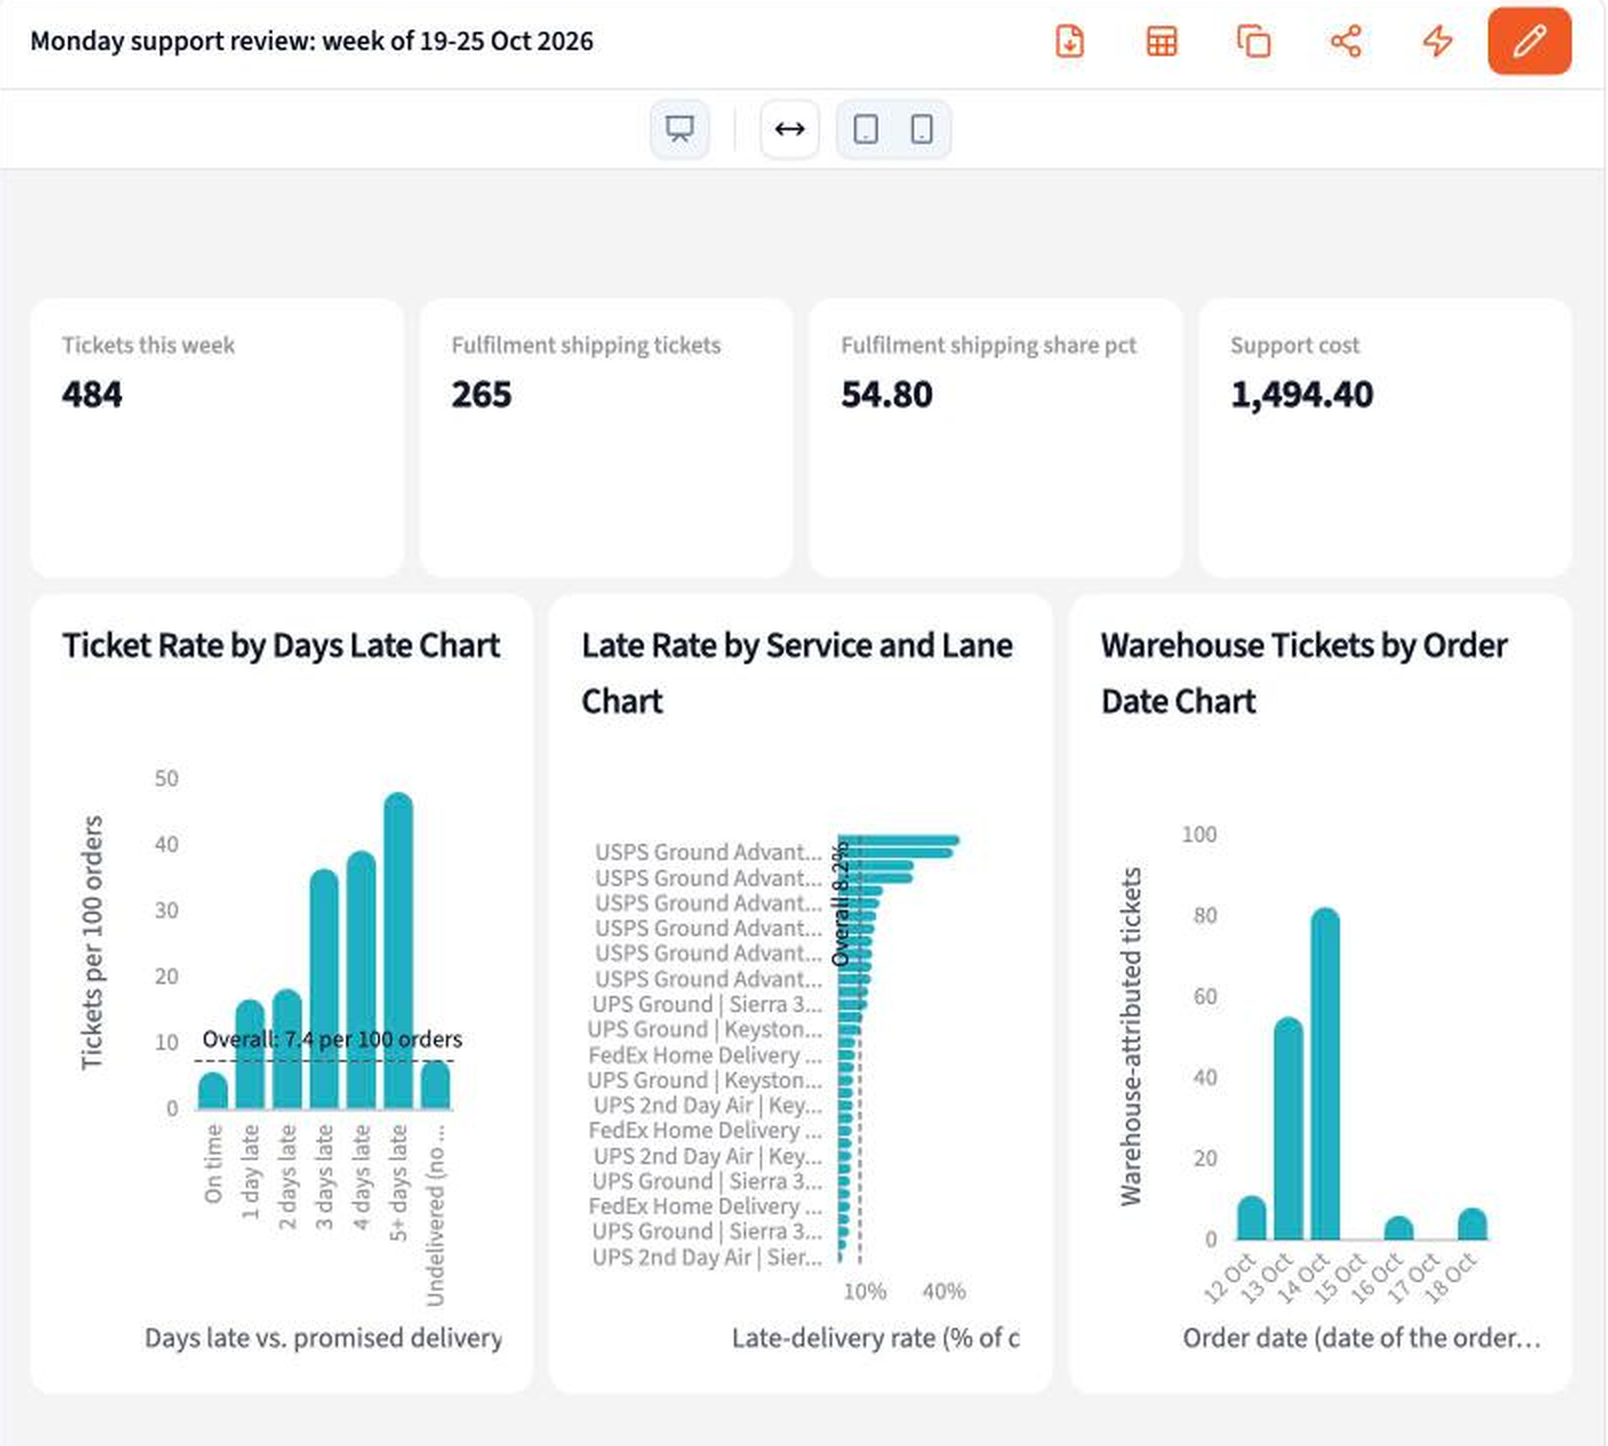
Tickets this week
484
337 the week before, up 44%
Caused by fulfilment and shipping
265
54.8%: warehouse 210, carrier 55
Support cost on those
$1,494
46.7 of the week's 80.3 hours
Late and still undelivered
343
next week's tickets, unless you write first
The narrative Querri writes:
Ticket volume is up sharply, and more than half of it is self-inflicted.
- • The warehouse is the main driver. Orders placed on October 13 and 14 sat at Allentown for three to four extra days, and 137 of this week's tickets trace back to those two days.
- • The carrier problem is one service on a few lanes: USPS Ground Advantage out of Allentown, where more than four in ten deliveries miss the promise.
- • 343 orders are past their promised date and still undelivered. Each is a likely ticket next week.
What you can create or export:
- The Monday view as a one-pager
- The ticket-level table with every match, flag and attribution, to Excel, CSV, or Google Sheets
- A live dashboard, refreshed on a schedule
- A presentation for the operations meeting, to PDF or PowerPoint
- A saved project you re-run every Monday
| Order date | Warehouse tickets |
|---|---|
| Mon Oct 12 | 11 |
| Tue Oct 13 | 55 |
| Wed Oct 14 | 82 |
| Rest of the week | 14 |
This week's warehouse-attributed tickets by the date the order was placed.
Tips for a Monday review people actually trust
Report the match rate before the findings
If 12% of tickets couldn't be tied to an order, say so first. Readers trust an analysis that shows its gaps.
Separate late-from-warehouse from late-in-transit
Different owners, different fixes. Here the warehouse produced 210 tickets and the carrier 55, the opposite of what the complaints suggested.
Test product category before you blame it
Run the ticket rate on on-time orders only. Here every category landed within half a point, and the product conversation became a shipping conversation.
Run it the same way every week
Save the project and schedule it. A lane moving from 6% to 14% late is a clearer signal than any single bad week.
Teach Querri your rules once. Every answer after that follows them.
The definitions that decide who owns a ticket are yours: what "late" means for each shipping method, which tags count as where-is-my-order, how your 3PL writes order numbers, what a ticket costs. In Querri they live in the Library, so you say each one once and every question, view and analysis on that data reads it the same way.
Show me how
Say it in chat
Settle a rule in conversation and the Librarian records it as a fact under Facts & Rules, attached to the table it governs. Every later question on that data applies it, whoever asks, and every view built afterwards carries it.
"Late means delivered after the promised date: order date plus 7 business days for Standard and 3 for Expedited, or Amazon's promised delivery date. Save that as a rule for the orders and shipments tables."
Or bring the document that already says it
Upload the 3PL agreement, the support playbook or your data dictionary like any other file. Querri files a From a document card in the Inbox with the statements it found, each with its page and exact words; tick the ones to keep and they become facts. Dictionary entries attach to the columns they describe. The rules this playbook depends on:
- Promised delivery: order date plus the shipping method's window for Shopify; Amazon's promised delivery date for Amazon
- Late from the warehouse: shipped after the ship-by date
- Late in transit: shipped on time, delivered after the promise
- Ticket type: the helpdesk's first tag
- Where-is-my-order on an on-time order is customer expectation, not a fulfilment failure
- The 3PL writes Shopify order #48213 as SHP-48213 and Amazon orders with an AMZ- prefix
- Support cost: handle time by ticket type times a loaded agent cost per hour
"Read our 3PL agreement and propose the rules it states about ship-by dates, delivery promises and claims. I'll review them in the Inbox."
Where the rules reach
A rule is attached to the data, not to one person's chat, so it follows the data everywhere:
- • Every question asked in chat, by anyone on the team
- • Every view the Librarian builds on that data
- • Every step of a project, including the code it writes
- • Dashboards and scheduled runs, each time they refresh
- • Claude and ChatGPT, when they ask Querri
You stay in control
Every rule is listed under Facts & Rules next to the data it governs, where you can edit or remove it. Rules from a document wait for your tick in the Inbox, and a Worth remembering card is how Querri offers one it noticed itself. Workspaces and roles decide who can change what. Company-wide rules go in Settings → Customize; the Library is where the rest lives.
The payoff on Monday
The argument moves off what "late" means and onto what to do about it. Fixing a definition is a sentence, not a ticket.
Frequently asked questions
What does "caused by fulfilment and shipping" mean?
Why not just read the helpdesk's own reports?
How much does lateness actually matter?
Don't certain products just generate more tickets?
What if tickets don't mention the order number?
Why do so few Amazon orders show up as tickets?
What counts as "late"?
How often should this run?
What do I do with the orders that are late but haven't become tickets yet?
Other popular resources
Playbook
Customer health score without a CS platform
Build and monitor a health score from the data you already have.
Playbook
Ticket volume drivers
Find what's driving repeat contacts and reduce them.
Demo
Request a walkthrough
See Querri in action with your own data.
Pricing
Compare plans
Find the right plan for individuals, teams, or enterprise.