Which communities are slipping on resident experience, and what else changed?
Score each community from the survey and compare it with the last wave. See which questions moved, with participation, staffing and move-outs beside them.
Open QuerriWhat you'll need
Querri (Free trial) to set survey scores beside participation and staffing
SurveySparrow, LifeLoop, Yardi and Workday: Step 1 says what each adds
Your survey and participation rules: so every community is scored the same way
Free resources
Start your free trial here →Sample data sets
Synthetic data for Tallowmere Senior Living, a made-up operator with four communities. Residents appear as codes only. Not real resident, family, staff or financial data.
Need help?
If you have any questions, you can request a demo or email our team.
Before we begin
Each survey wave lands as a report of its own. Seeing what else changed at a community means opening the engagement app, the move-out report and the schedule, and comparing them by hand. Scores, attendance, move-outs and staffing each live in a different system.
This playbook scores every community from the latest wave, finds the questions that moved, and puts participation, agency hours and move-outs beside the score.
How it works:
- • Connect SurveySparrow; upload LifeLoop, Yardi and Workday
- • Score each community against the last wave
- • Find the questions that moved
- • Put participation, staffing and move-outs beside it
- • Build the community experience review
Follow the steps
Connect SurveySparrow; upload LifeLoop, Yardi and Workday
Four sources, one project:
- •
SurveySparrow: resident and family answers by question and wave.
- •
LifeLoop (or your engagement app): who attended which program, and when.
- •
Yardi (or your resident system): residents in house and move-outs.
- •
Workday (or your payroll): care hours by employee or agency.
SurveySparrow connects directly; the others come in as exports.
Tip: Bring two survey waves, so every score has a change beside it.
-
 SurveySparrow
-
 LifeLoop attendance
- Yardi residents
- Workday hours
 One project
Score each community against the last wave
Start with the overall question, community by community:
"Score each community on the overall satisfaction question for the Q3 survey and compare it with Q2. Whose score fell most?"
Kestrel Grove fell from 4.48 to 3.82, the largest change. The portfolio moved from 4.33 to 4.22.
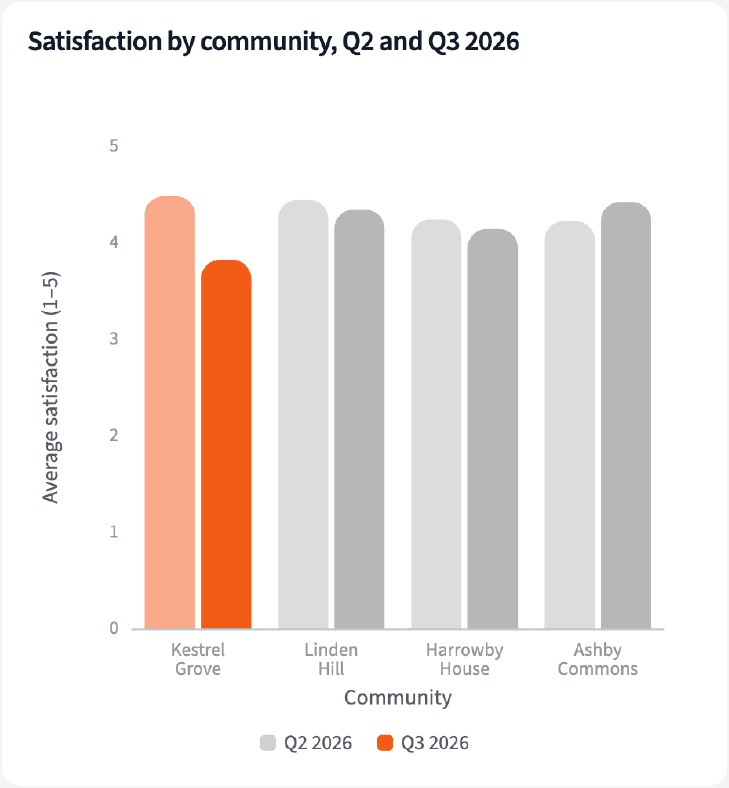
| Community | Q2 to Q3 | Q3 answers |
|---|---|---|
| Kestrel Grove | 4.48 to 3.82 | 56 |
| Harrowby House | 4.24 to 4.14 | 59 |
| Linden Hill | 4.44 to 4.34 | 88 |
| Ashby Commons | 4.22 to 4.42 | 83 |
Average answer to the overall question, 1 to 5, residents and families together, with the number of Q3 answers.
Find the questions that moved
Then find which questions moved at that community:
"For Kestrel Grove, which survey questions moved between Q2 and Q3, and which held?"
The questions about staff fell furthest, led by seeing familiar staff from week to week. Dining held.
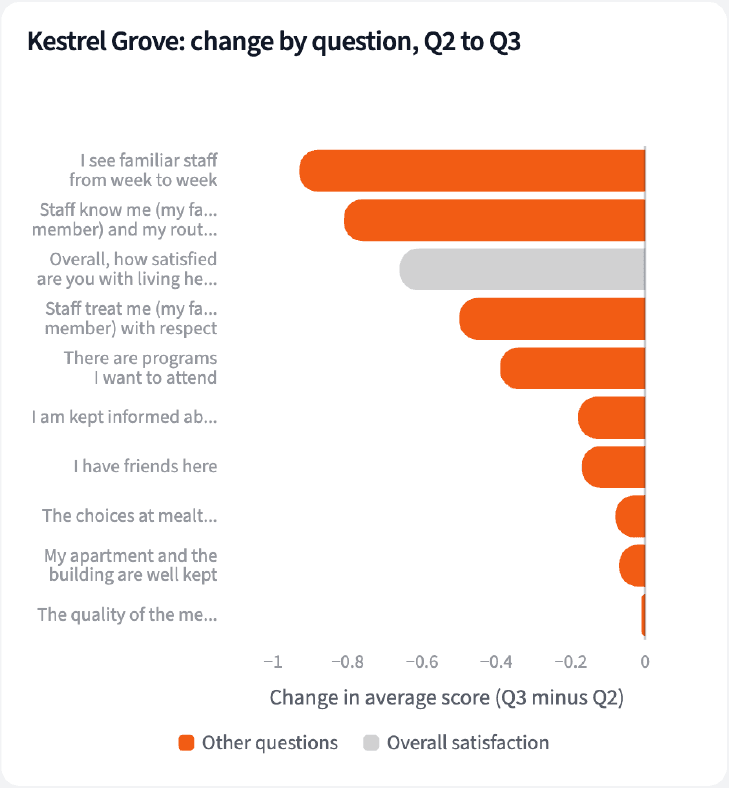
| Question | Q3 | Change |
|---|---|---|
| I see familiar staff from week to week | 3.33 | -0.93 |
| Staff know me and my routines | 3.58 | -0.81 |
| Staff treat me with respect | 4.09 | -0.50 |
| The quality of the meals | 4.28 | -0.01 |
Kestrel Grove, change in average answer from Q2 to Q3 2026.
Put participation, staffing and move-outs beside it
Last, see what else changed at the same community:
"Put program participation from LifeLoop, agency share of care hours from Workday and move-outs from Yardi beside each community's score, for Q2 and Q3."
At Kestrel Grove, participation fell from 80.0% to 56.9% and the agency share of care hours rose from 8.7% to 15.8% over the same quarter.
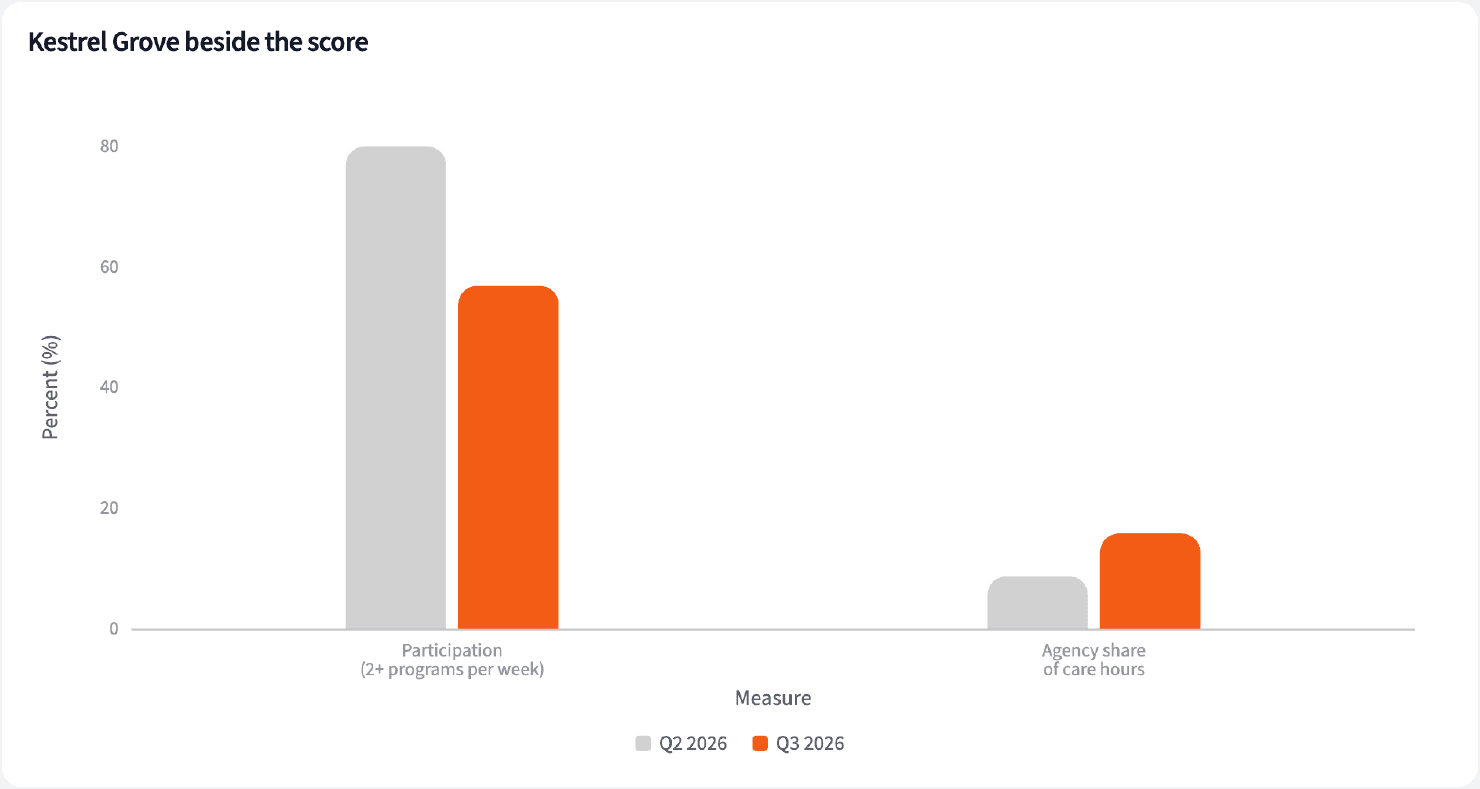
| Measure | Q2 2026 | Q3 2026 |
|---|---|---|
| Satisfaction | 4.48 | 3.82 |
| Participation | 80.0% | 56.9% |
| Agency share of care hours | 8.7% | 15.8% |
| Move-outs | 5 | 5 |
Kestrel Grove. Participation: residents at two or more programs a week. Agency share: agency hours over all care hours.
Build the community experience review
Four numbers for the review, and what changed alongside the score.
The narrative Querri writes:
Kestrel Grove's score fell most in Q3, led by the questions about staff, while participation fell and agency hours rose there.
What you can create or export:
- The table, to Excel, CSV or Google Sheets
- A live dashboard that refreshes when new exports land
- A presentation for the meeting, to PDF or PowerPoint
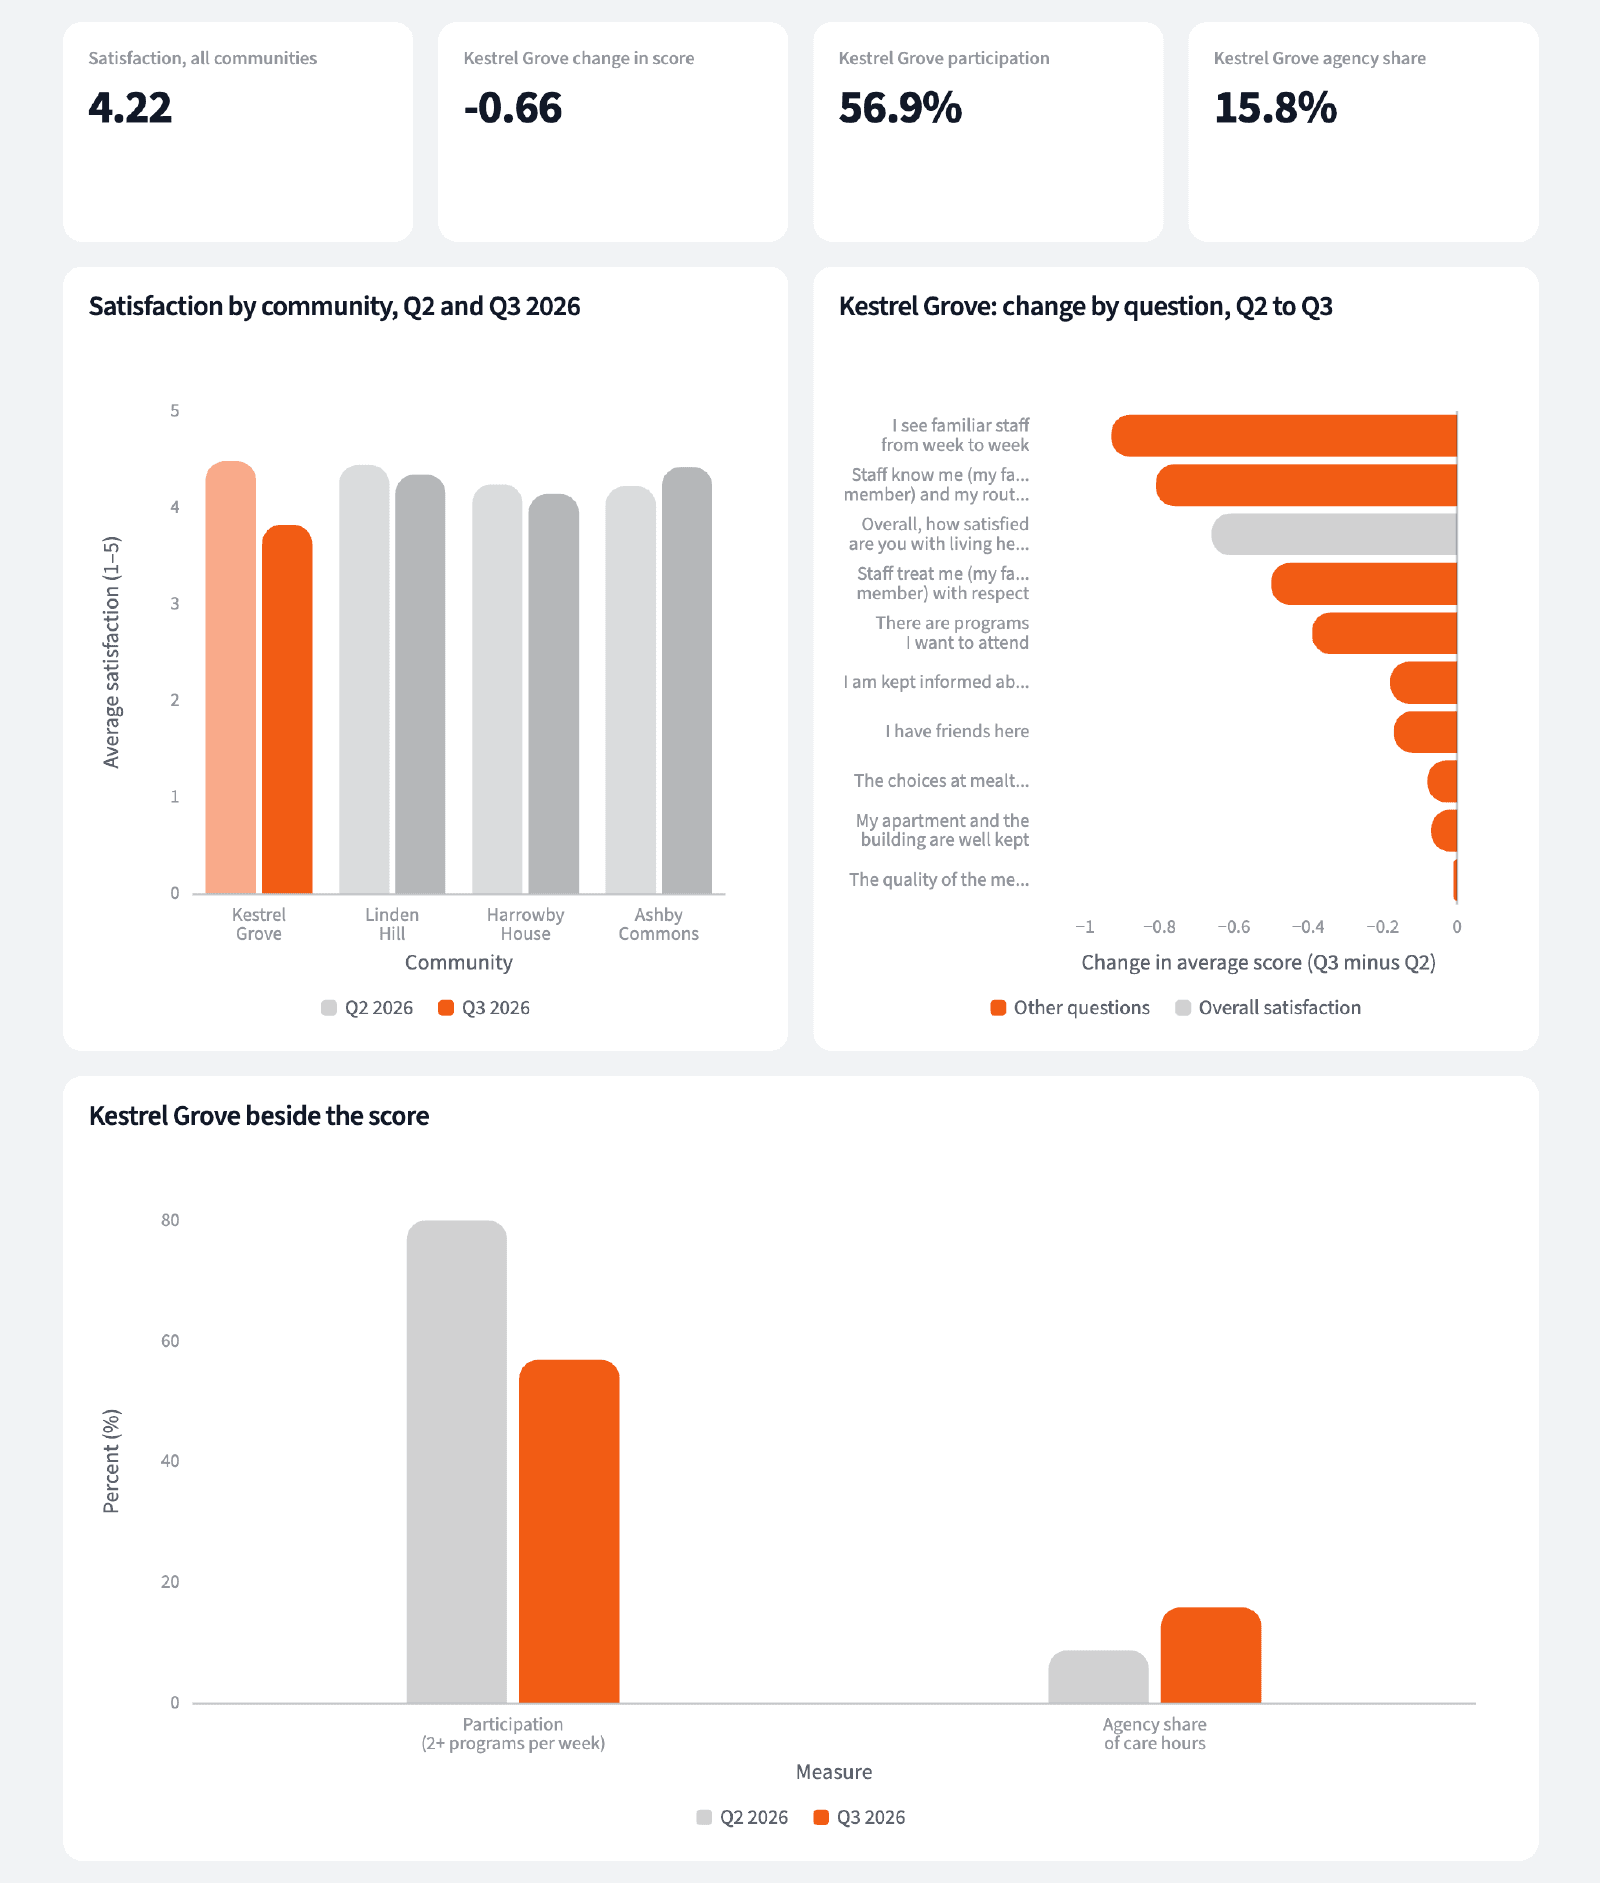
| Community | Score, Q2 to Q3 | Participation |
|---|---|---|
| Kestrel Grove | 4.48 to 3.82 | 56.9% |
| Harrowby House | 4.24 to 4.14 | 65.9% |
| Linden Hill | 4.44 to 4.34 | 71.1% |
| Ashby Commons | 4.22 to 4.42 | 69.5% |
Q3 2026 community review.
Know which community to visit first, and what to ask about when you get there.
Try it on your own dataTips for a survey review people trust
Keep the answer count beside the score
A community with 56 answers moves more from a few residents than one with 88. Show both.
Read the questions, not just the overall score
A score that falls on staff questions and holds on dining points to a different conversation than the reverse.
Teach Querri your rules once. Every answer after that follows them.
What the satisfaction score is, what participating means, how agency share is counted, which move-outs count: say each rule once and Querri applies it to every question on that data.
Show me how
Say it in chat
Settle a rule in conversation and the Librarian records it as a fact under Facts & Rules, attached to the table it governs. Every later question on that data applies it, whoever asks, and every view built afterwards carries it.
"Satisfaction is the average answer to the overall question, residents and families together. Save that as a rule for the SurveySparrow survey table."
Or bring the document that already says it
Upload your resident experience standards like any other file. Querri files a From a document card in the Inbox with the statements it found, each with its page and exact words; tick the ones to keep and they become facts. The rules this playbook depends on:
- Satisfaction: the average answer to the overall question, 1 to 5
- Each survey period is one wave
- Participation: residents at two or more programs a week
- Agency share: agency hours over all care hours
- Move-outs leave out transfers between care settings
- Residents appear by code, never by name
"Read our resident experience standards and propose the rules they state about surveys and participation. I'll review them in the Inbox."
Where the rules reach
A rule is attached to the data, not to one person's chat, so it follows the data everywhere:
- • Every question asked in chat, by anyone on the resident experience team
- • Every view the Librarian builds on that data
- • Every step of a project, including the code it writes
- • Dashboards and scheduled runs, each time they refresh
- • Claude and ChatGPT, when they ask Querri
You stay in control
Every rule is listed under Facts & Rules next to the data it governs, where you can edit or remove it. Rules from a document wait for your tick in the Inbox, and a Worth remembering card is how Querri offers one it noticed itself. Workspaces and roles decide who can change what. Company-wide rules go in Settings → Customize; the Library is where the rest lives.
The payoff in the review
Each community's score comes with what changed beside it. Changing what counts as participating is a sentence.
Frequently asked questions
How is the score calculated?
Did agency staffing cause the drop?
Why look at individual questions?
What does participation mean here?
Are 56 answers enough?
Can I see family and resident answers apart?
Do I need connectors for all four?
How often should this run?
Other popular resources
Playbook
The first 90 days
Are new residents settling in during their first 90 days?
Playbook
Residents to see this week
Which residents are coming to fewer programs than usual?
Demo
Request a walkthrough
See Querri in action with your own data.
Pricing
Compare plans
Find the right plan for individuals, teams, or enterprise.