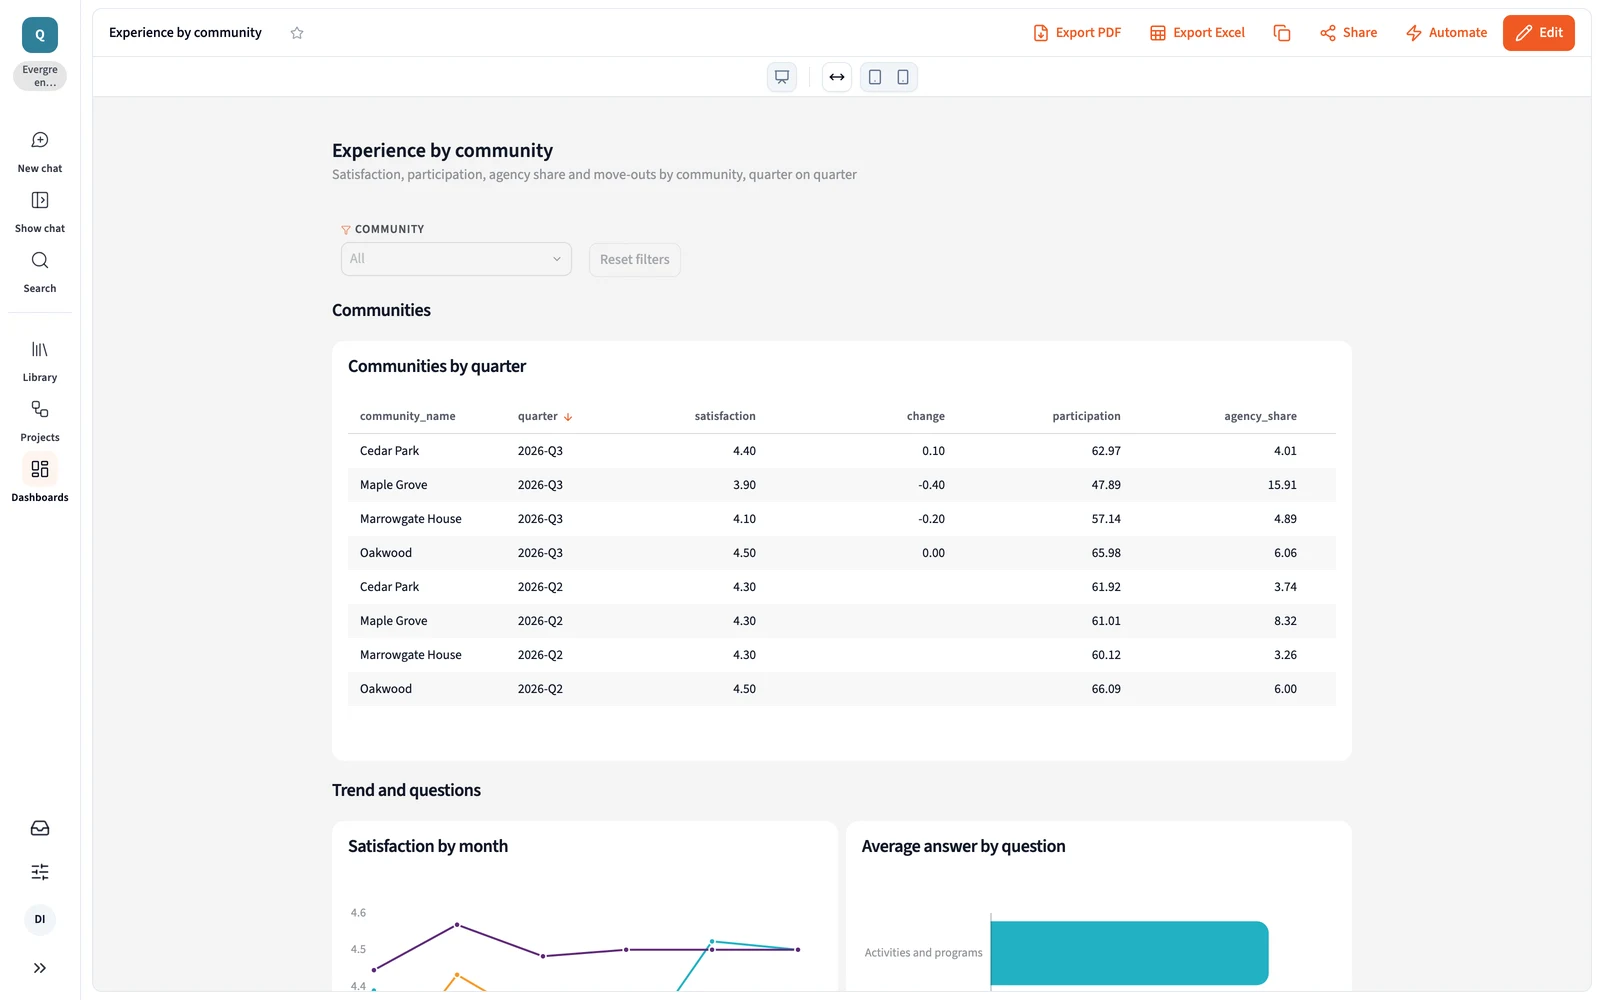
it.Querri for senior living resident experience. Querri it. See which communities and residents need you first.
Querri joins surveys, program participation, staffing and move-outs for every community, so your team helps the right community and the right resident first, before it shows up as a move-out. Connect the systems you already run and start in minutes.
One minute: which communities and residents need you first, the Resident experience blueprint, and what else your data answers.
One view of each community
Four systems. One row per community.
Scores live in the survey tool, participation in the engagement app, move-outs in the resident records and hours in scheduling. Querri joins them on the community, so the team reads feedback, participation and operations together, and every score means the same thing to everyone who reads it.
Resident and family surveysSurveySparrowZonka FeedbackExcel
Programs and engagementCCaremergeLLifeLoop
Resident recordsYYardiPPointClickCare
Scheduling and payrollWWorkdayAADPUUKG
Joined on the community
Maple Grove, from four systems
Metric
From
Value
Satisfaction, Q3 survey
Surveys
3.9 of 5, down 0.4
Residents at 2+ programs a week
Engagement app
48%, was 61%
Agency share of care hours
Scheduling and payroll
16%
Move-outs, Q3
Resident records
7
Move-out notices on file
Resident records
3
Sample data: Maple Grove, one of 4 communities at Evergreen Communities, a fictional operator.
Where resident experience teams start
Three questions your team answers every month
These are good first jobs, not the whole list. Once surveys, participation, resident records and staffing are in, the same definitions answer whatever you ask next.
Communities slipping on resident experience, and why.
“Which communities are slipping on resident experience, and what else changed there?”
How it's done today
Survey results in one export, attendance in the engagement app and move-outs in another report, compared community by community.
In Querri
Querri joins survey answers, program attendance, staffing and move-outs on the community. See which community's scores fell and what changed beside them: participation, agency hours or move-outs. A monitor flags any community that moved against its own history.
Sample data. Maple Grove's score fell where agency staff work the most hours, and 7 residents moved out in Q3.
New residents, settling in during their first 90 days.
“Are new residents settling in during their first 90 days?”
How it's done today
Move-in lists from the resident system and attendance from the engagement app, matched by hand, if at all.
In Querri
Querri joins each move-in date with program attendance and first survey answers, so every community sees how its new residents are settling in, week by week, and who hasn't found a program yet.
Sample data. 34 residents moved in during Q3. At Maple Grove, 4 of 6 come to fewer than two programs a week.
Residents pulling back, so the team reaches out first.
“Which residents are coming to fewer programs, had a care-level change or gave notice, so the team reaches out first?”
How it's done today
Life enrichment staff notice it in the room, and the rest depends on who remembers.
In Querri
Querri compares each resident's attendance with their own usual and puts care-level changes and move-out notices beside it. Each community gets a short list each week, by resident ID, under each person's own access.
Sample data: resident IDs only, no names. Usual is each resident's own average; now is the last four weeks.
Experience by community is one view. Ask next about family survey comments, dining scores or participation by program type. See how asking works →
More than a survey report
One set of definitions, for every report and every AI agent
The three jobs run on the same foundation as everything else in Querri. Define a number once, and every dashboard, community review and AI answer uses it.
The Library
Teach it once. It stays right.
Say what counts as satisfied, or what attending a program means, and every answer after that uses it. The executive director, the regional VP and your team read the same scores.
Click a community's score to see the survey answers and source tables behind it, with when they refreshed. When a question has two reasonable readings, Querri tells you, and when it can't answer, it says what's missing.
Executive directors and life enrichment leads ask in plain language, with no SQL and no analyst queue, under each person's own access. Build a dashboard by asking, send it as a workbook or slides, or ask from your AI assistant.
Monitors judge each community's scores and each resident's attendance against their own history and say which one moved, not just that the average did. Every night Querri works through your data and leaves what it found in your Inbox. Nothing changes without your OK.
How Querri compares with the other ways resident experience teams get these answers
Most resident experience teams already have survey reports, an engagement app, a consultant or data hire building dashboards, an AI assistant, or all of these. Here is where each fits, where it stops, and how Querri works alongside it.
Querri
Survey and engagement app reports
A BI build: a consultant or a data hire
An AI assistant you wire up yourself
Time to the first answer
Minutes on sample data from the blueprint, then on your own
Right away, for what each tool holds
Months: a hire or a consultant, pipelines, then dashboards
A first demo in a day
Surveys, participation, move-outs and staffing together
One Library, from 125+ connectors and uploads
Each scores its own data
Once each source is piped in and modeled
One connector at a time, joined in the chat
A question nobody built a report for
Ask it in plain words
An export to Excel
Joins the builder's queue
Ask it in plain words
What satisfied or participating means
Taught once; every answer, dashboard and AI agent uses it
Set in each tool, its own way
In the model the builder maintains
Per person or per project, in prompts and skill files
Where a number came from
Click any number to see its steps and source tables
Inside each tool's report
In the SQL, for whoever can read it
In the chat, worked out fresh each time
Watching for changes
Monitors on any KPI, each community and resident against their own history
Survey waves, read when they land
Through an alerting tool on top
Scheduled tasks someone writes and keeps working
Planning programs and the activity calendar
Not Querri's job. Keep it in your engagement app
Its core strength
Not its job
Only if someone builds it
How it works with Querri
Reads from all three, plus resident records and staffing
Keep them. Querri reads them beside move-outs and staffing
Querri connects to what's built and puts the answers in front of your team
Use both. Querri works inside the assistant, on the same definitions
The right call on its own when
Experience questions cross systems and need one definition
The question is about one survey wave or one program
A staffed data team already models survey and resident data
It's a one-off look at a spreadsheet
Approaches, not products: what each typically looks like in late 2026.
Senior living resident experience and engagement: common questions
How do senior living resident experience teams see which communities are slipping?
In Querri, a resident experience team joins survey answers, program attendance, staffing and move-outs on each community. Querri shows which community's scores fell and what changed beside them, such as participation, agency hours or move-outs, and a monitor flags any community that moved against its own history, so the team knows where to help first. How KPIs work →
How can a senior living operator tell whether new residents are settling in during their first 90 days?
Querri joins each move-in date from the resident records with program attendance and first survey answers. Every community sees how its new residents are settling in, week by week, and which residents haven't found a program yet, so life enrichment staff can make the introduction while it still matters. Dashboards →
Can Querri flag residents who are coming to fewer programs than usual?
Yes. Querri compares each resident's attendance with their own usual, and puts care-level changes and move-out notices beside it. Each community gets a short list each week by resident ID, under each person's own access. It tells the team who to see first; the conversation stays with your staff. Nightly insights and Monitors →
What does Querri do differently if our survey tool and engagement app already have reports?
Querri works alongside them, so keep both. Each reports well on its own data. Querri joins survey answers and attendance with move-outs and staffing from your other systems, so a falling score shows up next to what changed in that community, on the same definitions the executive director and the regional VP use. See every connector →
Can resident experience scores sit beside occupancy and staffing in Querri?
Yes. Because surveys, participation, census, move-outs and scheduling share one Library, you can connect the dots between a community's satisfaction, its staffing, its occupancy and its results. Leadership sees resident experience in the same picture as census and margin, not in a separate survey deck. The Library →
Is resident data safe in Querri?
Yes. Querri is SOC 2 Type II and ISO 27001:2022 certified and HIPAA compliant, and signs a BAA. Each organization has its own database and storage, encrypted with AES-256 at rest, and your data, prompts and results never train any model. Connectors are read-only, so Querri never changes a record in your resident system or engagement app. Row-level access rules apply before the AI sees anything, so each executive director sees only their own community. Visit the Trust Center →
What does a resident experience team connect first to get started with Querri?
To get started with Querri, connect your survey tool or upload its export, and add your engagement app and the resident records for move-ins and move-outs; staffing can follow. The Resident experience blueprint opens on sample data first, with every community's scores, new residents and residents to see this week, then runs on your own numbers. Sign up and open the blueprint →
Do I need a credit card to try Querri for senior living resident experience?
No. Querri is free to start, and no credit card is required. When you sign up, the blueprint opens on sample data with every community's scores beside participation and staffing, so you can see how it works before you connect your own surveys. Current plans are on the Querri pricing page. See pricing →
Playbooks
Three reports resident experience rebuilds by hand
Step by step, with sample data, for the person who builds the community review.
The Resident experience blueprint opens when you sign up. Connect your surveys, your engagement app and your resident system, and every community lands on one list. Then ask what you'd ask next.
 SurveySparrow
 Zonka Feedback
 Excel