What do damaged, lost and late deliveries cost in refunds and reships?
Join ShipStation, the carrier file, Gorgias and Shopify. See which deliveries went wrong, the refunds and replacements on those orders, and where the damage comes from.
Open QuerriWhat you'll need
Querri (Free trial) to tie exceptions to refunds and reships
ShipStation, a carrier file, Gorgias and Shopify: Step 1 says what each adds
Your exception and cost rules: so every exception is counted and priced the same way
Free resources
Start your free trial here →Sample data sets
Synthetic data for Curio Supply, a made-up home goods brand. Not real customer, retailer or marketplace data.
Need help?
If you have any questions, you can request a demo or email our team.
Before we begin
Refunds and reships show up in Shopify as part of doing business. Nobody adds up which came from a damaged box, a lost parcel or a late delivery, so the cost never gets a cause. The shipment is in ShipStation, the delivery in the carrier's file, the damage report in Gorgias and the refund in Shopify.
This playbook flags every late, lost or damaged delivery on the month's store shipments, ties refunds and reships to them, and finds the warehouse, carrier service and product the damage concentrates in.
How it works:
- • Connect ShipStation, Gorgias and Shopify; upload the carrier file
- • Flag every late, lost or damaged delivery
- • Tie refunds and reships to those orders
- • Find the warehouse, carrier and SKU behind the cost
- • Build the monthly delivery exception view
Follow the steps
Connect ShipStation, Gorgias and Shopify; upload the carrier file
Four sources, one project:
- •
ShipStation: shipments by warehouse, carrier and service.
- •
Carrier delivery file (upload): the delivered date and late or lost status for each tracking number.
- •
Gorgias: tickets tagged damaged, which is how damage is known.
- •
Shopify: refunds and reship orders, each reship linked to its original order.
ShipStation, Gorgias and Shopify connect directly and sync on a schedule. The carrier file comes in as an upload; upload next month's over the old one and every view rebuilds.
Tip: Pull six months before the month you're reviewing, so this month's damage can be compared with a usual month.
-
 ShipStation shipments
-
 Carrier deliveries
-
 Gorgias tickets
-
 Shopify orders
 One project
Flag every late, lost or damaged delivery
Start by flagging what went wrong, once per order:
"Of the store orders we shipped in October, which were delivered late, lost, or reported damaged?"
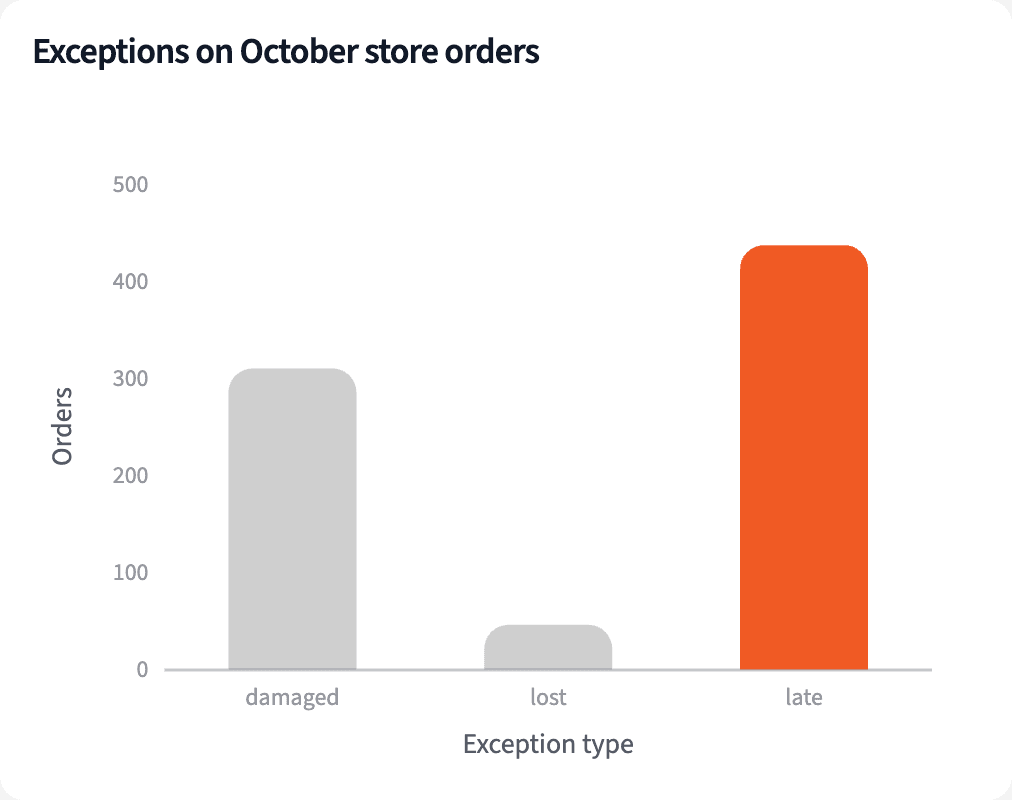
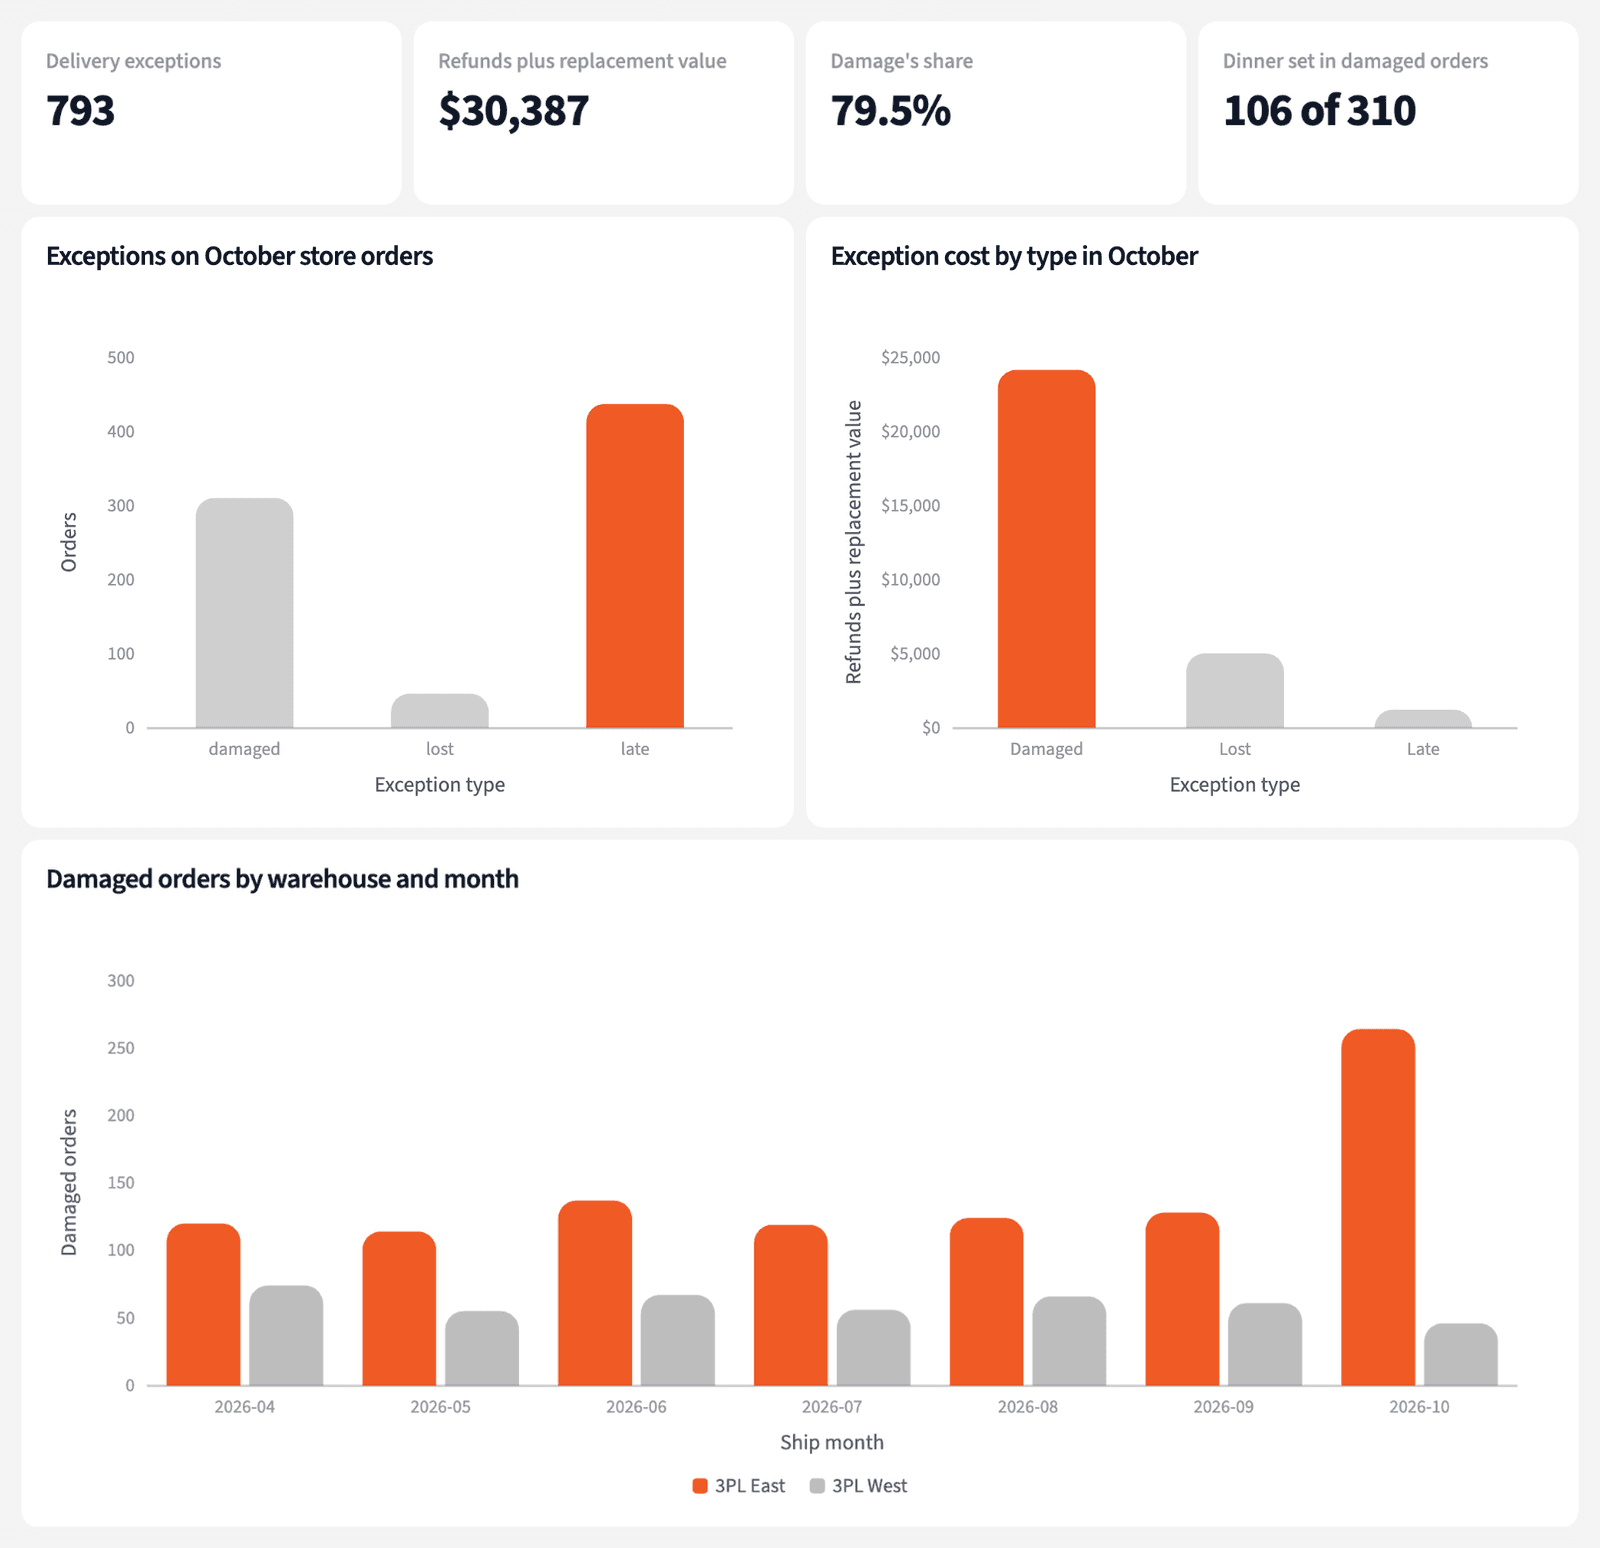
793 of the 18,190 store orders shipped in October had a recorded exception: 437 late, 310 damaged and 46 lost. These are recorded exceptions on October shipments, as of the export.
| Exception | Orders |
|---|---|
| Late | 437 |
| Damaged | 310 |
| Lost | 46 |
| All exceptions | 793 |
Store orders shipped in October 2026, by exception. Each order counted once: damaged, then lost, then late.
Tie refunds and reships to those orders
Then tie each exception to its refunds and reships:
"What refunds and reships are on those exception orders? Leave out refunds on orders with no exception."
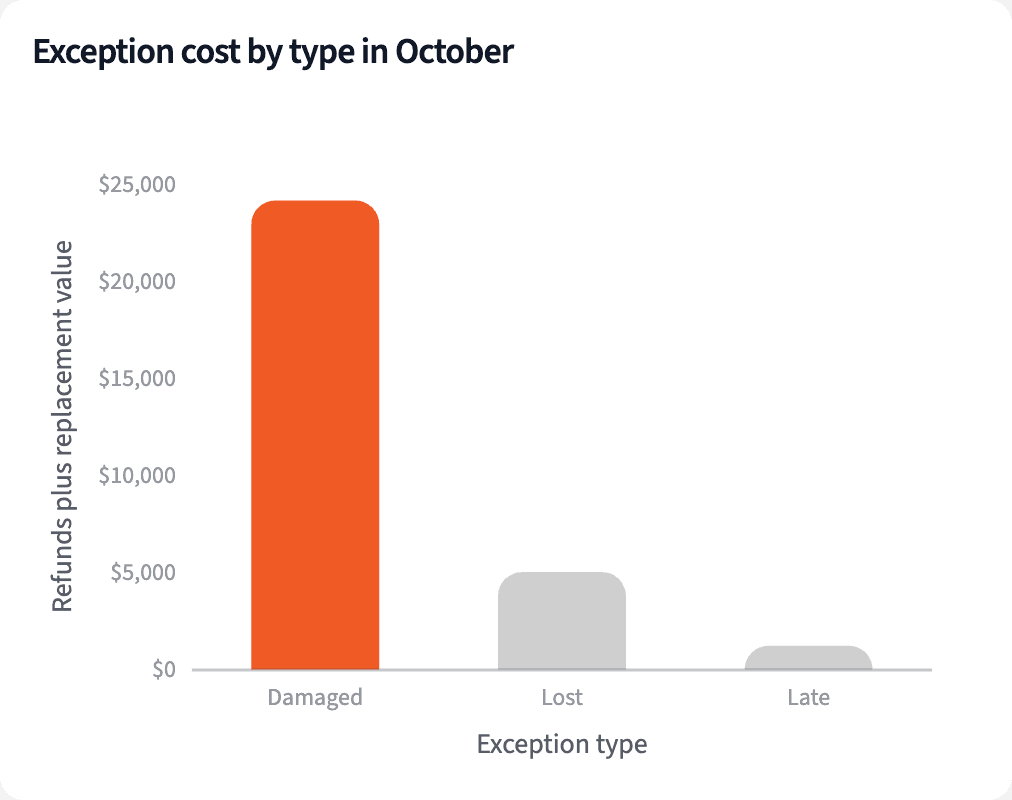
The 793 orders carry $30,386.63 in refunds and replacement value: $17,137.63 refunded and $13,249.00 reshipped. Damaged orders account for 79.5% of it.
| Exception | Orders | Refunds plus replacement value |
|---|---|---|
| Damaged | 310 | $24,151.89 |
| Lost | 46 | $5,015.12 |
| Late | 437 | $1,219.62 |
| All exceptions | 793 | $30,386.63 |
Refunds and replacement value (reships at selling price) on October 2026 exception orders.
Find the warehouse, carrier and SKU behind the cost
Find where the damage concentrates:
"Where does the damage come from: which warehouse, which carrier service, which product?"
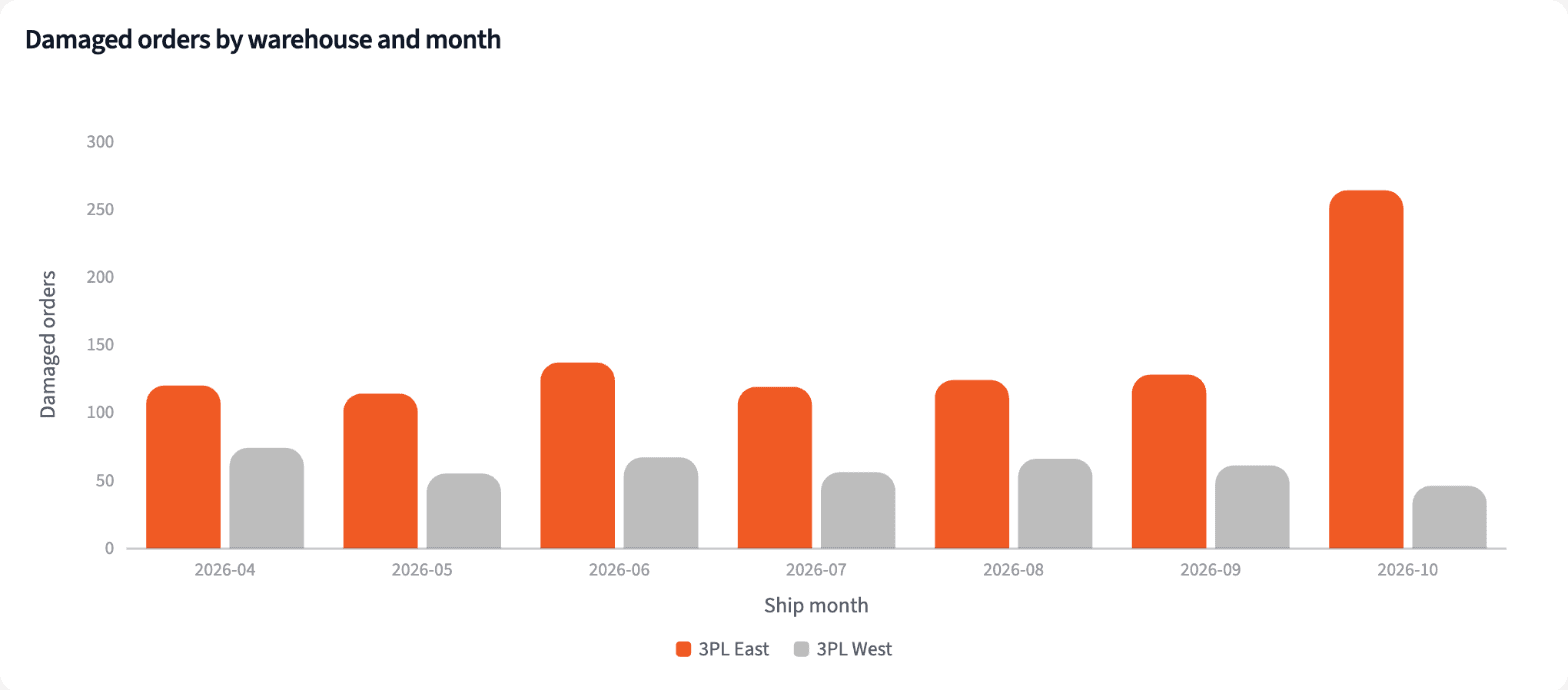
3PL East had 264 damaged orders in October, against about 124 a month before. The Curio Stoneware Dinner Set, 16 piece, was in 106 of the 310 damaged orders; 99 shipped from East.
| Carrier service | October | April to September |
|---|---|---|
| UPS 2nd Day Air | 25.0 | 9.8 |
| FedEx Home Delivery | 20.6 | 12.0 |
| UPS Ground | 20.4 | 12.9 |
| USPS Ground Advantage | 7.9 | 6.9 |
Damaged deliveries per 1,000 shipments by carrier service, October 2026 against April to September 2026.
Build the monthly delivery exception view
Four numbers for the monthly review, and where to start.
The narrative Querri writes:
Damage was 310 of October's 793 exceptions but 79.5% of the refunds and replacement value on them, and one dinner set was in a third of the damaged orders.
What you can create or export:
- The table, to Excel, CSV or Google Sheets
- A live dashboard that refreshes with each sync and upload
- A presentation for the meeting, to PDF or PowerPoint
| Item | Orders | Next step |
|---|---|---|
| Damaged orders containing the dinner set | 106 | Review the packaging |
| Damaged orders from 3PL East | 264 | Review with 3PL East |
| Lost parcels | 46 | Check carrier claims |
Where to start, October 2026 exceptions.
Take one product and one warehouse to the packaging conversation, with a dollar figure attached.
Try it on your own dataTips for an exception review people trust
Count by dollars as well as orders
The most common exception is not always the costly one. Late deliveries were most of the count here and the smallest share of refunds and replacements.
Keep other refunds apart
Refunds on orders with no recorded exception may be ordinary returns or exceptions nobody logged. Mixing them in would make every month look like a damage problem.
Teach Querri your rules once. Every answer after that follows them.
What counts as an exception, which refunds and reships count against it, how refunds with no exception are handled: say each rule once and Querri applies it to every question on that data.
Show me how
Say it in chat
Settle a rule in conversation and the Librarian records it as a fact under Facts & Rules, attached to the table it governs. Every later question on that data applies it, whoever asks, and every view built afterwards carries it.
"The cost of a delivery exception is refunds on the order plus the selling price of any reship of it. Save that as a rule for the Shopify orders table."
Or bring the document that already says it
Upload your returns and service recovery policy like any other file. Querri files a From a document card in the Inbox with the statements it found, each with its page and exact words; tick the ones to keep and they become facts. The rules this playbook depends on:
- Exception: late, lost or damaged, one per order
- Order of precedence: damaged, then lost, then late
- Damaged: a Gorgias ticket tagged damaged, matched to the order
- Reship: a $0 order tagged reship, linked to the original order
- Cost: refunds plus replacement merchandise value at selling price
- Refunds on orders with no exception are returns, left out
"Read our service recovery policy and propose the rules it states about reships and refunds. I'll review them in the Inbox."
Where the rules reach
A rule is attached to the data, not to one person's chat, so it follows the data everywhere:
- • Every question asked in chat, by anyone on the customer experience team
- • Every view the Librarian builds on that data
- • Every step of a project, including the code it writes
- • Dashboards and scheduled runs, each time they refresh
- • Claude and ChatGPT, when they ask Querri
You stay in control
Every rule is listed under Facts & Rules next to the data it governs, where you can edit or remove it. Rules from a document wait for your tick in the Inbox, and a Worth remembering card is how Querri offers one it noticed itself. Workspaces and roles decide who can change what. Company-wide rules go in Settings → Customize; the Library is where the rest lives.
The payoff in the review
The review starts with one product, one warehouse and a dollar figure. Changing how a reship is valued is a sentence.
Frequently asked questions
What does the cost include?
Why leave out returns?
How is damage known?
Are late deliveries complete?
Why is damage's share 79.5%?
Does the dinner set cause the damage?
How is this different from Orders to tickets?
How often should this run?
Other popular resources
Playbook
Orders to tickets
Which orders are turning into support tickets this week?
Playbook
Late shipments and escalations
Which orders are late, canceled or escalated this week?
Demo
Request a walkthrough
See Querri in action with your own data.
Pricing
Compare plans
Find the right plan for individuals, teams, or enterprise.