Every deal, from CRM to billing to product,on numbers nobody argues about.
Querri joins your CRM with billing, product usage and call data under definitions RevOps owns once. Know which Commit deals are in doubt, follow every win to billing and usage, and spot the customers ready to expand. Every number says where it came from.
One minute: Commit in doubt, every won deal followed into usage, and expansion signals from the product.
One view of every deal
Four sources. One set of numbers, past closed-won.
Deals and their history live in the CRM, subscriptions in billing, usage in the warehouse, and targets and call logs in spreadsheets and exports. Querri joins them by account and checks for gaps and duplicates before it queries, so the forecast call and Finance start from the same numbers.
Deals and their historySalesforceHubSpot
BillingStripe
Product usageSnowflakeBigQueryAmplitude
Targets and call logsGoogle SheetsExcel
Defined once
New customers won July 2025 to June 2026
Segment
Won deals
Days to bill
Seats in use
Mid-Market
67
11
60%
Enterprise
7
19
45%
Sample data: Quillcrest, a fictional software company. Every won deal is billing; days to bill is the median from close to the first subscription, and seats in use covers the last four weeks for the 40 new customers with usage data.
Where revenue operations teams start
Three questions that cross the CRM's edge
These are good first jobs, not the whole list. Once the CRM, billing and product usage are in, the same definitions answer whatever you ask next.
Commit you can defend, before the call.
“Which Commit deals are in doubt going into Monday's call, and will the number we call match what Finance books?”
How it's done today
Close dates inspected in the CRM, last quarter's pushed Commits pulled by hand, and a forecast score nobody can query.
In Querri
Querri joins opportunity history, the call log and targets, and tests your doubt rules (pushed, stalled, quiet) against your own closed deals. Coverage shows with and without the doubtful Commit, and bookings use the same definition Finance does.
Sample data. Across six quarters, deals never pushed closed at 42%, pushed once 20%, pushed twice or more 6%. Without its doubtful Commit, Enterprise ends $68K short of target.
Every won deal, live, billed and used.
“Did the deals we closed go live, start billing and get used?”
How it's done today
A one-way sync from the CRM into billing, a monthly reconciliation in a spreadsheet, and usage in someone else's dashboard.
In Querri
Querri joins closed-won deals to billing and product usage by account, so each win shows its days to bill and seats in use, by rep and lead source. Define live and used once, and a monitor flags new customers who stall.
Sample data, as Querri answered it: 11 new customers won July 2025 to June 2026 use less than 40% of their licensed seats, $763K of bookings, Linden Therapy ($190K) the largest. 122 of the 162 won accounts have no usage data yet, and Querri says so.
Expansion signals from the product.
“Which customers have outgrown what they bought, and who owns them?”
How it's done today
A request to the data team for a list, or a usage dashboard nobody joins to ARR and owners.
In Querri
Querri puts seat use from the product beside ARR from billing and the owner and renewal date from the CRM, and a monitor flags each account that crosses 90% of its seats.
Sample data: seven customers with $565K of ARR use 90% or more of their licensed seats, over the last four weeks.
Commit is one question. Ask next about PQL to SQO conversion, win rate by lead source or the gap to go-live. See how asking works →
More than a forecast tool
One set of revenue definitions, for every report and every AI agent
The three jobs run on the same foundation as everything else in Querri. Define a number once, and every dashboard, spreadsheet export, board deck and AI answer uses it.
The Library
Teach it once. It stays right.
Say what counts as Commit, a booking, live or used, and every answer after that uses it. The forecast call, Finance's ARR and the board deck finally show one number.
Click coverage without the doubtful deals to see the opportunity history, calls and targets behind it, and when each refreshed. Before it queries, Querri checks the data for gaps and duplicates, and when it can't answer, it says what's missing.
Ask in plain language. Build a dashboard by asking, or from a screenshot of the one you use now. Send the KPI pack to Excel or slides, or ask from Claude, under each person's own access.
Monitors judge each rep's Commit, each new customer's seat use and each account's growth against its own history, and say which one moved, not just that the total did. Every night Querri works through your data and leaves what it found in your Inbox. Nothing changes without your OK.
Four steps from sign-up to your own pipeline and funnel desk. Add billing and product usage to follow each deal past closed-won.
1
Sign up free
No credit card. Your own workspace is ready in about a minute.
2
Install Pipeline and Funnel
Open Blueprints, pick the card and install it. Sample data comes with it, so every page has numbers right away.
Pipeline and Funnel28 pieces
3
Keep the sample, or connect your data
Connect Salesforce or HubSpot and add your target sheet, then billing and product usage. An agent sets up each connection with you.
4
Open your Pipeline and funnel desk
Pipeline by rep, stage conversion, MQL cohorts and the board KPIs on one site.
Open your Pipeline and funnel desk
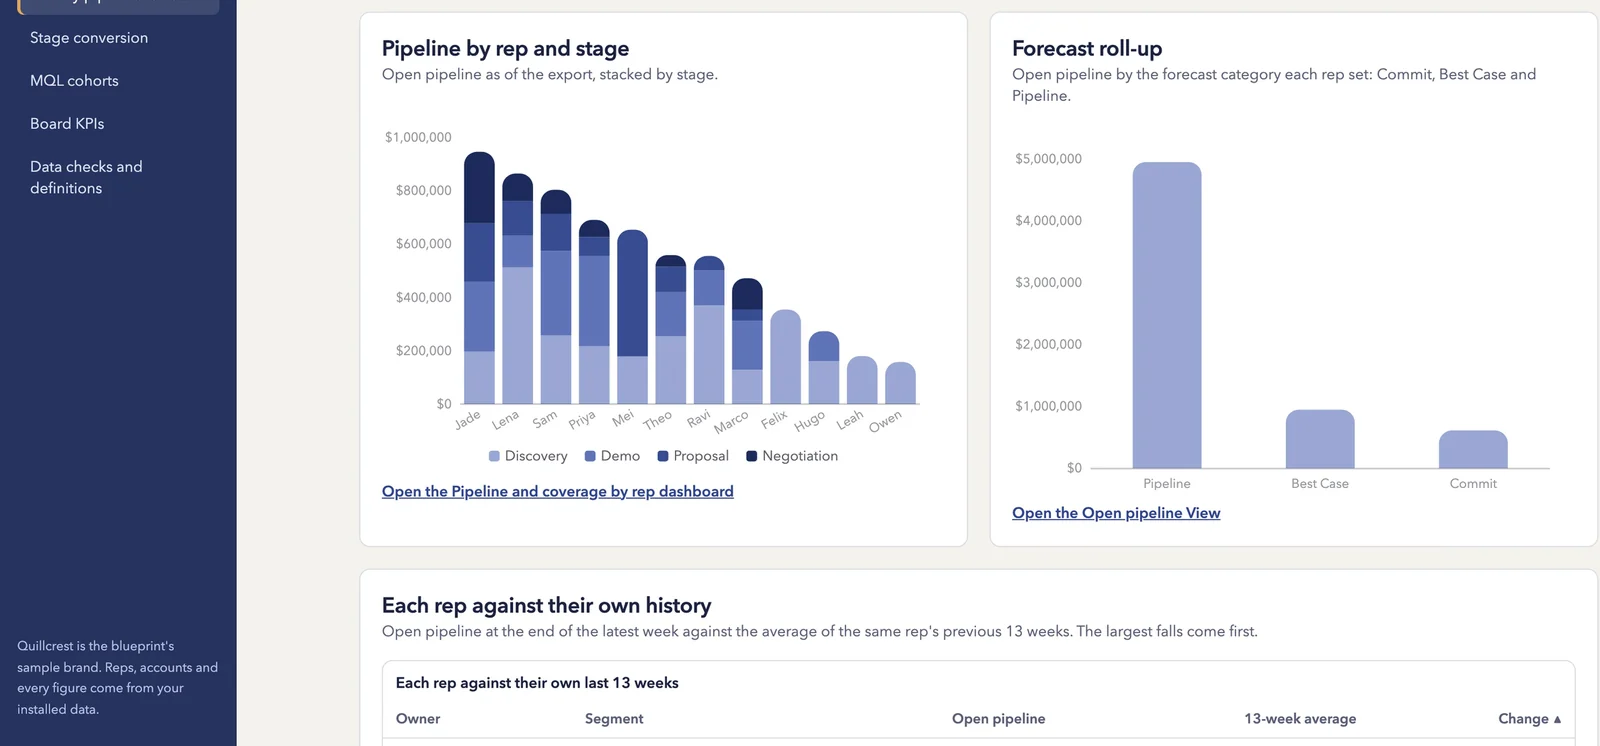
Open pipeline by rep and stage, on the Pipeline and funnel desk (Quillcrest sample data).
Everything that installs
4 Site pages
Pipeline and funnel desk
Weekly pipeline review
Stage conversion
MQL cohorts
Board KPIs
4 Dashboards
Pipeline and coverage by rep
Stage conversion
MQL cohorts
Board KPIs
4 Views
Open pipeline
Pipeline coverage by quarter
Stage conversion by week
MQL cohorts by month
3 KPIs
Pipeline coverage
Stage conversion rate
Win rate
4 Skill and monitors
Pipeline review method
Rep pipeline watch
Stage conversion watch
MQLs by source watch
Coverage is the pipeline open going into a quarter, with a close date inside it, divided by that quarter's new-business target. Monitors compare each rep and segment with its own history; they don't forecast the quarter.
How Querri compares with the other ways RevOps teams get these numbers
Most revenue operations teams already have CRM reports and spreadsheets, a data team's queue, an AI assistant, or all three. Here is where each fits, where it stops, and how Querri works alongside it.
Querri
CRM reports and forecasting tools
A warehouse and a data team
An AI assistant you wire up yourself
Time to the first answer
Minutes on sample data from the blueprint, then on your own
Already there for what lives in the CRM
Months: pipelines, models, then dashboards
A first demo in a day
CRM, billing, usage and calls together
One Library, from 125+ connectors and file uploads
Stops at the CRM's edge; billing and usage need extra tooling
Once each source is piped in and modeled
One connector at a time, joined in the chat
A question nobody built a report for
Ask it in plain words
A new report, or a new export, every time
Joins the data team's queue
Ask it in plain words
What Commit, a booking or used means
Taught once; every answer, dashboard and AI agent uses it
In each report's filters and each tool's score, so two can disagree
In a semantic layer the data team maintains
Per person or per project, in prompts and skill files
Where a number came from
Click any number to see its source tables and refresh time
The report's filters, inside the CRM
In the SQL, for whoever can read it
In the chat, worked out fresh each time
Watching for changes
Monitors on any KPI, each rep against their own history
Report subscriptions and dashboards someone checks
Through a BI or alerting tool on top
Scheduled tasks someone writes and keeps working
Running the forecast itself: calls, commits, deal updates
Not Querri's job. Keep your forecasting tool
Its core strength
Not its job
Only if someone builds it
How it works with Querri
Reads from all three, plus billing and usage
Keep it for the call. Querri adds billing, usage and history around it
Querri connects to it and puts the answers in front of RevOps
Use both. Querri works inside the assistant, on the same definitions
The right call on its own when
Your numbers cross the CRM, billing and the product
Every number you report lives inside the CRM
A staffed data team already models pipeline data and has time for RevOps
It's a one-off look at a spreadsheet
Approaches, not products: what each typically looks like in late 2026.
Revenue operations analytics for SaaS: common questions
What does Querri do for RevOps if our CRM already reports on pipeline?
Querri works alongside your CRM's reports and adds what sits outside the CRM: subscriptions from billing, product usage from the warehouse, call logs and targets, joined by account. That answers questions the CRM can't, such as whether a won deal went live and is being used. Commit, bookings and coverage are defined once, so the forecast call, Finance and the board deck use the same numbers. See every connector →
Do we still need a forecasting tool if we use Querri for revenue operations?
Keep your forecasting tool or your CRM's forecasting for running the call, updating deals and rolling up Commit. Querri adds what those tools don't: it tests your own doubt rules, such as pushed close dates or no calls in 14 days, against your own closed deals, shows coverage with and without the doubtful Commit, and ties the call to the bookings definition Finance uses. KPIs →
Can Querri show whether closed-won deals went live, started billing and got used?
Yes. Querri joins closed-won deals from Salesforce or HubSpot to subscriptions in billing and seat use in your product data, by account. Each win shows its days from close to billing and the share of seats in use, by rep and lead source, and a monitor flags new customers who stall. You define what counts as live and used once. Views →
How can a revenue operations team find expansion signals in product usage?
Connect product usage from your warehouse or an export next to billing and the CRM. Querri lists the accounts using most of their licensed seats beside their ARR, owner and renewal date, and a monitor flags each account that crosses the line you set, such as 90% of seats. The account team gets a list without a request to the data team. Nightly insights and Monitors →
Why use Querri for pipeline numbers instead of a general AI assistant?
Querri keeps your definitions, so pipeline and coverage mean the same in every answer, whoever asks. An answer becomes a saved report that re-runs the same way, and every number shows its query, so the weekly pipeline meeting and the board deck show one number. You can use both: Querri works inside Claude through MCP, on the same definitions. Querri inside your AI assistant →
Does Querri copy our CRM data, and where is it stored?
Yes. Querri syncs a copy of your CRM data by default, and each organization has its own database and storage, encrypted with AES-256 at rest. Connectors are read-only, an agent sets up each connection and never sees your passwords, and your data, prompts and results never train any model. The AI runs in the United States, and Querri is SOC 2 Type II, HIPAA and ISO 27001:2022 certified. Visit the Trust Center →
Which systems does a RevOps team connect first to get started with Querri?
To get started with Querri, a revenue operations team connects its CRM, Salesforce or HubSpot, adds the target sheet, then connects billing such as Stripe and product usage from the warehouse. An agent sets up each connection with you. The Pipeline and Funnel blueprint opens on sample data first, with pipeline and coverage by rep, stage conversion and the board KPIs, then runs on your own data. Sign up and open the blueprint →
How much does Querri cost for a SaaS revenue operations team?
Querri is free to start, and no credit card is required, so a revenue operations team can try it before any budget conversation. When you sign up, the Pipeline and Funnel blueprint opens on sample data with pipeline and coverage by rep, ready before you connect your CRM. Current plans and prices are on the Querri pricing page. See pricing →
Playbooks
Three questions RevOps answers across systems
Step by step, with sample data, for the person who builds the report.
Playbook coming
Commit in doubt before Monday's pipeline meeting
Which Commit deals are in doubt, and what's coverage without them?
Playbook coming
Closed-won to live, billed and used
Did the deals we closed go live, start billing and get used?
Playbook coming
Expansion signals from product usage
Which customers have outgrown what they bought, and who owns them?
From the blog
For the COO and CRO
What to do once you have the answer.
Article coming
Which Commit deals are really in doubt
Test your forecast against your own history.
Article coming
Closed-won isn't the finish line: booked, billed and used
Follow every deal into billing and the product.
Article coming
Expansion signals hiding in product usage
Find the customers who have outgrown their plan.
Start with this week's Commit, and follow every deal past closed-won.
The pipeline and funnel blueprint opens when you sign up. Connect your CRM and target sheet, add billing and usage, and ask which Commit deals are in doubt before the call.
 Salesforce
 HubSpot
 Stripe
 Snowflake
 BigQuery
 Amplitude
 Google Sheets
 Excel