Which Commit deals are in doubt before Monday's pipeline meeting?
Join your Salesforce opportunities, close-date history, Gong call log and targets in Querri. Flag the Commit deals worth a second look, check which warning signs your own history backs, and see coverage with and without them.
Open QuerriWhat you'll need
Querri (Free trial) to join the exports and build the view
Salesforce, field history, Gong and targets exports: Step 1 says what each adds
Your doubt rules: so every deal is flagged the same way
Free resources
Start your free trial here →Sample data sets
Synthetic data for a made-up software company. Not real customer data.
Need help?
If you have any questions, you can request a demo or email our team.
Before we begin
It's the Monday pipeline meeting with two weeks left in the quarter. Commit says $1.43M, and everyone wants to know how much of it will land. The evidence is scattered. Close-date changes sit in an audit table, calls live in another tool, and the coverage number on the dashboard counts every Commit deal the same way.
This playbook flags the Commit deals worth a second look, checks each warning sign against your own closed deals, and shows coverage with and without them.
How it works:
- • Upload CRM, close-date history, calls and targets
- • Build the pipeline as of the morning refresh
- • Flag the Commit deals worth a second look
- • Check which warning signs history backs
- • Show coverage with and without them
Follow the steps
Upload Salesforce, field history, Gong and targets
Four exports, one project:
- •
Salesforce (or HubSpot): open and closed deals, with stage, forecast category and won or lost.
- •
Opportunity Field History: every close-date and stage change, with its date.
- •
Gong (or your CRM's activity log): a dated log of calls on each deal.
- •
Targets: what each segment needs to close this quarter.
Add a small sheet with your doubt rules. Prefer live data? Querri connects to Salesforce and your spreadsheets directly.
Tip: Export the field history for closed deals too, not just open ones. Step 4 needs it.
-
 Salesforce
-
 Field history
- Gong calls
- Targets
 One project
Build the pipeline going into the meeting
Start from the pipeline as it stood at the morning refresh. Querri first removes the duplicate rows that audit exports often carry:
"Remove the duplicate rows from the field history, then show the open pipeline closing this quarter by rep, segment and forecast category, with the refresh time on it."
62 open deals close this quarter, $3.57M in all. Commit is $1.43M of it, across 24 deals.
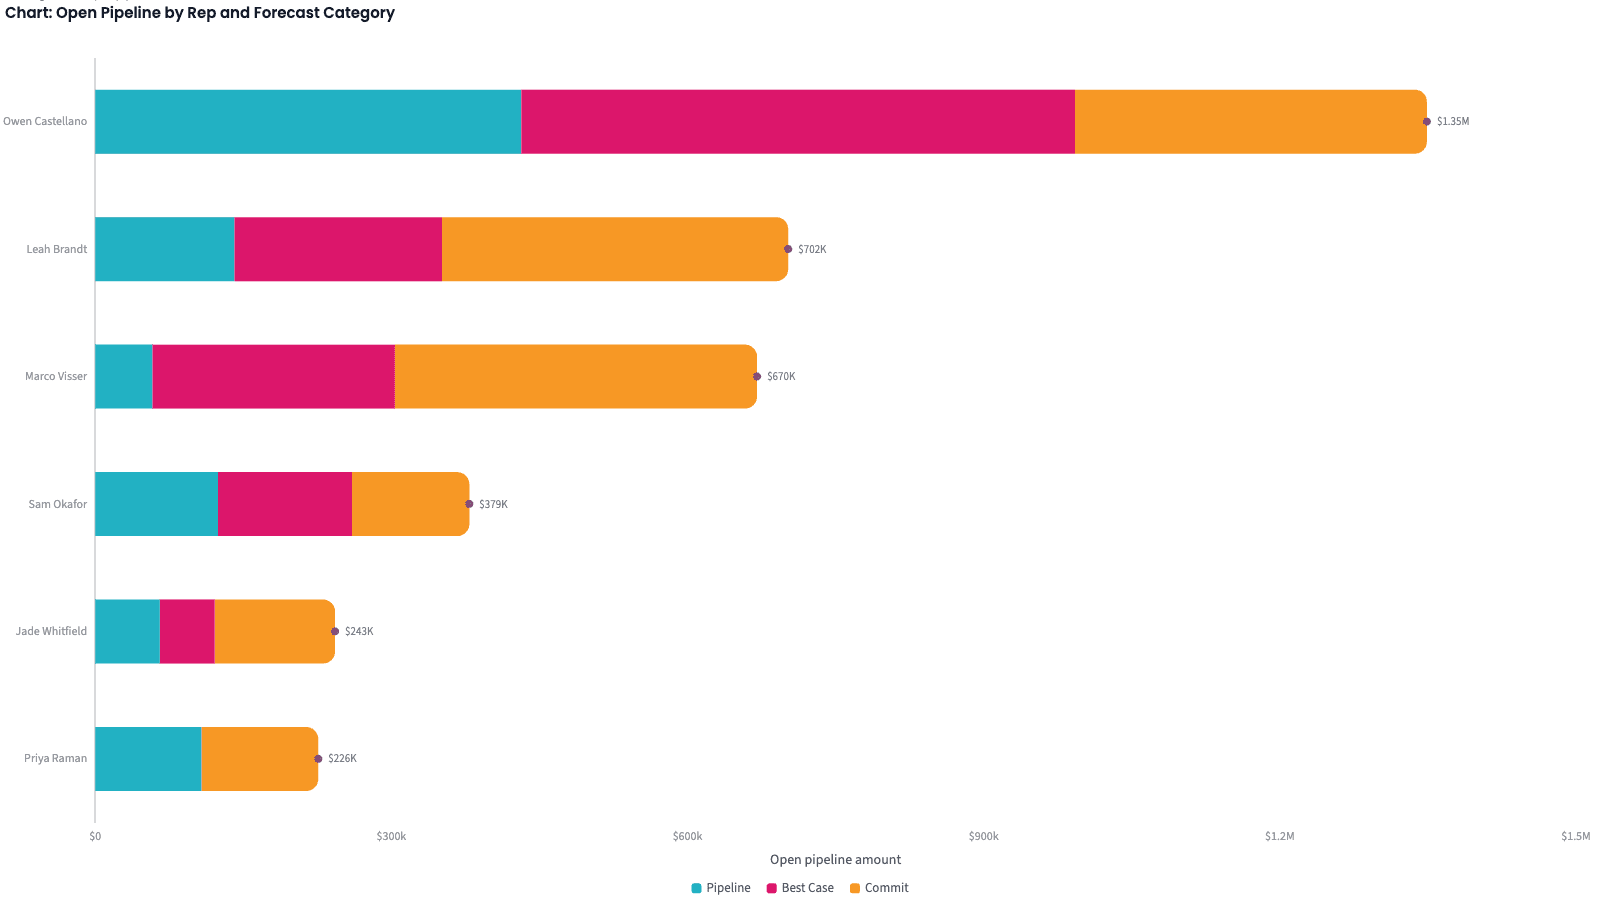
| Forecast category | Deals | Amount | Share |
|---|---|---|---|
| Commit | 24 | $1,434,000 | 40% |
| Best Case | 18 | $1,207,500 | 34% |
| Pipeline | 20 | $928,000 | 26% |
| Total | 62 | $3,569,500 |
Open pipeline closing this quarter, by forecast category, as of Monday 07:00.
Flag the Commit deals in doubt
Three warning signs, each from a different source. Any one flags a deal for review, not for a cut:
"For every Commit deal closing this quarter, flag three signals: pushed (the close date moved later since the quarter began), stalled (longer in its stage than three quarters of the deals that went on to win), and quiet (no call in 14 days). Any signal means in doubt."
15 of the 24 Commit deals carry a flag, $928,500 in all. Most were pushed or quiet; only 2 are stalled. Quiet means no recorded call.
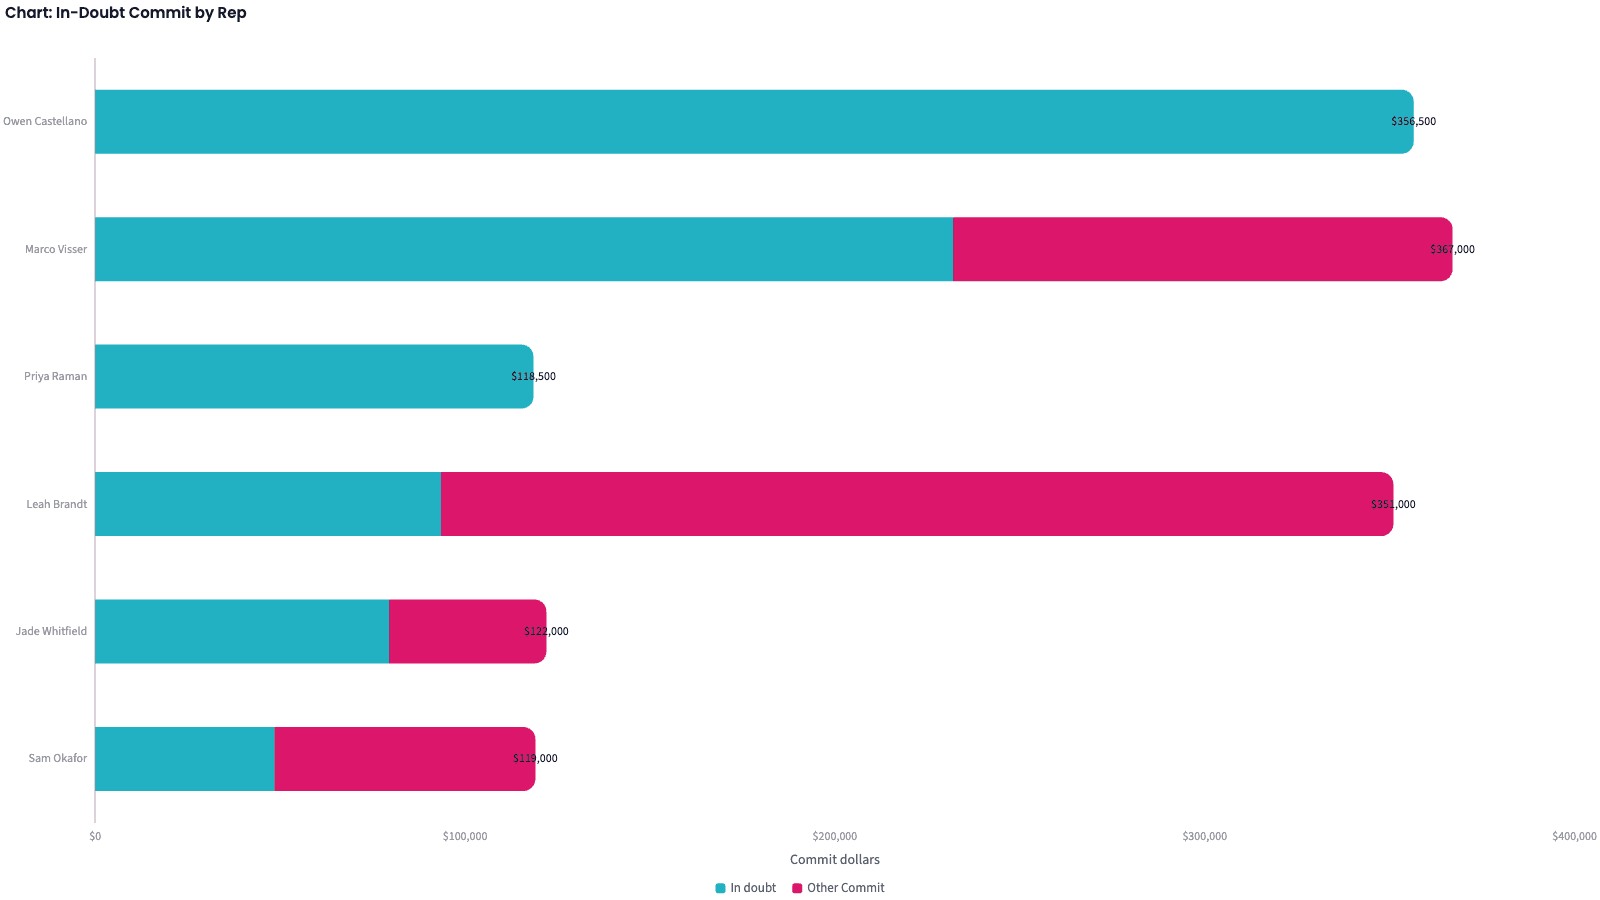
| Rep | Commit | Flagged | Amount flagged |
|---|---|---|---|
| Owen Castellano | 3 | 3 | $356,500 |
| Marco Visser | 5 | 3 | $232,000 |
| Priya Raman | 4 | 4 | $118,500 |
| Leah Brandt | 4 | 1 | $93,500 |
| Jade Whitfield | 4 | 2 | $79,500 |
| Sam Okafor | 4 | 2 | $48,500 |
Flagged Commit deals, by rep.
Check which signal history backs
Before you raise a flag on Monday, check what it meant on deals that already closed:
"Across every closed deal, show the win rate for deals never pushed, pushed once, and pushed twice or more; for stalled versus not stalled; and for quiet versus not quiet by segment."
Counting pushes over each deal's life, 42% of past deals never pushed went on to win; of those pushed twice or more, 6% did. Stalled deals won about as often as the rest, so that flag carries little weight.
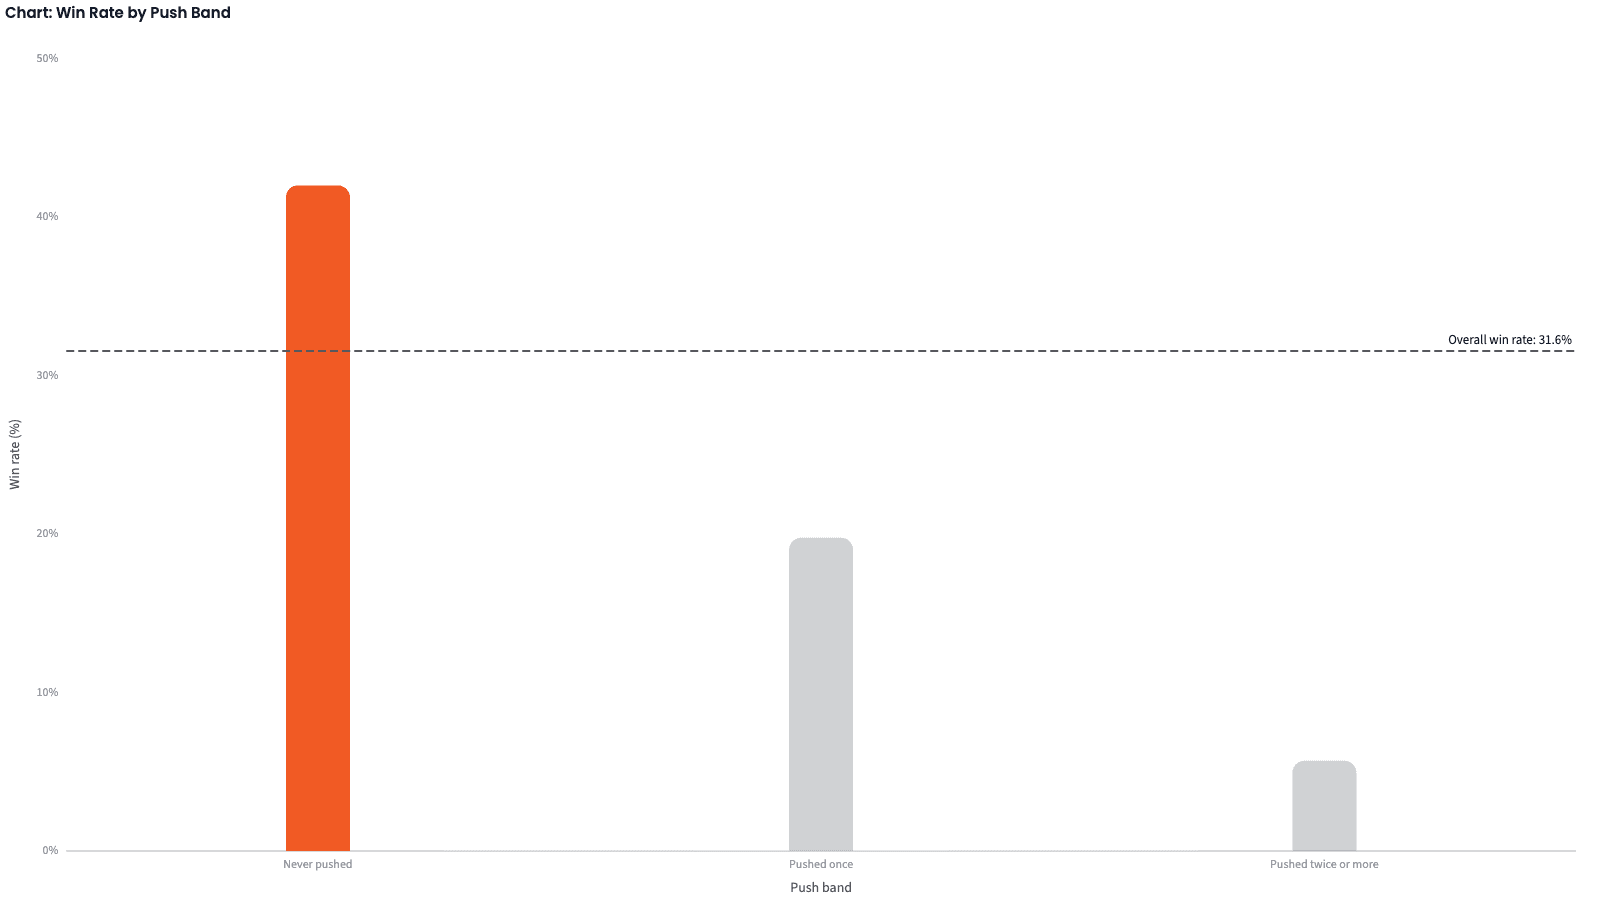
| Signal | Deals | Win rate |
|---|---|---|
| Never pushed | 610 | 42.0% |
| Pushed once | 228 | 19.7% |
| Pushed twice or more | 141 | 5.7% |
| Quiet, Enterprise | 190 | 11.6% (49.0% if not quiet) |
| Stalled | 238 | 31.9% (31.4% if not) |
Share of 979 closed deals that won, by signal.
Produce the Monday view
Four numbers for the meeting, and the deals to review, by rep.
The narrative Querri writes:
Two thirds of Commit carries a warning sign, and without those deals Enterprise coverage drops below 1x.
What you can create or export:
- The deal-level table, to Excel, CSV or Google Sheets
- A live dashboard that refreshes on a schedule
- A presentation, to PDF or PowerPoint
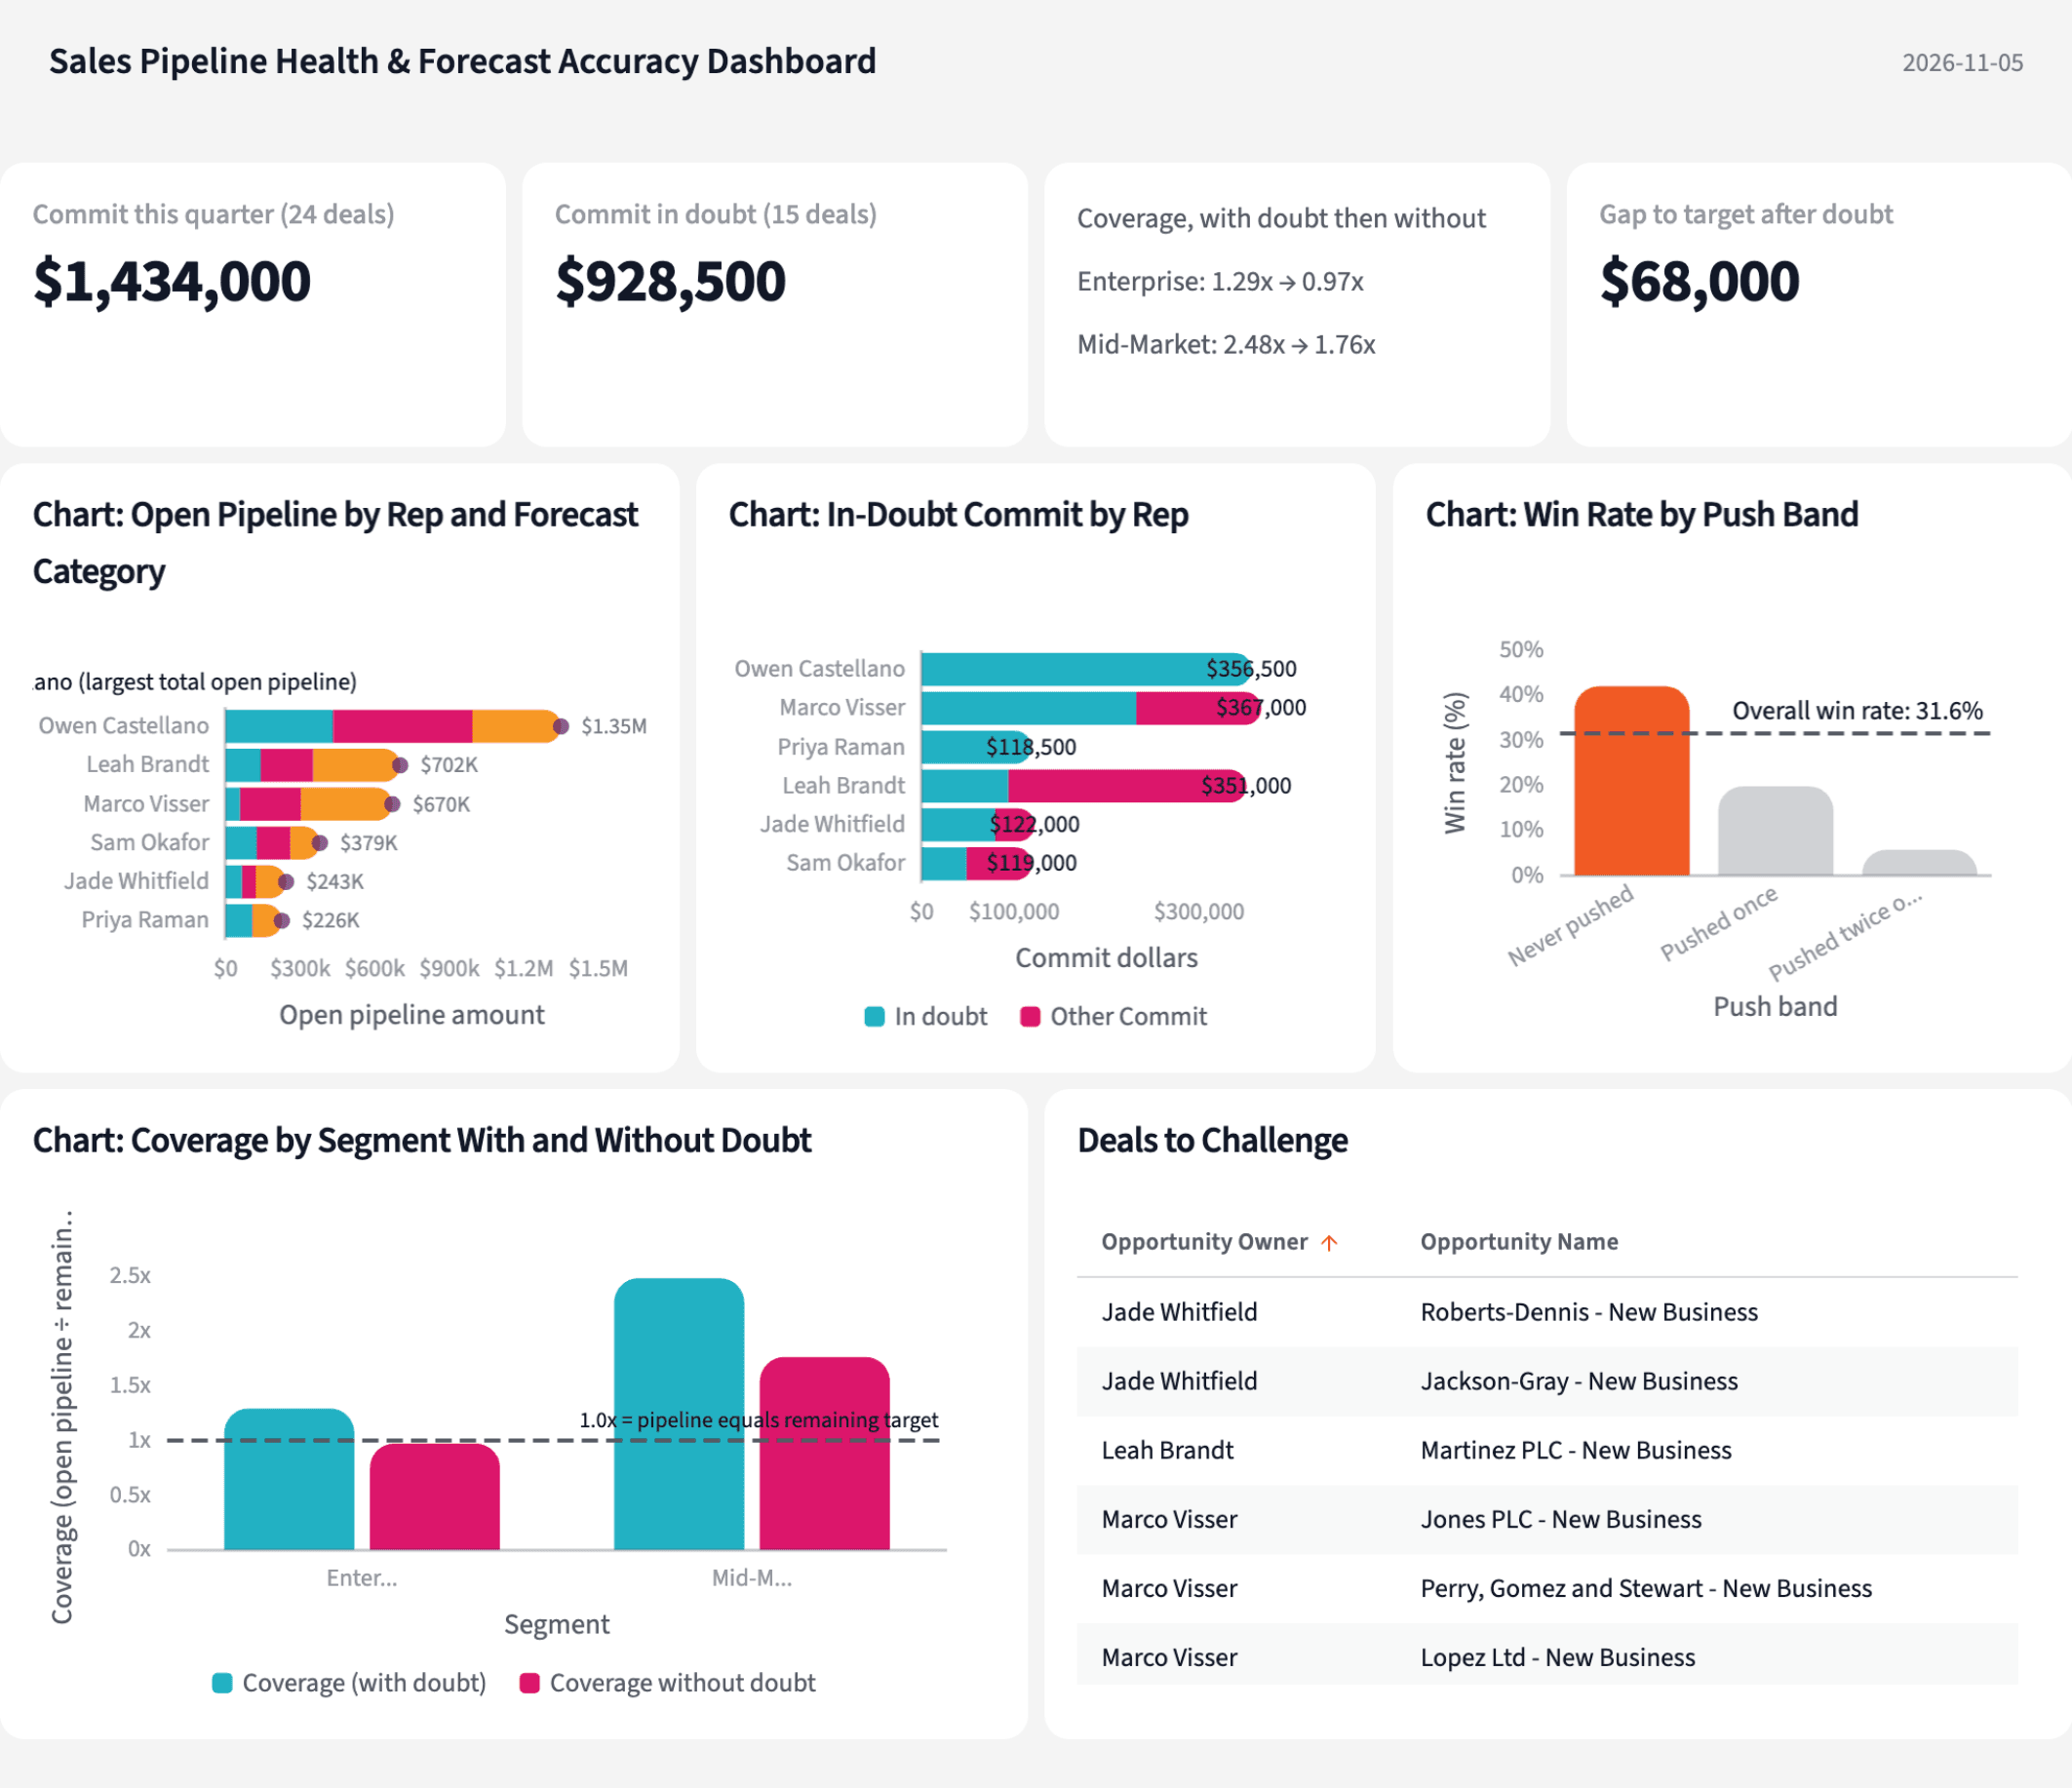
| Segment | Coverage | Without flagged |
|---|---|---|
| Enterprise | 1.29x | 0.97x |
| Mid-Market | 2.48x | 1.76x |
| Total | 1.46x | 1.08x |
Coverage by segment, with and without the flagged Commit deals.
Walk into Monday's meeting knowing which deals to talk through.
Try it on your own dataTips for a pipeline meeting people trust
Freeze the refresh time
Put the timestamp on the view. A pipeline that changes while the meeting is running is one nobody can be held to.
Use the audit trail, not the current date
The opportunity report shows where a close date is now. The field history shows how many times it moved, and in this sample that count separated wins from losses sharply.
Teach Querri your rules once. Every answer after that follows them.
What counts as pushed, how the stalled line is set, how many quiet days is too many: say each rule once and Querri applies it to every question on that data.
Show me how
Say it in chat
Settle a rule in conversation and the Librarian records it as a fact under Facts & Rules, attached to the table it governs. Every later question on that data applies it, whoever asks, and every view built afterwards carries it.
"A deal is pushed when its close date moved later at any point since the quarter began, counted from the field history after duplicates are removed. Save that as a rule for the opportunities and field history tables."
Or bring the document that already says it
Upload your forecast policy, the sales process doc or the stage-exit criteria like any other file. Querri files a From a document card in the Inbox with the statements it found, each with its page and exact words; tick the ones to keep and they become facts. Dictionary entries attach to the columns they describe. The rules this playbook depends on:
- This quarter: close dates from the first to the last day of the current calendar quarter
- Pushed: the close date moved later at least once since the quarter began
- Stalled: days in the current stage above the 75th percentile of won deals' days in that stage
- Quiet: no recorded call linked to the opportunity in the last 14 days
- Flagged: a Commit deal with any of pushed, stalled or quiet
- Coverage: open pipeline divided by target minus closed won
- Coverage without flagged deals: the same, with flagged Commit deals removed from open pipeline
"Read our forecasting policy and propose the rules it states about forecast categories, close-date changes and coverage. I'll review them in the Inbox."
Where the rules reach
A rule is attached to the data, not to one person's chat, so it follows the data everywhere:
- • Every question asked in chat, by anyone on the team
- • Every view the Librarian builds on that data
- • Every step of a project, including the code it writes
- • Dashboards and scheduled runs, each time they refresh
- • Claude and ChatGPT, when they ask Querri
You stay in control
Every rule is listed under Facts & Rules next to the data it governs, where you can edit or remove it. Rules from a document wait for your tick in the Inbox, and a Worth remembering card is how Querri offers one it noticed itself. Workspaces and roles decide who can change what. Company-wide rules go in Settings → Customize; the Library is where the rest lives.
The payoff on Monday morning
The pipeline meeting stops arguing about what counts as a push and starts on the 15 flagged deals. Tightening a rule is a sentence, not a rebuild of the dashboard.
Frequently asked questions
What does "in doubt" mean here?
Why not just ask the reps?
Which signal should I trust most?
Where does the push count come from?
What is coverage, and why show it twice?
What if we don't have a call recorder?
How is the stalled threshold set?
How much history does this need?
How often should this run?
Other popular resources
Playbook
Renewals below target
Which accounts renewing next quarter are below our usage target?
Playbook
Over budget, and why
Which departments are over budget this month, and why?
Demo
Request a walkthrough
See Querri in action with your own data.
Pricing
Compare plans
Find the right plan for individuals, teams, or enterprise.